Twenty-eight–day mortality among patients with severe or critical COVID-19 in Hong Kong during the early stages of the pandemic
Hong Kong Med J 2023 Oct;29(5):383–95 | Epub 28 Sep 2023
© Hong Kong Academy of Medicine. CC BY-NC-ND 4.0
ORIGINAL ARTICLE CME
Twenty-eight–day mortality among patients with severe or critical COVID-19 in Hong Kong during the early stages of the pandemic
Abram JY Chan, MB, BS, FHKAM (Medicine)1; KC Lung, MB, BS, FRCP1; Judianna SY Yu, MB, BS, FHKAM (Medicine)2; HP Shum, MB, BS, MD3; TY Tsang, MB, ChB, FRCP4
1 Department of Medicine, Pamela Youde Nethersole Eastern Hospital, Hong Kong SAR, China
2 Department of Medicine and Geriatrics, Ruttonjee and Tang Shiu Kin Hospitals, Hong Kong SAR, China
3 Intensive Care, Pamela Youde Nethersole Eastern Hospital, Hong Kong SAR, China
4 Department of Medicine and Geriatrics, Princess Margaret Hospital, Hong Kong SAR, China
Corresponding author: Dr Abram JY Chan (cjy548@ha.org.hk)
 Full paper in PDF
Abstract
Introduction: In 2020, patients with critical
coronavirus disease 2019 (COVID-19) had a 28-day
mortality rate of 30% to 50% worldwide; outcomes
among such patients in Hong Kong were unknown.
This study investigated 28-day mortality and
corresponding risk factors among patients with
severe or critical COVID-19 in Hong Kong.
Methods: This retrospective cohort study included
adult patients with severe or critical COVID-19
who were admitted to three public hospitals in
Hong Kong from 22 January to 30 September
2020. Demographics, comorbidities, symptoms,
treatment, and outcomes were examined.
Results: Among 125 patients with severe or critical
COVID-19, 15 (12.0%) died within 28 days. Overall,
the median patient age was 64 years; 48.0% and 54.4%
of patients had hypertension and obesity, respectively.
Respiratory samples were confirmed severe acute
respiratory syndrome coronavirus 2 RNA–positive
after a median of 3 days. The most common presenting
symptom was fever (80.0% of patients); 45.6% and
32.8% of patients received care in intensive care unit
and required mechanical ventilation, respectively.
In logistic regression analysis comparing 28-day
survivors and non-survivors, factors associated with
greater 28-day mortality were older age (odds ratio
[OR] per 1-year increase in age=1.12, 95% confidence
interval [CI]=1.04-1.21; P=0.002), history of stroke (OR=15.96, 95% CI=1.65-154.66; P=0.017), use of
renal replacement therapy (OR=15.32, 95% CI=2.67-
87.83; P=0.002), and shorter duration of lopinavirritonavir
treatment (OR per 1-day increase=0.82,
95% CI=0.68-0.98; P=0.034).
Conclusion: The 28-day mortality rate among
patients with severe or critical COVID-19 in Hong
Kong was 12.0%. Older age, history of stroke, use
of renal replacement therapy, and shorter duration
of lopinavir-ritonavir treatment were independent
predictors of 28-day mortality.
New knowledge added by this study
- The 28-day mortality rate among patients with severe or critical coronavirus disease 2019 (COVID-19) was lower in this study than in other studies.
- Older age, history of stroke, use of acute renal replacement therapy, and shorter duration of lopinavir-ritonavir were independent predictors of 28-day mortality among patients with severe or critical COVID-19.
- The risk of COVID-19-related mortality is greater among patients who are older, have a history of stroke, require acute renal replacement therapy, and have a shorter course of lopinavir-ritonavir.
- Future studies with larger sample sizes, focused on viral and host factors such as spike gene mutations and interferon-1 immunity status, may help optimise prognosis prediction.
Introduction
Because of its close geographical proximity to
mainland China, Hong Kong was one of the first
regions outside of the Mainland to be affected by
the severe acute respiratory syndrome (SARS) and
coronavirus disease 2019 (COVID-19) epidemics.1 Since 2020, Hong Kong experienced an initial
epidemic wave of imported COVID-19 cases and
spillover effects, as well as subsequent epidemic
waves of imported COVID-19 cases and associated
local transmission.
The COVID-19 epidemic has resulted in millions of deaths worldwide. By late 2020, there
had been multiple country-level analyses in other
regions; however, there were limited data concerning
outcomes among patients with severe or critical
COVID-19 in Hong Kong.2 This study analysed
28-day mortality in these patients and explored risk
factors for mortality among them during the first
several months of the COVID-19 pandemic.
Methods
Study design and data collection
This retrospective multi-centre cohort study
included all adult patients aged ≥18 years with
severe or critical COVID-19 who were admitted to
the medical wards or intensive care units (ICUs) of
three public acute hospitals in Hong Kong from 22
January to 30 September 2020. The three hospitals
were Pamela Youde Nethersole Eastern Hospital,
Princess Margaret Hospital, and Ruttonjee and Tang
Shiu Kin Hospitals.
Patients were diagnosed with COVID-19 if
their respiratory samples contained severe acute
respiratory syndrome coronavirus 2 (SARS-CoV-2)
RNA, according to reverse transcription polymerase
chain reaction (RT-PCR) analysis. Respiratory
samples included nasopharyngeal aspirate,
nasopharyngeal swab, nasopharyngeal aspirate or swab paired with throat swab, or deep throat saliva.
Coronavirus disease 2019 grade was considered mild,
severe, or critical, in accordance with the guidelines
of the Chinese Center for Disease Control and
Prevention.3 Severe COVID-19 was characterised
by dyspnoea, respiratory rate of ≥30 breaths/minute,
blood oxygen saturation <94%, ratio of arterial
oxygen partial pressure to fractional inspired oxygen
(P/F ratio) <300, and/or a 50% increase in lung
infiltrates within 2 days.3 Critical COVID-19 was characterised by respiratory failure, septic shock,
and/or multiple organ dysfunction or failure.3
Hong Kong experienced three epidemic waves
during the study period.4 The first epidemic wave,
from mid-January to early March 2020, occurred
after travellers from mainland China arrived in
Hong Kong during the Chinese New Year. The
second epidemic wave occurred when Hong Kong
residents returned from overseas during the Easter
Holiday, from mid-March to May 2020. The third
epidemic wave extended from early July until late
September 2020; disease transmission may have
originated among commercial airline crews.4 Cases
were classified as imported or local by the Centre for
Health Protection within the Department of Health.
Medical comorbidities were defined according to
the International Classification of Diseases, Tenth
Revision. Comorbidities were selected based on
the STOP-COVID (Study of the Treatment and
Outcomes in Critically Ill Patients With COVID-19)
in the US, which analysed critical COVID-19 cases
at 65 ICUs.5
All medical records and data from the Clinical
Management System of Hospital Authority and
Clinical Information System (IntelliVue Clinical
Information Portfolio; Philips Medical, Amsterdam,
Netherlands) used by the ICUs were retrospectively
reviewed. Upper respiratory tract infection (URI)–related symptoms included cough, rhinorrhoea,
and sore throat. For patients admitted to the
ICU, disease grade on admission was determined
using the APACHE IV (Acute Physiology and
Chronic Health Evaluation IV) score and the SOFA
(Sequential Organ Failure Assessment) score. For
patients requiring mechanical ventilatory support,
disease grade was determined by the P/F ratio on the
day of intubation. Blood test parameters included
minimum lymphocyte count, maximum C-reactive
protein level, maximum lactate dehydrogenase
(LDH) level, and maximum alanine aminotransferase
level. Clinical outcome data included the use of
oxygen supplementation, mechanical ventilation,
vasopressor or inotrope, renal replacement therapy
(RRT), extracorporeal membrane oxygenation, and
cardiopulmonary resuscitation, as well as mortality
and length of stay in the ICU and hospital. Patients
were followed up until death or 31 March 2021, whichever occurred earlier.
The primary outcome was 28-day mortality.
Secondary outcomes included length of stay and
mortality in the ICU and hospital, duration of oxygen
supplementation and mechanical ventilatory support,
and time to viral clearance or time to development
of antibodies against SARS-CoV-2. Viral clearance
was defined as the collection of two consecutive
respiratory samples at least 24 hours apart that were
both SARS-CoV-2–negative, according to RT-PCR
analysis. Cycle threshold (Ct) value indicated the
number of RT-PCR cycles required to amplify
the viral RNA to a detectable level; this value was
inversely related to viral load.6 Minimum Ct values
were recorded to determine maximum viral load.
Each patient’s blood was collected and qualitatively
tested for antibodies against SARS-CoV-2 (ie,
antibodies to SARS-CoV-2 nucleoprotein) using
the Abbott SARS-CoV-2 Immunoglobulin G assay.
Patients were generally released from isolation when
they met the requirement for viral clearance or when
they displayed serum antibodies, in accordance with
recommendations from the Scientific Committee on
Emerging and Zoonotic Diseases under the Centre
for Health Protection within the Department of
Health.7
Statistical analysis
The clinical characteristics and outcomes of patients
with severe or critical COVID-19 were compared
between 28-day survivors and non-survivors.
Subgroup analysis was performed among patients
who received ICU care between 28-day survivors and
non-survivors; it was also performed among patients
whose laboratory reports provided information
regarding viral load (ie, Ct values) in respiratory
samples. The frequencies of these characteristics and
outcomes were expressed as medians ± interquartile
ranges (IQRs) or as numbers of patients and
corresponding percentages.
Based on the population of patients with COVID-19 (n=5080) in Hong Kong on 29 September
2020, where 351 patients had ever displayed serious
or critical disease, the prevalence of outcome
factors in this patient population was 6.9%. Using a
confidence limit of 5% and a design effect of 2, the
sample sizes required to achieve statistical powers
of 80% and 90% were 84 patients and 138 patients,
respectively.
For univariate analyses, the Pearson Chi
squared test or Fisher’s exact test was used to compare
categorical variables; the Mann-Whitney U test was
used to compare continuous variables. Variables with
a P value of <0.1 in univariate analyses were included
in subsequent multivariable analyses. Independent
predictors of 28-day mortality were assessed by
logistic regression analysis using a forward stepwise
approach. Considering the potential for unstable or extreme estimates because of the small sample sizes
in subgroup analyses, logistic regression was not
performed. All statistical analyses were performed
using SPSS (Windows version 23.0; IBM Corp,
Armonk [NY], US).
Results
Study population
From 22 January to 30 September 2020, 1312 adult patients with COVID-19 were admitted to Princess
Margaret Hospital, Pamela Youde Nethersole
Eastern Hospital, and Ruttonjee and Tang Shiu Kin
Hospitals. In total, 125 patients had severe or critical
COVID-19.
Baseline characteristics
The median age was 64 years (IQR=57-75); 69.6% of the patients were men and 93.6% were Chinese
(Table 1). In total, 68.8% of the patients were
admitted in the third epidemic wave and 86.4%
acquired COVID-19 in Hong Kong. Almost half of
the patients had hypertension or obesity (48.0% and
54.4%, respectively); 27.2% of patients had diabetes
mellitus, and 21.6% had ever smoked. The median
duration of symptoms before respiratory samples
were confirmed SARS-CoV-2–positive was 3 days.
The most common presenting symptom was fever
(80.0%), followed by URI-related symptoms (64.8%).
Overall, 5.6% of the patients were asymptomatic
before their positive test result.
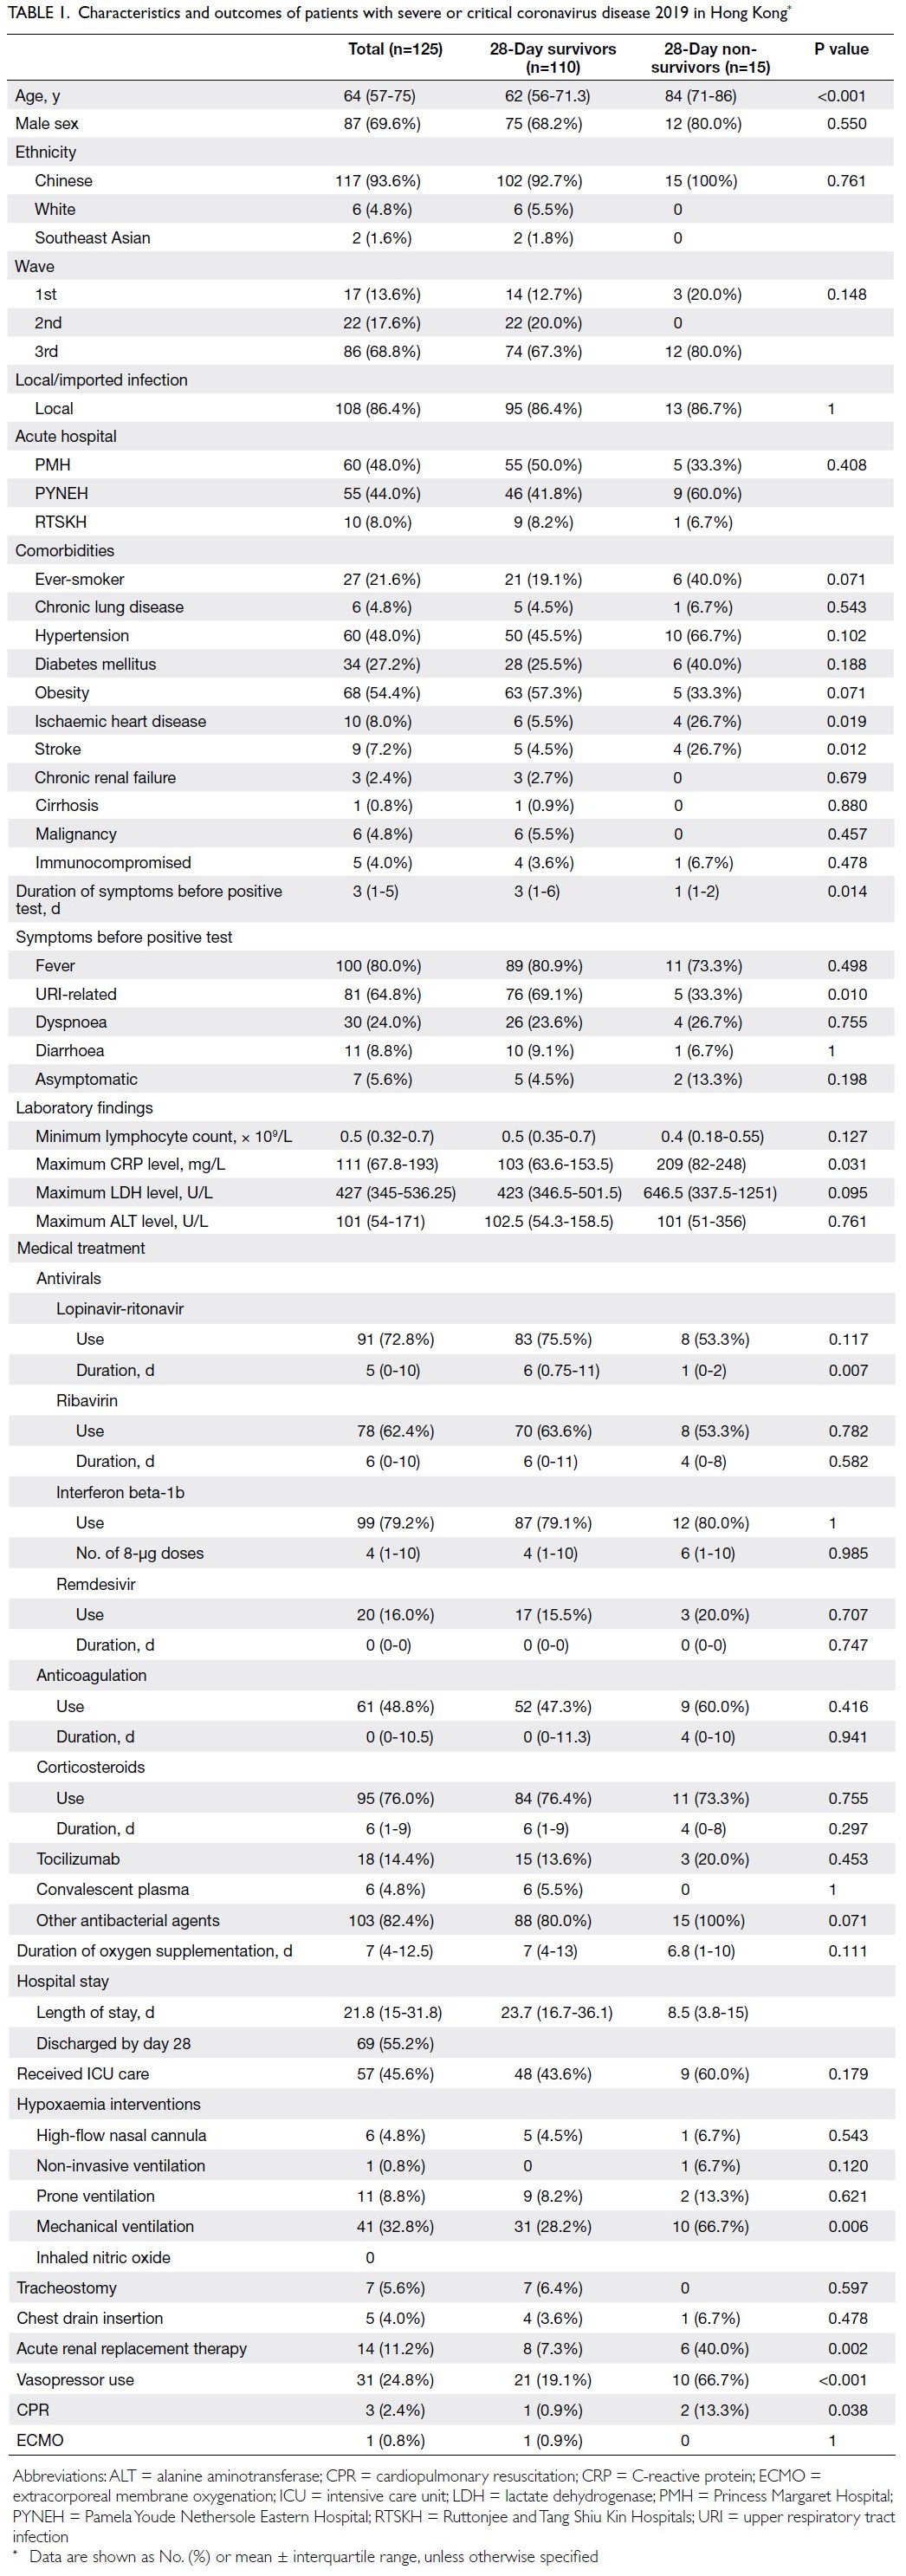
Table 1. Characteristics and outcomes of patients with severe or critical coronavirus disease 2019 in Hong Kong
Interventions
As shown in Table 1, 60% to 80% of patients received
lopinavir-ritonavir, ribavirin, interferon beta-1b, or
corticosteroids. Nearly half of the patients (48.8%)
received anticoagulation treatment; <20% received
remdesivir, tocilizumab, or convalescent plasma.
More than 80% of the patients received antibiotics
during hospitalisation. In total, 45.6% of the patients
received ICU care. One patient received non-invasive
ventilation, 41 patients (32.8%) received mechanical
ventilation, and 11 patients (8.8%) received prone
ventilation. Only one patient required extracorporeal
membrane oxygenation. Approximately one-fourth
of the patients required vasopressor support; 14
patients (11.2%) received acute RRT.
Outcomes
Fifteen patients (12%) died within 28 days (Table 1).
Four additional patients died during hospitalisation;
thus, the overall hospital mortality rate among
patients with severe or critical COVID-19 was 15.2%.
The median hospital length of stay was 21.8 days
(IQR=15-31.8) and the median duration of oxygen
supplementation was 7 days (IQR=4-12.5).
Comparison between 28-day survivors and non-survivors
Twenty-eight–day non-survivors were older than
28-day survivors (84 years [IQR=71-86] vs 62 years
[IQR=56-71.3]; P<0.001) and more frequently had
a history of ischaemic heart disease (26.7% vs 5.5%;
P=0.019) or stroke (26.7% vs 4.5%; P=0.012). Moreover,
non-survivors had a shorter duration of symptoms
before RT-PCR confirmation of SARS-CoV-2
positivity in respiratory samples (1 day [IQR=1-2]
vs 3 days [IQR=1-6]; P=0.014); fewer non-survivors
displayed URI-related symptoms (33.3% vs 69.1%;
P=0.010). Non-survivors had a higher maximum
C-reactive protein level (209 mg/L [IQR=82-248]
vs 103 mg/L [IQR=63.6-153.5]; P=0.031); they more
frequently received mechanical ventilation (66.7% vs
28.2%; P=0.006), acute RRT (40.0% vs 7.3%; P=0.002),
and vasopressor support (66.7% vs 19.1%; P<0.001).
Finally, non-survivors received a shorter duration of
lopinavir-ritonavir treatment (1 day [IQR=0-2] vs 6
days [IQR=0.75-11]; P=0.007) [Table 1].
Independent predictors of 28-day mortality
Logistic regression analysis revealed that age
(odds ratio [OR] per 1-year increase in age=1.12,
95% confidence interval [CI]=1.04-1.21; P=0.002),
history of stroke (OR=15.96, 95% CI=1.65-154.66;
P=0.017), use of acute RRT (OR=15.32, 95% CI=2.67-87.83; P=0.002), and lopinavir-ritonavir duration
(OR per 1-day increase=0.82, 95% CI=0.68-0.98;
P=0.034) were independent predictors of 28-day mortality (Table 2).
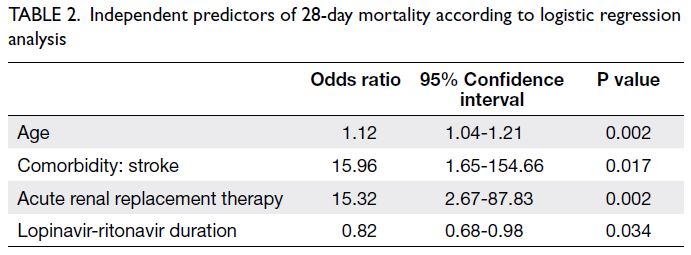
Table 2. Independent predictors of 28-day mortality according to logistic regression analysis
Subgroup analysis of intensive care unit
patients
Comparison between 28-day survivors and nonsurvivors
Among the 57 patients admitted to the ICU, nine
died; the ICU mortality rate was 15.8% (Table 3). The median ICU length of stay was 9.6 days
(IQR=4.6-14.9). Univariate analysis demonstrated that 28-day non-survivors were older; more
frequently had a history of ischaemic heart disease
or stroke; had a shorter duration of symptoms; less
frequently presented with URI-related symptoms;
more frequently received mechanical ventilation,
acute RRT, and vasopressor support; and received
a shorter course of lopinavir-ritonavir treatment.
Other significant differences between non-survivors
and survivors were the minimum lymphocyte count
(0.32 × 10⁹/L [IQR=0.17-0.4] vs 0.4 × 10⁹/L [IQR=0.3-0.6]; P=0.042), maximum LDH level (706 U/L
[IQR=492.2-5255.5] vs 474.5 U/L [IQR=406.3-616];
P=0.043), anticoagulation duration (8 days [IQR=3-
10] vs 12.5 days [IQR=7.5-26.8]; P=0.045), APACHE
IV score upon ICU admission (83 [IQR=64.5-98] vs
54.5 [IQR=46-61.8]; P<0.001), and SOFA score upon
ICU admission (10 [IQR=5.5-13] vs 4 [IQR=3-5.8];
P=0.001).
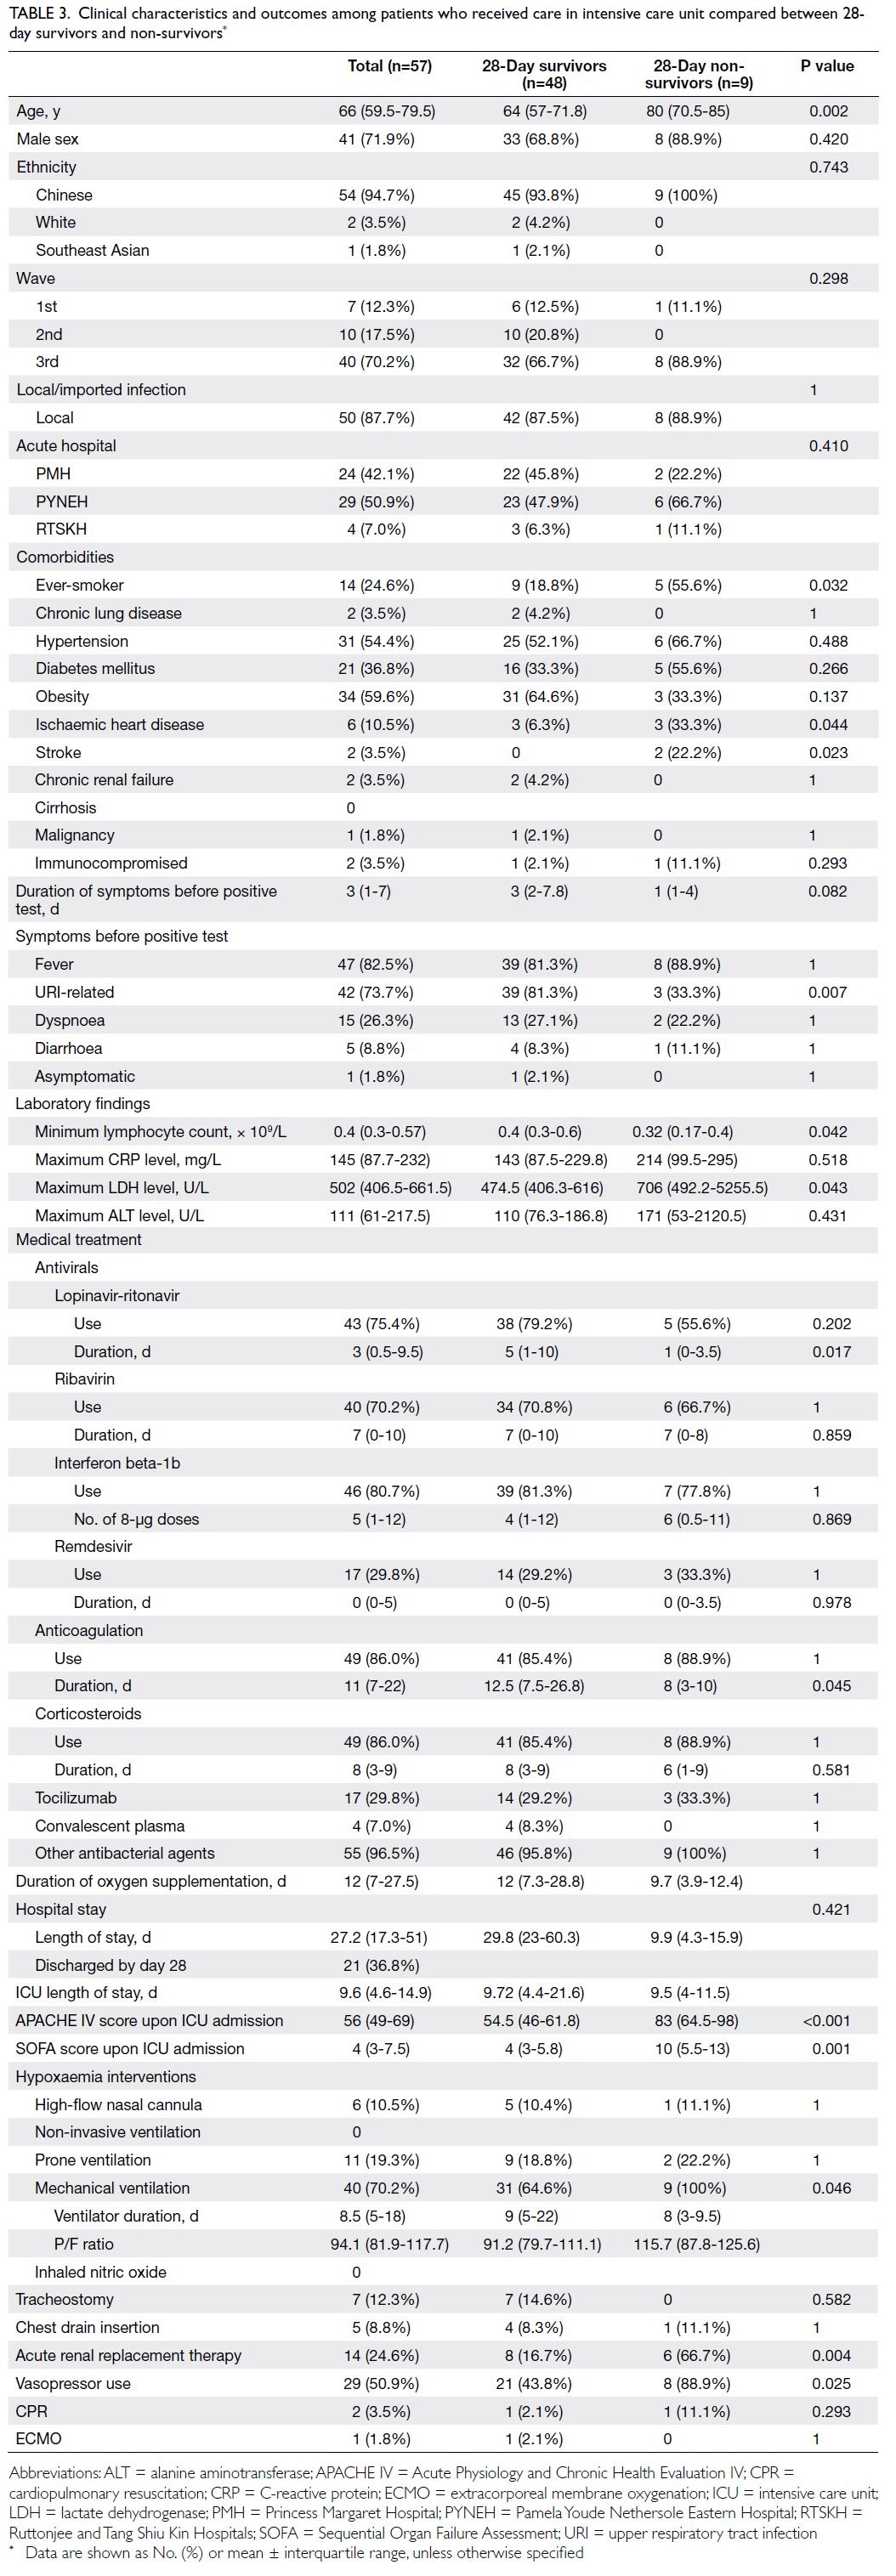
Table 3. Clinical characteristics and outcomes among patients who received care in intensive care unit compared between 28-day survivors and non-survivors
P/F ratio and duration of ventilation
The median P/F ratio on the day of intubation was
94.1 (IQR=81.9-117.7) for patients with COVID-19
requiring mechanical ventilation, and the median
duration of ventilation for all ICU patients with
COVID-19 was 8.5 days (IQR=5-18); these values
were similar between survivors and non-survivors
(Table 3).
Subgroup analysis of cycle threshold values
As shown in Table 4, 28-day non-survivors were older
and more frequently had a history of ischaemic heart
disease or stroke; fewer of them had URI-related
symptoms (36.4% vs 68.8%; P=0.010). Non-survivors
more frequently received mechanical ventilation
(81.8% vs 29.9%; P=0.001), acute RRT (45.5% vs
7.8%; P=0.004), and vasopressor support (81.8%
vs 23.4%; P<0.001); they received a shorter course
of lopinavir-ritonavir treatment (1 day [IQR=0-2]
vs 6 days [IQR=0.75-11]; P=0.010). Additionally,
non-survivors had a lower minimum lymphocyte
count (0.37 × 10⁹/L [IQR=0.16-0.4] vs 0.49 × 10⁹/L
[IQR=0.3-0.7], P=0.041) and lower minimum Ct
value (15.1 [IQR=12.6-18.5] vs 19 [IQR=16.4-22.9];
P=0.004).
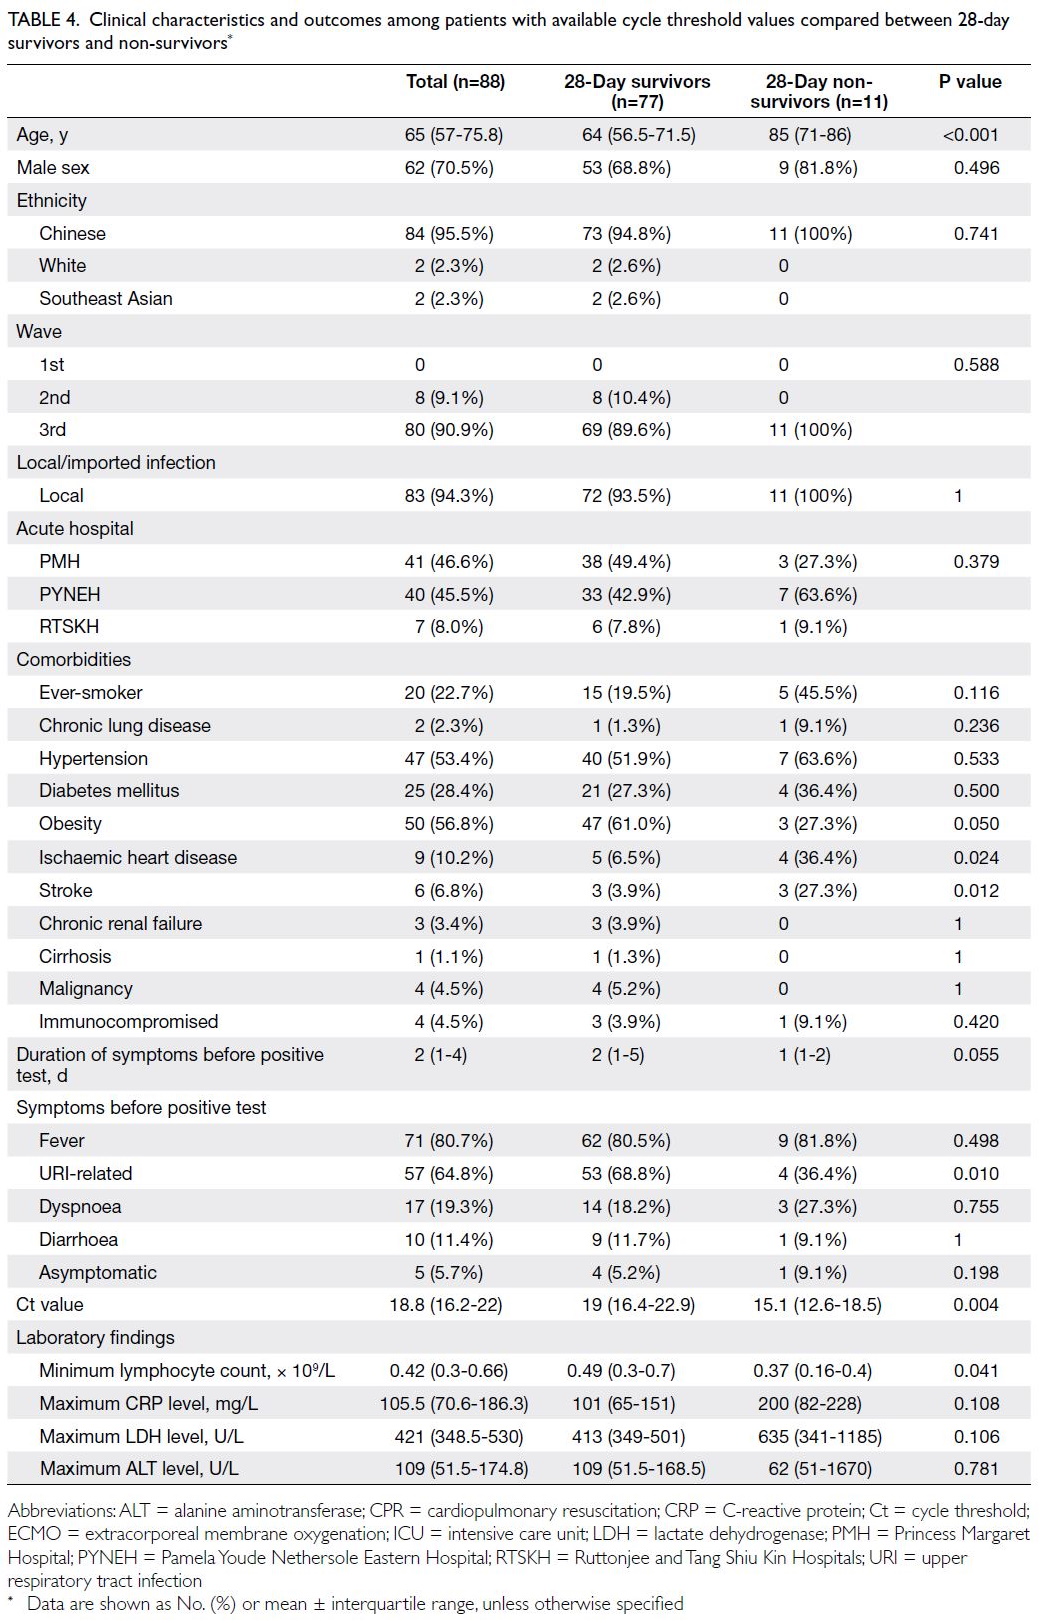
Table 4. Clinical characteristics and outcomes among patients with available cycle threshold values compared between 28-day survivors and non-survivors
Other viral parameters
Among the 125 patients with severe or critical
COVID-19, 38 underwent regular monitoring of
viral load via RT-PCR analysis of respiratory samples
for SARS-CoV-2 RNA; viral clearance was achieved
within a median of 26 days (IQR=19-35). Among the
79 patients with access to antibody testing, a median
of 14 days (IQR=10-18) was elapsed between the
first positive RT-PCR result and the emergence of
antibodies against SARS-CoV-2.
Discussion
Outcomes compared with international data
In this cohort of Hong Kong patients with severe or
critical COVID-19, the 28-day mortality rate was
12.0%; it was 15.8% among such patients who were
admitted to the ICU. In 2020, higher mortality rates
were observed among cohorts in the US (35.4% in
the STOP-COVID cohort5), Italy (ICU and hospital
mortality rates of 48.8% and 53.4%, respectively8),
and China (28-day mortality of 38.7% among
severely and critically ill patients9). Patient baseline
characteristics were similar across the cohorts—the
median age was 60 to 70 years and the most common
comorbidity was hypertension (40%-50%).5 8 9
The proportion of patients requiring mechanical
ventilation varied across cohorts, ranging from 67%
to 87% in the US5 and Italian8 cohorts, whereas it
was 30% in the Chinese cohort.9 Overall, 70.2% of
patients in our ICU subgroup received mechanical
ventilation, which is comparable with the
percentages in the US5 and Italy.8 The P/F ratio in our
cohort was similar to the ratio in the STOP-COVID
(median, 94.1 vs 124),5 reflecting moderate to severe
hypoxaemia. Extracorporeal membrane oxygenation
was required by <3% of patients in our cohort and
the three comparison cohorts. In addition to patient
factors, non-patient factors (eg, ICU bed availability
and patient-to–hospital staff ratio) may affect quality
of care and patient outcomes. Among hospitals
of the Department of Veterans Affairs in the US,
COVID-19 mortality was significantly greater when
ICU demand exceeded 75%.10 Hospitals in the US
with fewer ICU beds and nurses per COVID-19
case also had greater mortality.11 The relatively low
prevalence, limited local transmission, and better
ICU availability in Hong Kong may have contributed
to the lower mortality rate observed in this study.
Independent predictors of 28-day mortality
In our cohort, older age, history of stroke, use
of acute RRT, and shorter duration of lopinavir-ritonavir
treatment were independent predictors
of 28-day mortality. Across studies in 2020, older
age was commonly identified as a risk factor
for COVID-19 mortality.5 8 9 A history of stroke
was also identified as a significant risk factor for
COVID-19 mortality in a large cohort study in
China; higher neutrophil and interleukin-6 levels
were observed in patients with a history of stroke,
possibly because of a stronger inflammatory
response to COVID-19.12 In an American cohort,
the hospital mortality rate was 50% among patients
who developed acute kidney injury, and the highest
mortality risk was present in patients requiring
dialysis.13 In 2020, the mechanism of acute kidney
injury was speculated to involve direct viral invasion
of renal tissue, considering post-mortem findings in China.14 Such injury was closely related to respiratory
failure; in another American cohort, the median
time from mechanical ventilation to the initiation of
acute RRT was 0.3 hour.15
A shorter duration of lopinavir-ritonavir was
identified as a risk factor in our cohort. Lopinavir-ritonavir
was originally a protease inhibitor for
the treatment of human immunodeficiency virus
infection.16 In 2020, this repurposed drug was
included in treatment recommendations in Hong
Kong, where it effectively reduced viral load when
used in combination with ribavirin and/or interferon
beta-1b16; however, there was no difference in
mortality between treatment and control groups as
no patient died during the study.16 Two Chinese
cohorts did not show significant outcome differences
when using lopinavir-ritonavir,17 consistent with
interim results from the World Health Organization
Solidarity trial.18 Lopinavir-ritonavir treatment has
been associated with gastrointestinal upset and liver
dysfunction. Our findings may differ from the results
of other cohort studies because, in the present study,
lopinavir-ritonavir treatment was not administered
to patients with severe liver dysfunction or to those
who were presumably unable to tolerate side-effects
because of their illness. In contrast, up to 80% of
the ICU patients in an American cohort received
hydroxychloroquine and/or azithromycin,5 despite
doubtful efficacy and significant arrhythmia risk
with QT prolongation.19 The selection of antiviral
treatment may partly explain the differences in
mortality among cohorts.
Other risk factors based on univariate
analysis
Regarding viral load, univariate analysis in our
cohort showed that lower minimum Ct values were
associated with greater 28-day mortality. In a study
at Cornell in the US,6 the SARS-CoV-2 viral load
on admission independently predicted the risks of
intubation and mortality. In a Brazilian cohort, Ct
values of <25 were associated with greater mortality.21
The implications of Ct values may become clearer if
patients with mild disease are analysed together.
Lymphopenia on admission has been
associated with worse outcomes in terms of ICU care
requirement and mortality,22 presumably because of
the cytokine storm phenomenon and the infection of
T cells by SARS-CoV-2,19 which infection of T cells
by SARS-CoV-2 was confirmed both in vitro and by
flow cytometry and immunofluorescence studies.20
In the present study, the minimum lymphocyte count
was significantly lower among 28-day non-survivors
in both subgroups. Multi-centre COVID-19 studies
have shown that an elevated LDH level is associated
with a six-fold increase in the likelihood of severe
disease and a 16-fold increase in the likelihood of
mortality.24 In the present study, although univariate analysis showed that the maximum LDH level was
associated with greater 28-day mortality in the
overall cohort, it was not an independent predictor
in logistic regression; this finding may have been
influenced by the sample size.
Strengths
To our knowledge, this large study was the first
investigation in Hong Kong concerning the clinical
characteristics and outcomes of patients with severe
or critical COVID-19; it included three public acute
hospitals and covered three waves of the COVID-19
pandemic in Hong Kong. This study also explored
the impacts of viral parameters and treatment
modalities on 28-day mortality.
Limitations
First, this retrospective study in Hong Kong may have
been subject to confounding factors and selection
bias. The results may not be generalisable to patients
with COVID-19 worldwide. Second, this study
lacked information concerning viral parameters (eg,
specific SARS-CoV-2 strains or mutations). Third,
although some studies showed that inborn errors
in type 1 interferon immunity and autoantibodies
to type 1 interferons were associated with critical
COVID-19,25 26 this study did not explore such factors
because patient immunity data were unavailable.
Fourth, the use of remdesivir was limited; most
treatment courses were solely available to patients
enrolled in studies by the pharmaceutical company
concerned. Finally, other novel treatment options,
including antivirals such as nirmatrelvir/ritonavir
and molnupiravir, anti-inflammatory agents such
as baricitinib and tocilizumab, and neutralising
monoclonal antibodies against SARS-CoV-2, were
not available or introduced during the study period.
Fifth, the sample size of this study did not reach the
statistical powers of 90% and may then not be of high
enough power.
Conclusion
In this Hong Kong cohort, the 28-day mortality
among patients with severe or critical COVID-19
was 12.0%. Age, history of stroke, use of RRT, and
shorter course of lopinavir-ritonavir treatment were
associated with greater 28-day mortality. In the
future, larger studies with a focus on viral and host
factors (eg, mutations in SARS-CoV-2 spike genes
and interferon-1 immunity status) could improve
prognosis prediction.
Author contributions
All authors contributed to the concept or design of the study,
acquisition of data, analysis or interpretation of data, drafting
of the manuscript, and critical revision of the manuscript for
important intellectual content. All authors had full access to the data, contributed to the study, approved the final version
for publication, and take responsibility for its accuracy and
integrity.
Conflicts of interest
All authors have disclosed no conflicts of interest.
Acknowledgement
The authors thank the guidance and support of the following
seniors and colleagues: Dr KK Chan from the Department
of Medicine of Pamela Youde Nethersole Eastern Hospital,
Dr Jenny YY Leung and Dr Alwin WT Yeung from the
Department of Medicine and Geriatrics of Ruttonjee and Tang
Shiu Kin Hospitals, and Dr Dominic HK So from Intensive
Care of Princess Margaret Hospital.
Funding/support
This research received no specific grant from any funding
agency in the public, commercial, or not-for-profit sectors.
Ethics approval
The study protocol was approved by the Hong Kong East
Cluster Research Ethics Committee (Ref No.: HKECREC—2020-115) and the Kowloon West Cluster Research Ethics
Committee (Ref No.: KW/EX-21-005 [155-05]). The
requirement for written informed patient consent was waived
by both Committees due to the retrospective nature of the
research.
References
1. Wong SY, Kwok KO, Chan FK. What can countries learn
from Hong Kong’s response to the COVID-19 pandemic?
CMAJ 2020;192:E511-5. Crossref
2. Ling L, So C, Shum HP, et al. Critically ill patients with
COVID-19 in Hong Kong: a multicentre retrospective
observational cohort study. Crit Care Resusc 2020;22:119-25. Crossref
3. Wu Z, McGoogan JM. Characteristics of and important
lessons from the coronavirus disease 2019 (COVID-19)
outbreak in China: summary of a report of 72 314 cases
from the Chinese Center for Disease Control and
Prevention. JAMA 2020;323:1239-42. Crossref
4. To KK, Chan WM, Ip JD, et al. Unique clusters of severe
acute respiratory syndrome coronavirus 2 causing a large
coronavirus disease 2019 outbreak in Hong Kong. Clin
Infect Dis 2021;73:137-42. Crossref
5. Gupta S, Hayek SS, Wang W, et al. Factors associated with
death in critically ill patients with coronavirus disease 2019
in the US. JAMA Intern Med 2020;180:1436-47. Crossref
6. Magleby R, Westblade LF, Trzebucki A, et al. Impact of
severe acute respiratory syndrome coronavirus 2 viral load
on risk of intubation and mortality among hospitalized
patients with coronavirus disease 2019. Clin Infect Dis
2021;73:e4197-205. Crossref
7. Scientific Committee on Emerging and Zoonotic
Diseases, Centre for Health Protection, Hong Kong SAR
Government. Updated consensus recommendations on
criteria for releasing confirmed COVID-19 patients from
isolation (July 29, 2020). Available from: https://www.chp.gov.hk/files/pdf/updated_consensus_recommendations_on_criteria_for_releasing_confirmed_covid19_patients_from_isolation29july2020.pdf . Accessed 1 Oct 2020.
8. Grasselli G, Greco M, Zanella A, et al. Risk factors
associated with mortality among patients with COVID-19
in intensive care units in Lombardy, Italy. JAMA Intern
Med 2020;180:1345-55. Crossref
9. Yang X, Yu Y, Xu J, et al. Clinical course and outcomes
of critically ill patients with SARS-CoV-2 pneumonia
in Wuhan, China: a single-centered, retrospective,
observational study. Lancet Respir Med 2020;8:475-81. Crossref
10. Bravata DM, Perkins AJ, Myers LJ, et al. Association of
intensive care unit patient load and demand with mortality
rates in US Department of Veterans Affairs hospitals
during the COVID-19 pandemic. JAMA Netw Open
2021;4:e2034266. Crossref
11. Janke AT, Mei H, Rothenberg C, Becher RD, Lin Z,
Venkatesh AK. Analysis of hospital resource availability
and COVID-19 mortality across the United States. J Hosp
Med 2021;16:211-4. Crossref
12. Qin C, Zhou L, Hu Z, et al. Clinical characteristics and
outcomes of COVID-19 patients with a history of stroke in
Wuhan, China. Stroke 2020;51:2219-23. Crossref
13. Chan L, Chaudhary K, Saha A, et al. AKI in hospitalized
patients with COVID-19. J Am Soc Nephrol 2021;32:151-60. Crossref
14. Su H, Yang M, Wan C, et al. Renal histopathological analysis
of 26 postmortem findings of patients with COVID-19 in
China. Kidney Int 2020;98:219-27. Crossref
15. Hirsch JS, Ng JH, Ross DW, et al. Acute kidney injury
in patients hospitalized with COVID-19. Kidney Int
2020;98:209-18. Crossref
16. Hung IF, Lung KC, Tso EY, et al. Triple combination of
interferon beta-1b, lopinavir-ritonavir, and ribavirin in the
treatment of patients admitted to hospital with COVID-19:
an open-label, randomised, phase 2 trial. Lancet
2020;395:1695-704. Crossref
17. Wong CK, Wan EY, Luo S, et al. Clinical outcomes of
different therapeutic options for COVID-19 in two
Chinese case cohorts: a propensity-score analysis.
EClinicalMedicine 2021;32:100743. Crossref
18. WHO Solidarity Trial Consortium; Pan H, Peto R, et al.
Repurposed antiviral drugs for COVID-19—interim WHO
solidarity trial results. N Engl J Med 2021;384:497-511. Crossref
19. Sanders JM, Monogue ML, Jodlowski TZ, Cutrell JB.
Pharmacologic treatments for coronavirus disease 2019
(COVID-19): a review. JAMA 2020;323:1824-36. Crossref
20. Pontelli MC, Castro ÍA, Martins RB, et al. SARS-CoV-2
productively infects primary human immune system
cells in vitro and in COVID-19 patients. J Mol Cell Biol
2022;14:mjac021. Crossref
21. Faíco-Filho KS, Passarelli VC, Bellei N. Is higher viral load
in SARS-CoV-2 associated with death? Am J Trop Med
Hyg 2020;103:2019-21. Crossref
22. Huang I, Pranata R. Lymphopenia in severe coronavirus
disease-2019 (COVID-19): systematic review and meta-analysis.
J Intensive Care 2020;8:36. Crossref
23. Tavakolpour S, Rakhshandehroo T, Wei EX, Rashidian M. Lymphopenia during the COVID-19 infection: what it shows and what can be learned. Immunol Lett 2020;225:31-2. Crossref
24. Henry BM, Aggarwal G, Wong J, et al. Lactate
dehydrogenase levels predict coronavirus disease 2019
(COVID-19) severity and mortality: a pooled analysis. Am
J Emerg Med 2020;38:1722-6. Crossref
25. Zhang Q, Bastard P, Liu Z, et al. Inborn errors of type I
IFN immunity in patients with life-threatening COVID-19.
Science 2020;370:eabd4570. Crossref
26. Bastard P, Rosen LB, Zhang Q, et al. Autoantibodies against
type I IFNs in patients with life-threatening COVID-19.
Science 2020;370:eabd4585. Crossref