Public awareness of preventive measures against COVID-19: an infodemiology study
© Hong Kong Academy of Medicine. CC BY-NC-ND 4.0
ORIGINAL ARTICLE
Public awareness of preventive measures against
COVID-19: an infodemiology study
Alex Mok, MB, ChB1; Oliver OY Mui, MB, ChB1; KP Tang, MB, ChB1; WY Lee, MB, ChB1; CF Ng, MD, FRCSEd (Urol)1; Sunny H Wong, MB, ChB, DPhil (Oxon)2; Martin CS Wong, MD, MB, ChB3,4; Jeremy YC Teoh, MB, BS, FRCSEd (Urol)1,5
1 SH Ho Urology Centre, Department of Surgery, Faculty of Medicine, The Chinese University of Hong Kong, Hong Kong SAR, China
2 Department of Medicine and Therapeutics, Faculty of Medicine, The Chinese University of Hong Kong, Hong Kong SAR, China
3 The Jockey Club School of Public Health and Primary Care, Faculty of Medicine, The Chinese University of Hong Kong, Hong Kong SAR, China
4 Centre for Health Education and Health Promotion, Faculty of Medicine, The Chinese University of Hong Kong, Hong Kong SAR, China
5 Office of Global Engagement, The Chinese University of Hong Kong, Hong Kong SAR, China
Corresponding author: Prof Jeremy YC Teoh (jeremyteoh@surgery.cuhk.edu.hk)
 Full paper in PDF
Abstract
Introduction: The coronavirus disease 2019
(COVID-19) pandemic has led to an increase in
global awareness of relevant public health preventive
measures. This awareness can be explored using
online search trends from major search engines, such
as Google Trends. We investigated the relationship
between public awareness of preventative measures
and progression of the COVID-19 pandemic.
Methods: Search data for five queries (‘mask’, ‘hand
washing’, ‘social distancing’, ‘hand sanitizer’, and
‘disinfectant’) were extracted from Google Trends
in the form of relative search volume (RSV). Global
incidence data for COVID-19 were obtained from 1
January to 30 June 2020. These data were analysed
and illustrated using a global temporal RSV trend
diagram, a geographical RSV distribution chart,
scatter plots comparing geographical RSV with
average number of daily cases, and heat maps
comparing temporal trends of RSV with average
number of daily cases.
Results: Global temporal trends revealed multiple increases in RSV, associated with specific COVID-19–related news events. The geographical
distribution showed top regions of interest for
various preventive measures. For the queries ‘mask’,
‘hand washing’, ‘hand sanitizer’, and ‘disinfectant’,
heat maps demonstrated patterns of early RSV peaks
in regions with lower average number of daily cases,
when the temporal element was incorporated into the analysis.
Conclusion: Early public awareness of multiple
preventive measures was observed in regions with
lower average number of daily cases. Our findings
indicate optimal public health communication
regarding masks, hand washing, hand sanitiser, and
disinfectant in the general population during early
stages of the COVID-19 pandemic. Early public
awareness may facilitate future disease control
efforts by public health authorities.
New knowledge added by this study
- This study focused on the importance of early public awareness in controlling coronavirus disease 2019 (COVID-19); this effect was not extensively investigated in previous studies.
- Early awareness trends among regions with lower average number of daily cases were illustrated using heat maps for the queries ‘mask’, ‘hand washing’, ‘hand sanitizer’, and ‘disinfectant’.
- In contrast to prior infodemiology studies, this study used a global online approach and focused on specific preventive measures recommended by the World Health Organization.
- This study revealed correlations between regions with low average number of daily cases of COVID-19 and early public awareness of multiple preventive measures (ie, ‘mask’, ‘hand washing’, ‘hand sanitizer’, and ‘disinfectant’). Health policies should seek to promote these preventive measures among the general public, which could help to slow the spread of disease. Furthermore, early public awareness may help public health authorities to control future global public health crises.
- This study also investigated the effects of authorities, public figures, and social media on public health awareness. Future healthcare policies should consider these factors to effectively promote correct public health information among the general public.
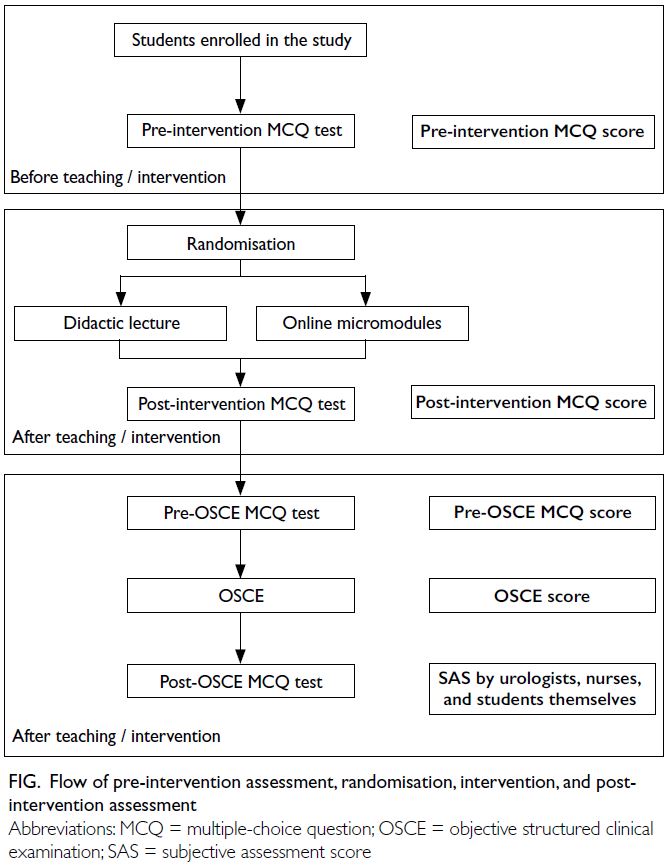
Introduction
Coronavirus disease 2019 (COVID-19) began in
December 2019 in Wuhan, China, and became
a public health crisis affecting millions of people
worldwide.1 On 11 March 2020, the World Health
Organization (WHO) declared that COVID-19
constituted a pandemic2; by 1 September 2020, the
total number of confirmed COVID-19 cases had
exceeded 26 million, with over 800 000 deaths.3
Accordingly, the WHO issued
recommendations to the general public with the goal
of reducing community transmission of COVID-19.
These recommended preventive measures included
the use of masks in specific situations as well as hand
washing, social distancing, and various other disease
prevention strategies.4 In the early and middle
of 2020, there was no specific treatment to cure
the aggressively spreading virus; thus, preventive
measures and public awareness of such information
had important roles in the formulation of public
health policies.
Because of technological advancements in
recent decades, the internet has become a convenient
and effective channel for providing readily accessible
and up-to-date public health information to members
of the general public. In the era of big internet
data, infodemiology—an emerging area of science
that explores the distribution and determinants
of information in electronic media—has been
implemented in multiple areas of modern medicine.5
The analysis of large amounts of internet data enables
researchers to identify trends in online search
behaviour; this information can be used to analyse
relationships among public health communication,
public awareness, and the progression of disease
outbreaks. Indeed, search trends from major search
engines (eg, Google) have been extensively used in
infodemiology and infoveillance studies focused on
outbreak patterns and public awareness,6 particularly
with respect to the Ebola,7 8 9 H1N1 influenza,10 11 and
Zika12 13 14 viruses.
In the context of COVID-19, various
infodemiology investigations have been conducted,
ranging from the impacts of COVID-19 on domestic
abuse15 and psychological distress,16 17 to its
impacts on social media discourse.18 In particular,
previous infodemiology studies used Google data to
examine public awareness of COVID-19 in various
countries.19 20 21 22 23 Analyses of other popular websites,
such as Wikipedia, revealed an increase in public
awareness of health-related topics during the
COVID-19 pandemic.24 However, previous regional
studies did not utilise extensive datasets with respect
to time period, number of countries, and all five
WHO-recommended preventive measures that
were selected in this study. Additionally, previous
studies did not explore how early public awareness
of preventive measures is related to lower average number of daily cases in specific countries.
This study was conducted to explore
relationships between early public awareness of
preventative measures and the progression of the
COVID-19 pandemic through the interpretation of
Google searches regarding multiple public health
preventive measures. The results are expected
to provide guidance for future public health
communication and policy decisions.
Methods
Overview of Google Trends and global
incidence data
To explore the relationship between public
awareness of specific preventive measures against
COVID-19 and the progression of COVID-19
pandemic, search data were extracted from Google
Trends (GT) and compared with global incidence
data for COVID-19. The global incidence data,
measured in number of cases, were retrieved from
the COVID-19 Data Repository by the Centre for
Systems Science and Engineering at Johns Hopkins
University of the US.3 Next, the average number of
daily cases in each country/region was calculated
based on the total number of cases in that country/region between the date of the first locally reported
case and 30 June 2020.3 Google Trends provides
quantitative information regarding actual search requests on Google for specific terms, in the form
of relative search volume (RSV). The RSV is the
volume of a search query for a specified location
and period of time, normalised both geographically
and temporally. The data are expressed using a range
from 0 to 100, depending on the ratio of searches for
that topic to all searches for all topics on Google.25 26
When conducting an infodemiology study using GT
data, accurate keyword, region, and period selections
must be made according to the study aims.25 26
Keyword, region, and period selections
Based on WHO recommendations27 and top-ranked
Google search queries related to COVID-19, we
selected ‘mask’, ‘hand washing’, ‘social distancing’,
‘hand sanitizer’, and ‘disinfectant’ as keywords that
represented public interest in preventive measures
against COVID-19. For each keyword, data were
retrieved from GT according to ‘search topic’ (where
available), which allowed simultaneous analysis of
five queries.28 In contrast to the ‘search term’ option,
‘search topic’ is a ‘group of terms that share the
same concept in any language’.26 By analysing GT
data in the form of search topics, we were able to
accommodate differences in language, translation,
terminology, and spelling of the same concept.
In terms of region selection, GT normalises
data differently according to geographical level.26 In
this study, we retrieved both global- and country-level
data depending on the analysis; global-level
data were used to analyse general trends in public
interest and geographical distribution, whereas
country-level data were used to analyse correlations.
Global incidence data for 190 countries/regions
worldwide are available from the aforementioned
Johns Hopkins University database. To clarify the
terminology used in this study, ‘geographical RSV’
data were normalised according to search volume
in individual regions over a fixed period of time
through analyses of ‘interest by region’ in worldwide
searches. In contrast, ‘temporal RSV’ data were
normalised according to daily search volume over
time, either globally or regionally, through analyses
of ‘interest over time’ in either worldwide or regional
searches.
Furthermore, global incidence data and GT-based
RSV data were collected for the period from 1
January to 30 June 2020. The period selected for GT
data completely matched the study period, consistent
with published guidance.26 As mentioned above, a
primary goal of this study was the examination of
global public awareness during early stages of the
COVID-19 pandemic. To examine awareness before
local outbreaks, a universal start date was selected,
rather than the date of the first reported case in
each country/region (used in the aforementioned
calculation of average number of daily cases).
According to the timeline of WHO’s response to COVID-19,29 the first event involving all three levels
of the WHO (headquarters, regional, country)
occurred on 1 January 2020; accordingly, this date
was selected as the start date for this study. Because
GT data are proportional to all searches for all topics
over time, it is important to note that the GT data
used in this study were last retrieved on 7 November
2020.26
Data analysis
To illustrate the global temporal RSV trends for
each query throughout the study period, global
RSV data for each search topic were extracted and
plotted on line graphs, where RSV was proportional
to worldwide temporal search volume. Moreover, for
each individual query, the geographical distribution
of RSV was analysed and summarised in a table
listing the top 20 regions of interest.
We analysed correlations between geographical
RSV trends for each query and average number of
daily cases in each country/region, whereby RSV
was normalised according to overall regional search
volume throughout the study period. Correlations
were presented using scatter plots, and Pearson
correlation coefficients were calculated. To avoid
pre-analytical errors, we used the default GT setting
of excluding regions with low search volume.
The temporal element of RSV trends in
each country/region is necessary to illustrate
the importance of early awareness. Therefore,
temporal RSV trends in each region were extracted
separately for each query; the RSV for each region
was normalised according to the search volume
of individual days in that region. Temporal RSV
trends were then plotted against the lists of regions
(excluding regions with low search volume) on five
individual heat maps. In each heat map, the y-axis
depicts the region list sorted from highest to lowest
average number of daily cases, whereas the x-axis
represents the timeline from 1 January to 30 June
2020. A three-colour scale of green, yellow, and red
was used to represent low, medium, and high RSV,
respectively.
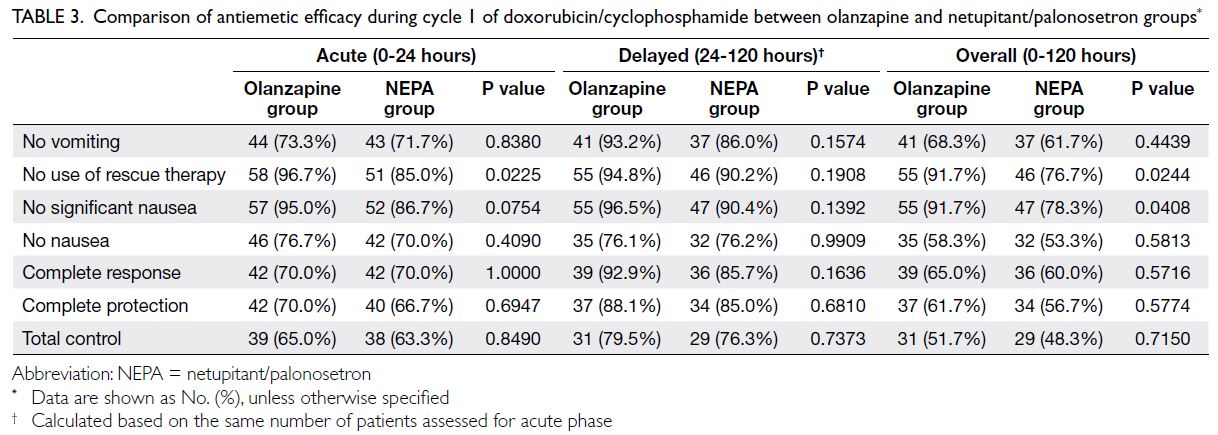
Results
Global temporal trends
Figure 1 shows the global temporal RSV trends of
the five queries in this study, namely, ‘mask’, ‘hand
washing’, ‘social distancing’, ‘hand sanitizer’, and
‘disinfectant’. ‘Mask’ was the query that consistently
demonstrated the greatest global RSV throughout
the study period; at its peak, it exceeded the peak of
the second highest query, ‘hand sanitizer’, by more
than threefold.
Figure 1. Global temporal relative search volume trends for the queries ‘mask’, ‘hand washing’, ‘social distancing’, ‘hand sanitizer’, and ‘disinfectant’ from 1 January to 30 June 2020
With respect to the query ‘mask’, the greatest
peak occurred on 4 April 2020, and three other
peaks were identified (31 January 2020, 26 February 2020, and 21 March 2020). In particular, the peak on
4 April 2020 (RSV=100) corresponded to the WHO’s
announcement of 1 000 000 cases worldwide.30 The
peak on 31 January 2020 (RSV=24) corresponded to
the WHO Director-General’s Statement regarding
the International Health Regulations Emergency
Committee on 30 January 2020, in which COVID-19
was declared a ‘Public Health Emergency of
International Concern’.31 Similarly, the peak on
26 February 2020 (RSV=33) corresponded to the
WHO release of guidelines entitled ‘Rational use
of personal protective equipment for coronavirus
disease’,32 which detailed preventative measures
such as hand hygiene (soap/alcohol sanitiser), use of
masks, and social distancing.
The RSV peak for the query ‘hand sanitizer’
on 13 March 2020 (RSV=30) corresponded to the
WHO’s press release declaring that COVID-19 was
a pandemic, during a media briefing on 11 March
2020.2 This peak was also accompanied by an article
in The New York Times describing a shortage of hand
sanitiser.33
Another major peak, visible without extensive
data analysis, was recorded for the query ‘disinfectant’
on 24 April 2020. Unlike the other peaks, which
gradually increased, the query ‘disinfectant’
increased from an RSV of 1/100 on 23 April 2020 to
11/100 on the following day; this 11-fold increase is
visible in Figure 1.
Geographical distribution
With respect to country-level interest in the query ‘mask’ (online supplementary Table), the highest
RSV was observed in Hong Kong (100), followed by
Singapore (87) and France (75). The highest country-level countrylevel
RSV values for ‘hand washing’ were observed
in Indonesia (100), Vietnam (100), and Hong Kong
(88), while that for ‘social distancing’ were recorded
in Canada (100), Indonesia (95), and Singapore (92).
For ‘hand sanitizer’, the highest country-level RSV
values were recorded in Hong Kong (100), Singapore
(96), and Denmark (91). For ‘disinfectant’, the highest
country-level RSV values were observed in the US
(100), the Philippines (88), and Singapore (79).
The full list of geographical distributions showing
all countries/regions is included in the online supplementary Table.
Correlations between geographical relative
search volume trends and average number of daily cases
Figure 2 shows the correlation between the average
number of daily cases for each country/region and
the LogRSV of each respective search query from
1 January to 30 June 2020. ‘Hand washing’ and
‘social distancing’ were the only queries with mild
correlations, with Pearson correlations (r values) of
-0.44 (‘hand washing’) and -0.38 (‘social distancing’).
No strong correlations were observed for the other
three terms ‘mask’ (r=0.03), ‘hand sanitizer’ (r=0.00),
and ‘disinfectant’ (r=-0.06).
Figure 2. Correlation between country-specific geographical relative search volume (RSV) trend and average number of daily cases for the queries (a) ‘mask’, (b) ‘hand washing’, (c) ‘social distancing’, (d) ‘hand sanitizer’, and (e) ‘disinfectant’. Dots represent countries/regions
Correlations between temporal relative
search volume trends in each region and
average number of daily cases
The online supplementary Figure shows heat maps
for the five search queries. In online supplementary Figure a, a divergence pattern was observed for the
search query ‘mask’, which tended to display an
earlier RSV peak in countries/regions with lower average number of daily cases and a later RSV peak
in countries/regions with higher average number
of daily cases. Among the countries/regions with
an early RSV peak and low average number of daily
cases, Hong Kong had an early RSV peak (100) on
29 January 2020 and an average number of daily
case count of 7.75. Other notable examples include
Taiwan (early RSV peak on 3 February 2020 and
average number of daily case count of 2.79) and
Vietnam (early RSV peak on 31 January 2020 and
average number of daily case count of 2.23). In
contrast, countries/regions with a late RSV peak and high average number of daily cases included the US
(late RSV peak on 4 April 2020 and average number
of daily case count of 16789.11), Brazil (late RSV
peak on 3 April 2020 and average number of daily
case count of 11590.02), and Russia (late RSV peak
on 30 March 2020 and average number of daily case
count of 4327.68).
Similarly, online supplementary Figures b, d, and e show heat maps for the search queries of
‘hand washing’, ‘hand sanitizer’, and ‘disinfectant’,
respectively. Earlier increases in RSV tended to occur
in countries/regions with lower average number of daily cases. However, the heat map of ‘social
distancing’ did not display such a clear pattern; it
showed a sudden global increase in late March 2020
(online supplementary Fig c).
Discussion
Principal findings
Overview
The rapid and aggressive infectivity of COVID-19
requires the general public to be vigilant about
preventive measures. Although prevention is
generally preferred over curative treatment, the
effect of each preventive measure on COVID-19
transmission was unclear during early stages of
the pandemic. For example, during early stages of
the pandemic, there was controversy regarding the
importance of wearing masks to prevent COVID-19
transmission via droplets.34 Indeed, the routine use
of medical masks by normal healthy individuals
had not been recommended by the WHO at the
start of data collection.35 This controversy led to
confusion regarding public health policies, as well
as the stigmatisation of individuals who practised
specific preventive measures. Thus, the present
study retrospectively compared public awareness
of the five aforementioned preventive measures
with the progression of COVID-19; this analysis
was intended to provide guidance regarding public
health communication and policy decisions.
Early awareness in regions with low average
number of daily cases
The heat maps (online supplementary Figs a-d)
show a pattern of early awareness among countries/regions with lower average number of daily cases,
according to analyses of the queries ‘mask’, ‘hand
washing’, ‘hand sanitizer’, and ‘disinfectant’. These
findings suggested that such queries were associated
with the prevention of COVID-19 progression.
Despite these positive findings, we did not find
strong correlations between average number of daily
cases in specific countries/regions and the overall
geographical RSV trend throughout the study
period (Fig 2). This negative result highlighted the
importance of temporal element in the prevention
of COVID-19 transmission, implying that increased
public awareness in an earlier stage of the pandemic
was superior to an increase in the overall volume
of public awareness. Notably, a similar GT-based
study of mask awareness conducted earlier in May
2020 demonstrated a significant correlation (Kendall
rank correlation coefficient [τ] of -0.47) between
mask awareness and average RSV data during a very
early stage of the pandemic (21 January to 11 March
2020).36
Our positive findings regarding mask, hand washing, hand sanitiser, and disinfectant queries
are consistent with the current understanding
of COVID-19 transmission. The major routes
of COVID-19 transmission include contact,
droplets, and aerosols37; importantly, animate
and inanimate surfaces participate in COVID-19
transmission. Face masks may slow the spread of
COVID-19 by reducing aerosol and respiratory
droplet transmission.36 Systematic reviews and
meta-analyses have increasingly shown that mask
usage in community or healthcare settings reduces
COVID-19 transmission.38 39 40 41 42 43 In contrast, a Danish
randomised controlled trial of mask usage in the
general population suggested little to no evidence
that facemask usage alone could prevent transmission
of severe acute respiratory syndrome coronavirus 2,
the virus causing COVID-19.44 Retrospective cohort
studies and case-control studies have provided some
evidence of the preventive effects of mask usage
in communities such as Beijing and Thailand.45 46
Additional randomised controlled trials are needed
to conclusively determine the benefits of mask usage
in the general population.47 Importantly, the routine
maintenance of good hand hygiene can reduce
contact transmission. The use of an alcohol-based
hand sanitiser can disrupt COVID-19 transmission
via surface protein precipitation.37 Our findings
regarding mask and hand washing queries were also
consistent with previous regional infodemiology
studies, including a Taiwanese GT-based study
focused on masks and hand washing.22 In support of
the regional results, the present study illustrated the
importance of early awareness on a global scale.
Despite the lack of a clear pattern of early
awareness concerning the search topic ‘social
distancing’, a meta-analysis has confirmed that
social distancing of ≥1 m reduces COVID-19
transmission.38 Therefore, the lack of positive findings
regarding ‘social distancing’ in the present study
does not necessarily indicate a lack of effectiveness.
Instead, it suggests inadequate public awareness.
Careful analysis of temporal RSV trends for all five
queries (Fig 1) revealed that a lower overall volume
of searches for ‘social distancing’. Although public
awareness of the topics ‘mask’, ‘hand sanitizer’, and
‘disinfectant’ may spontaneously increase because
of various other factors, such as a market shortage,
social distancing during the COVID-19 pandemic
was often implemented via governmental policy,
rather than public awareness.48 49 This lack of public
awareness was demonstrated by the decrease
in confirmed COVID-19 cases in the US after
government-imposed social distancing measures
had been implemented.50 Despite their proven
efficacies, specific preventive measures such as hand
washing were often implemented via public health
initiatives, rather than law enforcement.48 49 Future
studies should seek to identify specific preventive measures beyond public awareness that can guide public health policy decisions regarding the COVID-19 pandemic.
Preventive measures against COVID-19
transmission are only effective if the majority of the
general public acknowledge and practise them with
the correct timing and knowledge. In addition to the
determination of whether a preventive measure is
effective, patterns of early public awareness should be
explored to enhance the preventive effects of public
health communication on COVID-19 transmission.
Effects of authorities, public figures, and social
media on public awareness
As mentioned above, there were multiple instances of a sudden surge in public awareness. One of the most
prominent patterns was the surge in ‘disinfectant’
queries on 24 April 2020. A substantial increase in
global awareness of disinfectant occurred within
a single day, leading to questions regarding the
underlying cause and whether that cause can provide
any insights concerning effective public health
communication. Further investigation revealed a
possible key event related to the timing and content
of the surge in ‘disinfectant’ queries: a speech made
by US President Donald Trump on 23 April 2020, in
which he claimed that disinfectant ‘knocks it [severe
acute respiratory syndrome coronavirus 2] out in a
minute’ and suggested that scientists should conduct
further research in this area.51 Although the scientific
legitimacy of the contents of Trump’s speech was
questionable, the speech itself had a substantial
impact on public awareness, as demonstrated by the
massive number of Google searches in such a short
period of time.
The example above was not the only surge
pattern evident in this study. Buried under the overwhelming search volumes of other queries,
the RSV magnitude of ‘social distancing’ appears
to be relatively negligible (Fig 1). However, closer
inspection of the temporal RSV trend of ‘social
distancing’ reveals an obvious surge from 10 March
2020 to 20 March 2020 (Fig 3). Over an interval of 10
days, the RSV of ‘social distancing’ increased from
3 to 86. Similar to Trump’s speech, a key event in
early March was associated with the surge in ‘social
distancing’ queries. A sentiment of ‘staying home’
was reportedly coined by Florian Reifschneider, a
German engineer; it soon became a trend on social
media and was heavily promoted by prominent
celebrities.52 53 54 55 Although ‘staying home’ and ‘social
distancing’ are distinct key terms, an approximately
overlapping rise and fall pattern is evident upon
comparison of both RSV trends (Fig 4). Notably, the
RSV of ‘staying home’ overlapped with the RSV of
‘social distancing’, but the magnitude of the RSV of
‘staying home’ exceeded the magnitude of the RSV
of ‘social distancing’ by more than 50%; this finding
implies that the public response to social distancing
may have been greater if the concept of social
distancing had been promoted correctly.
Figure 3. Global temporal relative search volume trend for the query ‘social distancing’ from 1 January to 30 June 2020
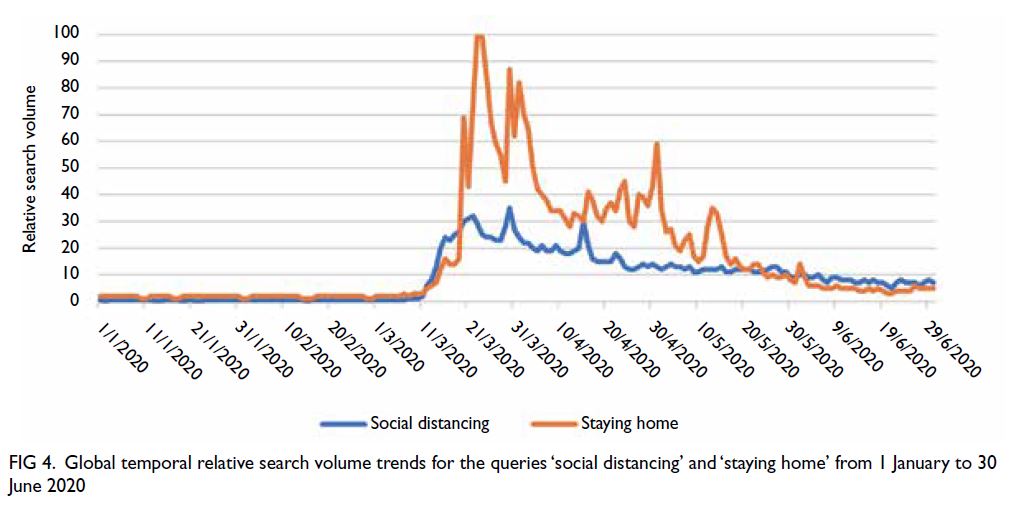
Figure 4. Global temporal relative search volume trends for the queries ‘social distancing’ and ‘staying home’ from 1 January to 30 June 2020
The relationship between sudden surges in
global RSV and key events suggests that the effect of
global public awareness is secondary to promotion
by authorities and public figures. The evolution of
the internet and social media may offer new avenues
for public health communication, particularly in
times of crisis.
Limitations
There were a few limitations in this study. To begin with, GT data constitute an indirect representation of
public awareness; these data do not indicate whether
preventive measures were correctly implemented by the general public. Therefore, the analysis may
have overestimated or underestimated correlations.
Moreover, despite the use of search topics to explore
GT data, the selected keywords may not accurately
represent the concept of each preventive measure
because of variations in language, translation,
terminology, and spelling of the same concept.
Furthermore, to facilitate comparison, this study
exclusively analysed the queries in a single search
platform (ie, Google). This limited focus may have
led to sampling error based on access to Google, as
well as regional search engine preferences. Internet
accessibility also varies among regions; therefore, GT
data may not accurately represent public awareness
in regions with fewer internet users.
An important example is China (not including
Hong Kong), which was regarded as a country with
‘low search volume’ for some queries, despite its
538 million netizens.56 There are multiple reasons for
this bias. First, Google holds <20% of China’s online
search market; Baidu is the most popular search
engine.57 Future studies involving China should
consider the use of Baidu, as in a previous internet
query study specifically focused on China.57 However,
a study by Kang et al56 revealed that Chinese GT data
may be used as a valid complementary source of
information for influenza surveillance in south China.
Second, this study did not consider potential
confounders in the correlation analyses, including
the stringency of public health measures, the
containment capacities of the countries and regions
included, and the degree to which those countries and
regions are vulnerable to public health threats.58 59 60
Third, this study primarily focused on public
awareness and progression of COVID-19 in the early stages of the pandemic; thus, factors identified during later stages of the pandemic were not evaluated.
Finally, research concerning preventive
measures against COVID-19 is largely limited by the
lack of randomised controlled trials. Considering the
current scale of the pandemic, it is neither feasible
nor ethical to conduct individual randomised
controlled trials for each preventive measure in
healthcare or non-healthcare settings. Therefore,
infodemiology studies remain valuable in policy
making for the foreseeable future.
Conclusion
Google Trends offers large-scale population data
regarding public health events. The results of RSV
trend analysis revealed an earlier RSV peak in countries/regions with lower average number of daily cases,
suggesting that early public awareness can slow the
spread of a pandemic. During future pandemics,
global and local public health authorities could
focus on early public awareness to facilitate effective
disease control. Additionally, our findings illustrate
the value of early public health communication
regarding the use of masks, hand washing, hand
sanitiser, and disinfection among the general public
during the COVID-19 pandemic.
Author contributions
Concept or design: JYC Teoh, A Mok.
Acquisition of data: JYC Teoh, A Mok, OOY Mui.
Analysis or interpretation of data: JYC Teoh, A Mok, OOY Mui.
Drafting of the manuscript: All authors.
Critical revision of the manuscript for important intellectual content: All authors.
Acquisition of data: JYC Teoh, A Mok, OOY Mui.
Analysis or interpretation of data: JYC Teoh, A Mok, OOY Mui.
Drafting of the manuscript: All authors.
Critical revision of the manuscript for important intellectual content: All authors.
All authors had full access to the data, contributed to the study, approved the final version for publication, and take responsibility for its accuracy and integrity.
Conflicts of interest
As editors of the journal, CF Ng, MCS Wong and JYC Teoh were not involved in the peer review process. Other authors
have disclosed no conflicts of interest.
Funding/support
This research received no specific grant from any funding agency in the public, commercial, or not-for-profit sectors.
References
1. Wang C, Horby PW, Hayden FG, Gao GF. A novel coronavirus outbreak of global health concern. Lancet
2020;395:470-3. Crossref
2. World Health Organization. WHO Director-General’s
opening remarks at the media briefing on COVID-19-11—March 2020. Available from: https://www.who.int/dg/speeches/detail/who-director-general-s-opening-remarks-at-the-media-briefing-on-covid-19---11-march-2020. Accessed 7 Sep 2020.
3. Johns Hopkins University and Medicine. Coronavirus resource center. Available from: https://coronavirus.jhu.edu/map.html. Accessed 7 Sep 2020.
4. World Health Organization. Coronavirus disease (COVID-19). Available from: https://www.who.int/emergencies/diseases/novel-coronavirus-2019/question-and-answers-hub/q-a-detail/q-a-coronaviruses. Accessed 7 Sep 2020.
5. Eysenbach G. Infodemiology and infoveillance: framework
for an emerging set of public health informatics methods to
analyze search, communication and publication behavior
on the Internet. J Med Internet Res 2009;11:e11. Crossref
6. Chandrasekaran R, Mehta V, Valkunde T, Moustakas E. Topics, trends, and sentiments of tweets about the
COVID-19 pandemic: temporal infoveillance study. J Med
Internet Res 2020;22:e22624. Crossref
7. Alicino C, Bragazzi NL, Faccio V, et al. Assessing Ebola-related
web search behaviour: insights and implications
from an analytical study of Google Trends–based query
volumes. Infect Dis Poverty 2015;4:54. Crossref
8. Odlum M, Yoon S. What can we learn about the Ebola
outbreak from tweets? Am J Infect Control 2015;43:563-71. Crossref
9. van Lent LG, Sungur H, Kunneman FA, van de Velde B, Das E. Too far to care? Measuring public attention and fear for Ebola using Twitter. J Med Internet Res 2017;19:e193. Crossref
10. Dugas AF, Jalalpour M, Gel Y, et al. Influenza forecasting with Google Flu Trends. PLoS One 2013;8:e56176. Crossref
11. Chew C, Eysenbach G. Pandemics in the age of Twitter: content analysis of Tweets during the 2009 H1N1 outbreak. PLoS One 2010;5:e14118. Crossref
12. Pruss D, Fujinuma Y, Daughton AR, et al. Zika discourse in
the Americas: a multilingual topic analysis of Twitter. PLoS
One 2019;14:e0216922. Crossref
13. Daughton AR, Paul MJ. Identifying protective
health behaviors on Twitter: observational study of
travel advisories and Zika virus. J Med Internet Res
2019;21:e13090. Crossref
14. Stefanidis A, Vraga E, Lamprianidis G, et al. Zika in Twitter: temporal variations of locations, actors, and concepts. JMIR Public Health Surveill 2017;3:e22. Crossref
15. Xue J, Chen J, Chen C, Hu R, Zhu T. The hidden pandemic
of family violence during COVID-19: unsupervised
learning of tweets. J Med Internet Res 2020;22:e24361. Crossref
16. Chen X, Zhang SX, Jahanshahi AA, et al. Belief in a
COVID-19 conspiracy theory as a predictor of mental
health and well-being of health care workers in Ecuador:
cross-sectional survey study. JMIR Public Health Surveill
2020;6:e20737. Crossref
17. Rana U, Singh R. Emotion analysis of Indians using google
trends during COVID-19 pandemic. Diabetes Metab Syndr
2020;14:1849-50. Crossref
18. Chen E, Lerman K, Ferrara E. Tracking social media
discourse about the COVID-19 pandemic: development of
a public coronavirus Twitter data set. JMIR Public Health
Surveill 2020;6:e19273. Crossref
19. Effenberger M, Kronbichler A, Shin JI, Mayer G, Tilg H,
Perco P. Association of the COVID-19 pandemic with
internet search volumes: a Google TrendsTM analysis.
Int J Infect Dis 2020;95:192-7. Crossref
20. Hu D, Lou X, Xu Z, et al. More effective strategies are
required to strengthen public awareness of COVID-19:
evidence from Google Trends. J Glob Health
2020;10:011003. Crossref
21. Husain I, Briggs B, Lefebvre C, et al. Fluctuation of public
interest in COVID-19 in the United States: retrospective
analysis of Google Trends search data. JMIR Public Health
Surveill 2020;6:e19969. Crossref
22. Husnayain A, Fuad A, Su EC. Applications of Google
search trends for risk communication in infectious disease
management: a case study of the COVID-19 outbreak in
Taiwan. Int J Infect Dis 2020;95:221-3. Crossref
23. Rovetta A, Bhagavathula AS. COVID-19–related web
search behaviors and infodemic attitudes in Italy:
infodemiological study. JMIR Public Health Surveill
2020;6:e19374. Crossref
24. Chrzanowski J, Sołek J, Fendler W, Jemielniak D. Assessing
public interest based on Wikipedia’s most visited medical
articles during the SARS-CoV-2 outbreak: search trends
analysis. J Med Internet Res 2021;23:26331. Crossref
25. Google. FAQ about Google Trends data. Available from:
https://support.google.com/trends/answer/4365533?hl=en&dark=1. Accessed 7 Sep 2020.
26. Mavragani A, Ochoa G. Google Trends in infodemiology
and infoveillance: methodology framework. JMIR Public
Health Surveill 2019;5:e13439. Crossref
27. World Health Organization. Advice for the public:
coronavirus disease (COVID-19). Available from: https://www.who.int/emergencies/diseases/novel-coronavirus-2019/advice-for-public. Accessed 7 Sep 2020.
28. Smallwood C, editor. The Complete Guide to Using Google in Libraries: Instruction, Administration, and Staff
Productivity. Volume 1. Lanham, Maryland: Rowman & Littlefield; 2015.
29. World Health Organization. Listings of WHO’s response to COVID-19. 2020; Available from: https://www.who.int/news/item/29-06-2020-covidtimeline. Accessed 7 Sep 2020.
30. World Health Organization. Coronavirus disease 2019 (COVID-19) Situation Report–75. 2020. Available from: https://www.who.int/docs/default-source/coronaviruse/situation-reports/20200404-sitrep-75-covid-19.pdf?sfvrsn=99251b2b_4. Accessed 7 Sep 2020.
31. World Health Organization. WHO Director-General’s statement on IHR Emergency Committee on Novel
Coronavirus (2019-nCoV). Available from: https://www.who.int/dg/speeches/detail/who-director-general-s-statement-on-ihr-emergency-committee-on-novel-coronavirus-(2019-ncov) Accessed 7 Sep 2020.
32. World Health Organization. Rational use of personal protective equipment for coronavirus disease 2019
(COVID-19) and considerations during severe shortages.
2020. Available from: https://www.who.int/publications/i/item/rational-use-of-personal-protective-equipment-for-coronavirus-disease-(covid-19)-and-considerations-during-severe-shortages. Accessed 7 Sep 2020.
33. Suthivarakom G. Coronavirus has caused a hand sanitizer shortage. What should you do? The New York Times. 11 March 2020. Available from: https://www.nytimes.com/2020/03/11/smarter-living/wirecutter/coronavirus-hand-sanitizer.html. Accessed 7 Sep 2020.
34. Feng S, Shen C, Xia N, Song W, Fan M, Cowling BJ. Rational use of face masks in the COVID-19 pandemic.
Lancet Respir Med 2020;8:434-6. Crossref
35. World Health Organization. Coronavirus disease (COVID-19) advice for the public: when and how to use masks. Available from: https://www.who.int/emergencies/diseases/novel-coronavirus-2019/advice-for-public/when-and-how-to-use-masks. Accessed 7 Sep 2020.
36. Wong SH, Teoh JY, Leung CH, et al. COVID-19 and public interest in face mask use. Am J Respir Crit Care Med 2020;202:453-5. Crossref
37. Pradhan D, Biswasroy P, Kumar Naik P, Ghosh G, Rath G. A review of current interventions for COVID-19 prevention. Arch Med Res 2020;51:363-74. Crossref
38. Chu DK, Akl EA, Duda S, et al. Physical distancing, face masks, and eye protection to prevent person-to-person transmission of SARS-CoV-2 and COVID-19: a systematic
review and meta-analysis. Lancet 2020;395:1973-87. Crossref
39. Howard J, Huang A, Li Z, et al. An evidence review of face masks against COVID-19. Proc Natl Acad Sci U S A
2021;118:e2014564118. Crossref
40. MacIntyre CR, Chughtai AA. A rapid systematic review of the efficacy of face masks and respirators against
coronaviruses and other respiratory transmissible viruses
for the community, healthcare workers and sick patients.
Int J Nurs Stud 2020;108:103629. Crossref
41. Tabatabaeizadeh SA. Airborne transmission of COVID-19 and the role of face mask to prevent it: a systematic review and meta-analysis. Eur J Med Res 2021;26:1. Crossref
42. Fouladi Dehaghi B, Ghodrati-Torbati A, Teimori G, Ibrahimi Ghavamabadi L, Jamshidnezhad A. Face masks
vs. COVID-19: a systematic review. Invest Educ Enferm
2020;38:e13. Crossref
43. Li Y, Liang M, Gao L, et al. Face masks to prevent transmission of COVID-19: a systematic review and meta-analysis. Am J Infect Control 2021;49:900-6. Crossref
44. Bundgaard H, Bundgaard JS, Raaschou-Pedersen DE, et al. Effectiveness of adding a mask recommendation to other
public health measures to prevent SARS-CoV-2 infection
in Danish mask wearers: a randomized controlled trial.
Ann Intern Med 2021;174:335-43. Crossref
45. Wang Y, Tian H, Zhang L, et al. Reduction of secondary transmission of SARS-CoV-2 in households by face mask use, disinfection and social distancing: a cohort study in Beijing, China. BMJ Glob Health 2020;5:e002794. Crossref
46. Doung-Ngern P, Suphanchaimat R, Panjangampatthana A,
et al. Case-control study of use of personal protective
measures and risk for SARS-CoV 2 infection, Thailand.
Emerg Infect Dis 2020;26:2607-16. Crossref
47. World Health Organization. Mask use in the context of COVID-19: Interim guidance, 1 December 2020. Available
from: https://apps.who.int/iris/handle/10665/337199. Accessed 7 Sep 2020.
48. International Monetary Fund. Policy responses to COVID-19. Available from: https://www.imf.org/en/Topics/imf-and-covid19/Policy-Responses-to-COVID-19. Accessed 7 Sep 2020.
49. Mervosh S, Lu D, Swales V. See which states and cities have told residents to stay at home. The New York Times.
20 April 2020. Available from: https://www.nytimes.com/interactive/2020/us/coronavirus-stay-at-home-order.html. Accessed 7 Sep 2020.
50. Courtemanche C, Garuccio J, Le A, Pinkston J, Yelowitz A. Strong social distancing measures in the United States reduced the COVID-19 growth rate. Health Aff (Millwood) 2020;39:1237-46. Crossref
51. Agence France-Presse. Experts rubbish Donald Trump’s
suggestion to inject disinfectant to kill coronavirus. South
China Morning Post. 24 April 2020. Available from: https://www.scmp.com/news/world/united-states-canada/article/3081503/experts-rubbish-trumps-suggestioninject?
module=perpetual_scroll&pgtype=article&campai
gn=3081503. Accessed 7 Sep 2020.
52. American Medical Association. AMA, AHA, ANA: #StayHome to confront COVID-19. Available from: https://www.ama-assn.org/press-center/press-releases/ama-aha-ana-stayhome-confront-covid-19. Accessed 7 Sep 2020.
53. Hudson A. Busy Philipps Joins Cameo to Record “Stay the Fuck Home” messages for coronavirus. Exclaim!. 17 March 2020. Available from: https://exclaim.ca/film/article/busy_philipps_joins_cameo_to_record_stay_the_fuck_home_messages_for_coronavirus. Accessed 7 Sep 2020.
54. #StayTheFuckHome. A movement to stop the COVID-19 pandemic. Available from: https://staythefuckhome.com/. Accessed 7 Sep 2020.
55. Ehrlich B. Taylor Swift urges fans to stay home amid COVID-19 outbreak. Rolling Stone. 15 March 2020. Available from: https://www.rollingstone.com/music/music-news/taylor-swift-urges-fans-to-stay-home-amid-covid-19-outbreak-967629/. Accessed 7 Sep 2020.
56. Kang M, Zhong H, He J, Rutherford S, Yang F. Using Google Trends for influenza surveillance in south China.
PLoS One 2013;8:e55205. Crossref
57. Yuan, Q, Nsoesie EO, Lv B, Peng G, Chunara R, Brownstein JS. Monitoring influenza epidemics in China with search query from Baidu. PLoS One 2013;8:e64323. Crossref
58. World Health Organization. e-SPAR State Party Annual Report. 2020. Available from: https://extranet.who.int/e-spar. Accessed 7 Sep 2020.
59. Wong MC, Huang J, Teoh J, Wong SH. Evaluation on different non-pharmaceutical interventions during COVID-19 pandemic: an analysis of 139 countries. J Infect 2020;81:e70-1. Crossref
60. Wong MC, Teoh JY, Huang J, Wong SH. The potential impact of vulnerability and coping capacity on the pandemic control of COVID-19. J Infect 2020;81:816-46. Crossref