Identification of fragile X pre-mutation carriers in the Chinese obstetric population using a robust FMR1 polymerase chain reaction assay: implications for screening and prenatal diagnosis
Hong Kong Med J 2017 Apr;23(2):110–6 | Epub 3 Mar 2017
DOI: 10.12809/hkmj164936
© Hong Kong Academy of Medicine. CC BY-NC-ND 4.0
ORIGINAL ARTICLE
Identification of fragile X pre-mutation carriers
in the Chinese obstetric population using a
robust FMR1 polymerase chain reaction assay:
implications for screening and prenatal diagnosis
Yvonne KY Cheng, MRCOG, FHKAM (Obstetrics and Gynaecology)1;
Christina SW Lin, MSc1;
Yvonne KY Kwok, PhD1;
YM Chan, MRCOG, FHKAM (Obstetrics and Gynaecology)1;
TK Lau, FRCOG, FHKAM (Obstetrics and Gynaecology)2;
TY Leung, FRCOG, FHKAM (Obstetrics and Gynaecology)1;
KW Choy, PhD1
1 Department of Obstetrics and Gynaecology, The Chinese University of
Hong Kong, Shatin, Hong Kong
2 Fetal Medicine Centre, Paramount Medical Centre, Hong Kong
Corresponding author: Dr KW Choy (richardchoy@cuhk.edu.hk)
 Full
paper in PDF
Full
paper in PDF
Abstract
Introduction: There is significant morbidity
associated with fragile X syndrome. Unfortunately,
most maternal carriers are clinically silent during their
reproductive years. Because of this, many experts
have put forward the notion of preconception or
prenatal fragile X carrier screening for females. This
study aimed to determine the prevalence of fragile
X syndrome pre-mutation and asymptomatic full-mutation
carriers in a Chinese pregnant population,
and the distribution of cytosine-guanine-guanine
(CGG) repeat numbers using a robust fragile X
mental retardation 1 (FMR1) polymerase chain
reaction assay.
Methods: This was a cross-sectional survey in
prospectively recruited pregnant women from a
university hospital in Hong Kong. Chinese pregnant
women without a family history of fragile X syndrome
were recruited between April 2013 and May 2015.
A specific FMR1 polymerase chain reaction assay
was performed on peripheral blood to determine
the CGG repeat number of the FMR1 gene. Prenatal
counselling was offered to full-mutation and pre-mutation
carriers.
Results: In 2650 Chinese pregnant women, two
individuals with pre-mutation alleles (0.08%, one
in 1325) and one asymptomatic woman with full-mutation
(0.04%, one in 2650) alleles were identified.
The overall prevalence of pre-mutation and full-mutation
alleles was 0.11% (1 in 883). Furthermore,
30 (1.1%) individuals with intermediate alleles were
detected. In the 2617 women with normal CGG
repeats, the most common CGG repeat allele was 30.
Conclusions: The overall prevalence of pre-mutation
and asymptomatic full-mutation carriers
in the Chinese pregnant population was one in 883,
detected by a new FMR1 polymerase chain reaction
assay.
New knowledge added by this study
- This study reports the prevalence of fragile X pre-mutation carriers in Chinese pregnant women.
- The prevalence of pre-mutation and asymptomatic full-mutation carriers was one in 883 and disproves the belief that carrier rates in Chinese are extremely low.
- Maternal fragile X carriers are not rare in a Chinese population. Women should be offered the option of carrier screening during the preconception period or prenatally.
Introduction
Fragile X syndrome (FXS) is the second leading
genetic cause of intellectual disability after Down
syndrome,1 affecting one in 4000 males and one
in 8000 females.2 The typical phenotypes include
behavioural abnormalities, autism, cognitive
impairment, and dysmorphism such as large
protruding ears, elongated face, and macroorchidism
in male patients. This syndrome is caused by a
defective fragile X mental retardation 1 (FMR1)
gene located on the X chromosome, where there
is an unstable cytosine-guanine-guanine (CGG)
trinucleotide repeat in the 5’ untranslated region.3
Normally the number of CGG repeats is less than
44, but if it is more than 200 (full mutation), the
FMR1 gene expression will be ‘shut down’ due to
methylation of its promoter. The protein product,
which is essential for normal neurodevelopment,
is thus not produced. When the repeat number is
between 55 and 200 (pre-mutation),4 the FMR1
gene can be expressed but the repeat number is
potentially expandable to full mutation during its
transmission to the next generation. Such risk of
expansion is increased with the size of the repeat
number, and is close to 100% when the size of CGG
repeats is 100 or more. In addition, pre-mutation
carriers are at risk of developing fragile X–associated
primary ovarian insufficiency (FXPOI) and fragile
X–associated tremor/ataxia syndrome (FXTAS) in
late adult life, although they are mentally normal.5 6
Intermediate alleles are repeat numbers between 45
and 54, and individuals carrying theses alleles are at
risk of expanding into pre-mutation but not into full
mutation.7 8 9
Because of the significant morbidity associated
with FXS, and since most maternal carriers are
clinically silent during their reproductive years,
many experts have put forward the notion of
preconception or prenatal fragile X carrier screening
for females.10 The prevalence of pre-mutation carriers
will directly affect the efficacy and cost-effectiveness
of screening, but this varies widely between different
ethnic groups and countries. While it is well known
that Caucasians and Jews have high carrier rates of
1 in 100-250,10 many studies in Chinese populations
report an extremely low carrier rate.11 12 13 Among
these studies, the largest included 10 046 newborn
boys, but identified only six pre-mutation carriers
(1 in 1674).13 These studies, however, were limited
by the fact that the screening methods used were
polymerase chain reaction (PCR) assays that were
not accurate or were unable to amplify long CGG
repeats.14 In addition, the screening of a low-risk
Chinese pregnant population has not been studied.
Recently, we have validated a new fragile-X-related–specific
PCR assay that utilises a low-cost
capillary electrophoresis instrument and the
FragilEase reagent kit (PerkinElmer Inc, Waltham
[MA], US), and is able to detect CGG repeat numbers
at a level as high as 1000.14 The repeat numbers
analysed by this new assay were highly concordant
with those obtained from the conventional reference
method (PCR + Southern blot) in 112 archived
samples, including 25 samples of full mutation
(the largest allele size measured at 1380 repeats).
The intra-assay (coefficient of variation <2.5%) and
inter-assay imprecision was within 1 CGG repeat.14
The objectives of this study were to determine the
prevalence of FXS pre-mutation carriers and the
distribution of repeat numbers in the Chinese
pregnant population in Hong Kong, using this FXS-specific
PCR assay.
Methods
This was a prospective observational study conducted
at a university hospital in Hong Kong between April
2013 and May 2015. Chinese pregnant women
between 4 and 41 weeks of gestation, at or above
the age of 18 years who could understand English or
Chinese and give informed consent were eligible for
the study. Eligible women were approached in the
antenatal clinic or the antenatal ward by the research
assistant at one convenient time-point once per day
and invited to participate in the study. Women with a
known family history of FXS were excluded to avoid
an over-representation of the pre-mutation carrier
rate in the general population, so that data obtained
would be more useful in determining whether
population-based screening is beneficial. Pre-test
counselling was given by a research assistant with
a bachelor’s and master’s degree in human genetics.
Printed information about fragile X carrier testing
was provided and included information about the
clinical features and maternal inheritance of the
disease. It was also explained to participants that
genetic counselling would be offered if they were
found to have an increased CGG repeat number of
≥45. Testing was entirely voluntary, and no payment
was received by the participants. Written informed
consent was obtained. Two millilitres of maternal
blood was collected in an EDTA tube from each
participant. The FMR1 CGG repeat result could
be obtained within 1 day but study samples were
processed in batches so results were available
between 1 day and 7 months later. Women were
informed prior to consenting that the result might
not be available before delivery.
The FMR1 CGG repeat status of each sample
was tested at a screen cut-off value of ≥45.14 The
details of the PCR method are described below. All
participants had the right to access personal data
and study results. Positive test results (≥45 CGG
repeats) would be made known to the participants,
and genetic counselling would be provided. Where
indicated, prenatal and postnatal diagnoses were
offered by means of chorionic villus sampling or
amniocentesis and cord blood or neonatal blood
respectively, with analysis of CGG repeats in the
extracted DNA from the sample using the same PCR
method.
Approval for the study was obtained from
the institutional review board of the Joint-Chinese
University of Hong Kong–New Territories East
Cluster Clinical Research Ethics Committee (CRE-2013.055).
Polymerase chain reaction–only assay for
detection of CGG repeats in FMR1 gene
DNA preparation
Genomic DNA was extracted from peripheral blood
samples using DNeasy Blood & Tissue Kit according
to the manufacturer’s protocol (Qiagen, Hilden,
Germany) or using the automatic system, chemagic
Prepito-D, following the manufacturer’s protocol
(PerkinElmer, Turku, Finland).
Polymerase chain reaction analysis of fragile X mutations
The FMR1 repeat region of each DNA sample was
amplified using the FragilEase PCR reagent kit
following the manufacturer’s protocol (PerkinElmer).
It involved a forward (TCA GGC GCT CAG CTC
CGT TTC GGT TTC A) and a reverse primer
(FAM-AAG CGC CAT TGG AGC CCC GCA CTT
CC) anneal to FMR1-specific sequence upstream
and downstream of the trinucleotide repeat
region, respectively. Thermal cycle amplification
of the highly GC-rich trinucleotide repeat region
produced fragments whose size was directly related
to the number of trinucleotide repeats present in the
DNA sample. Two female reference DNA samples
(one pre-mutation carrier [30/80 repeats] and one
individual with full mutation [20/200 repeats]) for
evaluating the analytical performance of the assay
were obtained from the Coriell Institute for Medical
Research (Camden, US). The known repeat sizes of
the reference samples were concurrently amplified
and used to calculate the CGG repeat numbers of
the unknown samples.
Purification of the polymerase chain reaction product
Polymerase chain reaction products were purified
using NucleoFast 96 PCR plate (MACHEREY-NAGEL
GmbH & Co KG, Germany) or the PureLink
PCR Micro Kit (Invitrogen, Carlsbad [CA], US).
Purification procedures were performed according
to the manufacturer’s instructions with a final
elution volume of 20 µL.
Fragment sizing with microfluidic capillary
electrophoresis
The fragment size for the sample was analysed using
2100 Bioanalyzer (Agilent Technologies, Santa Clara
[CA], US). In this study, 3 µL of the purified PCR
product and 3 µL of the 7500-size marker reagent
(from an Agilent DNA 7500 kit) were loaded into
each of the 12 wells of the Bioanalyzer chip. A
standard curve was constructed from the two female
reference samples (Coriell NA20240 [30/80 CGG
repeats] and NA20239 [20/200 CGG repeats]) with
known repeat size. This allowed the determination
of CGG repeat size with higher accuracy.
Report of FMR1 fragment size
FraXsoft analysis software (PerkinElmer) was
used to calculate the CGG repeat lengths by
utilising the base pair size data exported from the
bioanalyser. Fragment sizes that were below 200
CGG repeats were interpolated from their base-pair
electrophoresis result using a linear regression
constructed between the four allele values of the
two Coriell female reference samples. Larger repeat
sizes (>200 repeats) were calculated by extrapolation
along the same regression line.14
Results
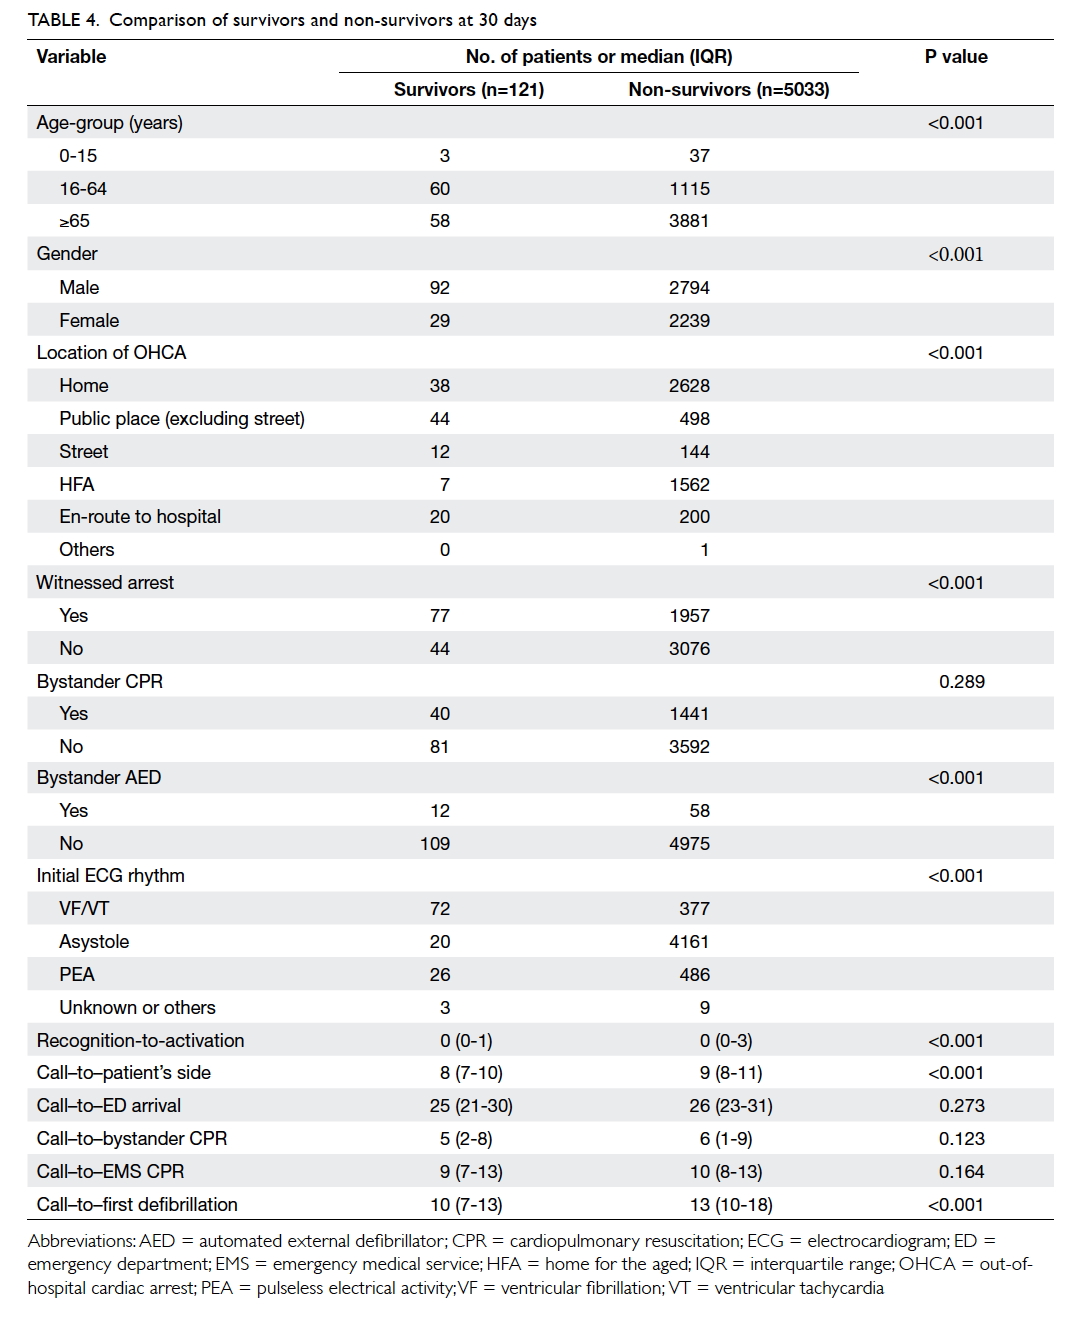
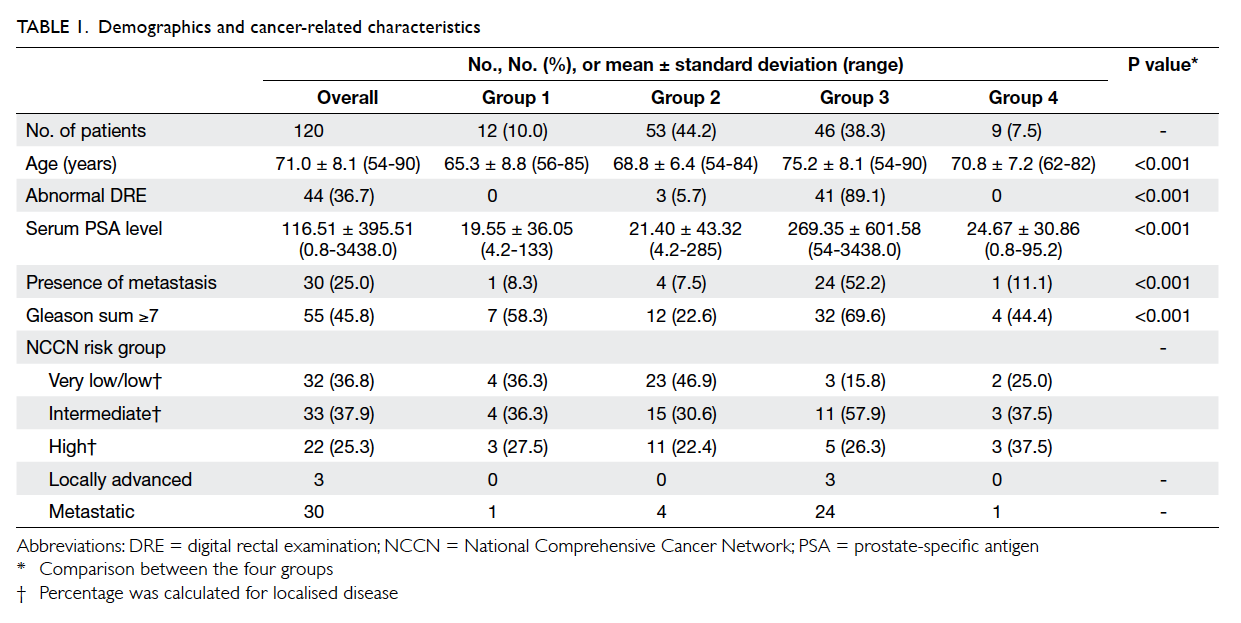
A convenient sample of 2650 Chinese pregnant
women was recruited between 4 and 41 weeks of
gestation. FMR1 allelic expansion was screened in
each subject, and two pre-mutation carriers (0.08%,
one in 1325) and one asymptomatic individual
with full mutation (0.04%, one in 2650) who were
unrelated were identified. The overall prevalence
was therefore one in 883 (0.11%) or 11 per 10 000
(95% confidence interval, 3-36 per 10 000 using the
Wilson method with continuity correction). These
three women are described in detail below. There
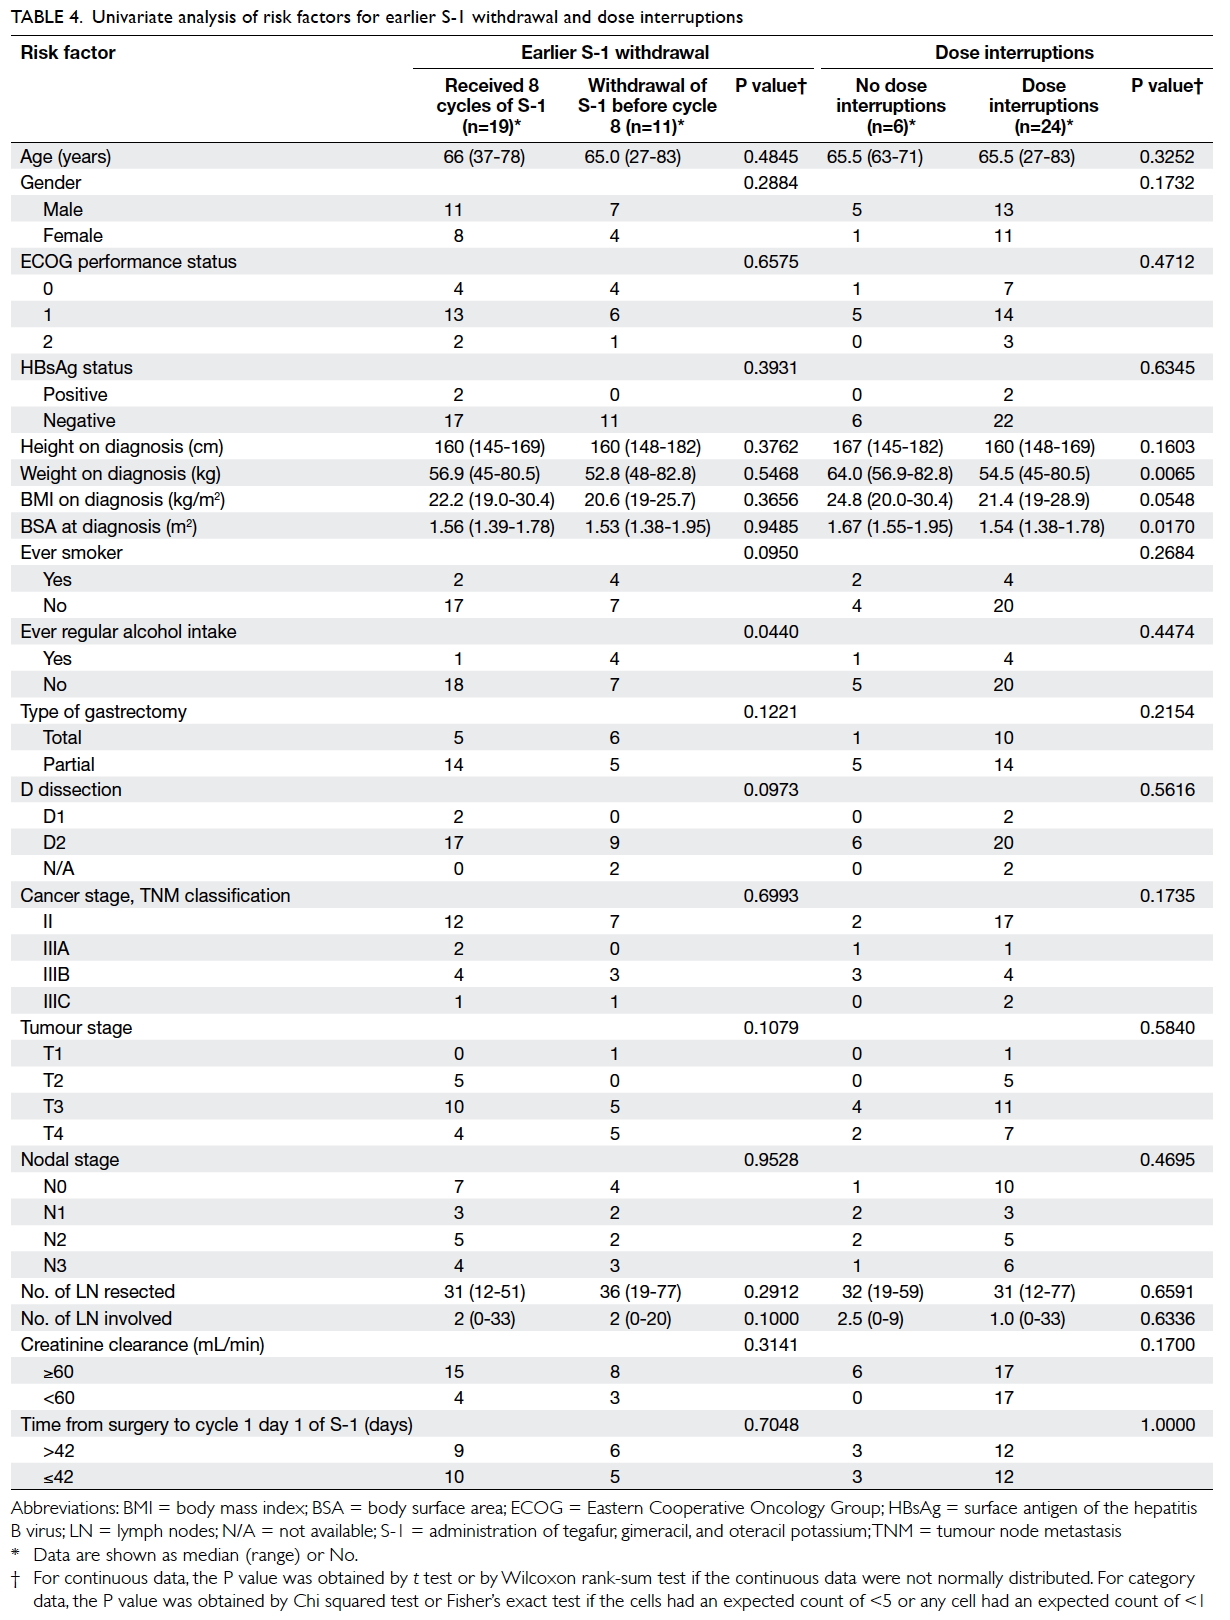
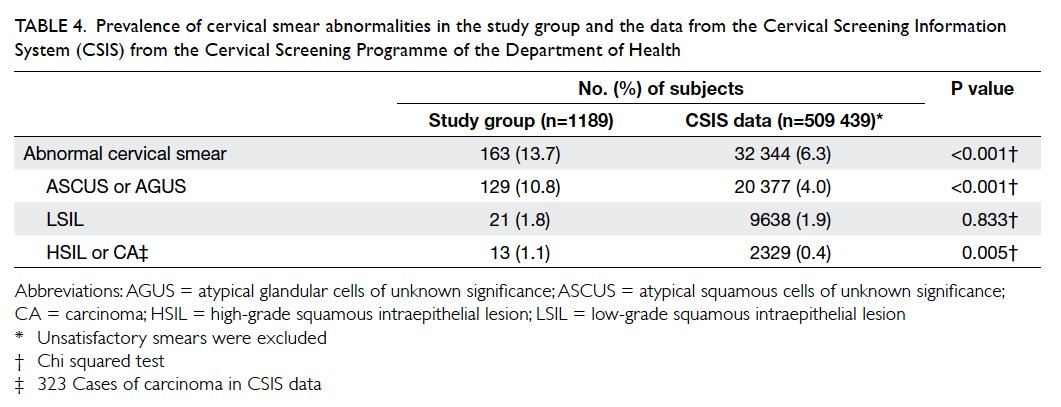
were also 30 (1.1%) women with CGG repeats who
fell into the intermediate category. The remaining
2617 women screened were found to have normal
CGG repeats, and the most common CGG repeat
allele was 30. This distribution of allele frequencies
for CGG repeats in the FMR1 gene in the population
with normal CGG repeat numbers is shown in the
Figure.
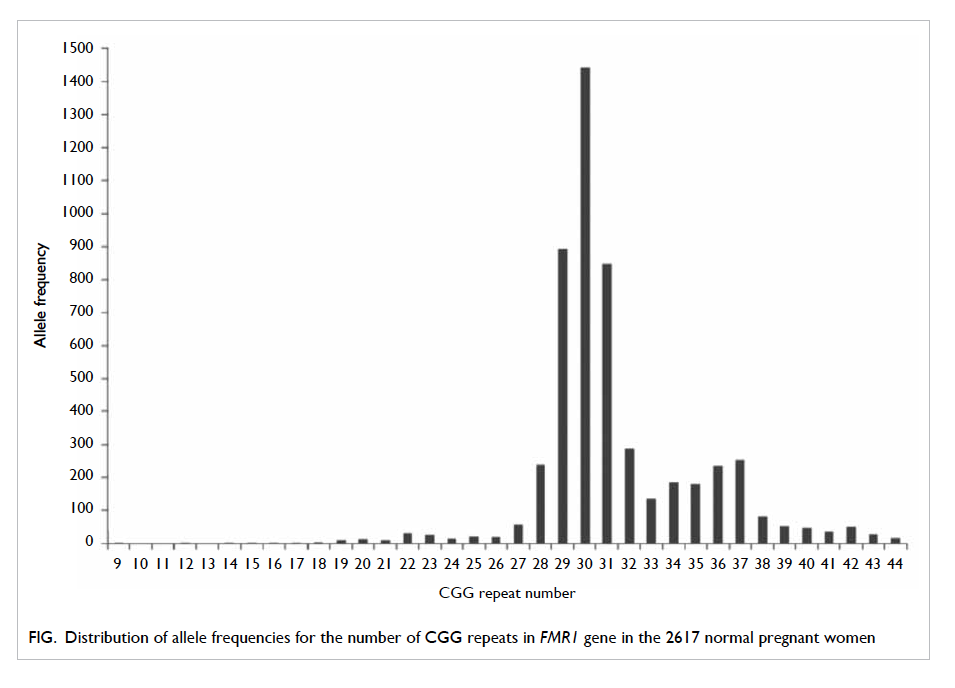
Figure. Distribution of allele frequencies for the number of CGG repeats in FMR1 gene in the 2617 normal pregnant women
One asymptomatic subject with full-mutation
allele
The woman had FMR1 gene testing carried out
during the third trimester and was found to have a
full mutation with CGG repeat number of 35/401.
She was phenotypically normal. She had completed
junior high school education and was working in a
fast food restaurant. Upon detailed questioning, she
suspected that her brother and one of her maternal
male cousins might have some autistic features, but
she was not aware of any mental retardation, or
any formal genetic diagnosis in either of these two
relatives. Genetic counselling was given. Prenatal
diagnosis was not performed since the woman
had been tested during the third trimester and
termination of pregnancy was not an option. She
subsequently delivered a healthy baby girl. The
parents were counselled about testing the baby for
FXS but they declined and preferred to observe
the development of their child first. The child was
referred for follow-up of her development. The
woman’s other family members also declined fragile
X screening because they were phenotypically
normal with no current reproductive plans.
Two subjects with pre-mutation allele
The first pre-mutation carrier was a 31-year-old
nulliparous female with no features associated with
FXS or family history of intellectual disability or
autism. Testing of the FMR1 gene was done at 13
weeks and 4 days, and the result was available at 14
weeks and 4 days indicating a CGG repeat number
of 30/70. The woman requested prenatal diagnosis
for her female fetus following genetic counselling.
Amniocentesis was performed at gestation 16 weeks
and 4 days. The PCR analysis result was available at
17 weeks and 2 days, and revealed that the maternal
pre-mutation allele had been transmitted to the fetus
and expanded to CGG repeat number of 30/579,
indicating the female fetus carried a full-mutation
allele. Genetic counselling was provided and the
couple opted for termination of pregnancy and
planned for pre-implantation genetic diagnosis in
future.
The second carrier was a 39-year-old female
with normal phenotype and no family history of
intellectual disability or autism. She had testing of
the FMR1 gene at 20 weeks and 6 days of gestation.
The result was available at 21 weeks and 2 days
of gestation showing a CGG repeat number of
31/64, and her fetus was female. Following genetic
counselling, the parents decided not to have any
prenatal or postnatal diagnosis owing to the variable
and unpredictable phenotype in full-mutation
females.
Discussion
This is the largest study of the prevalence of fragile X
pre-mutation carriers in Chinese pregnant women,
as well as the largest one using this new FXS-specific
PCR assay (FragilEase) in the Chinese population.
The combined prevalence of pre-mutations and full
mutations of FXS in normal asymptomatic pregnant
Hong Kong Chinese women was as high as 0.11% (1
in 883). We included also one case of full mutation in
our estimation of prevalence because some women
with full mutations are apparently asymptomatic
but are at risk of transmitting FXS to their offspring.
Therefore, the combined prevalence would reflect
more precisely the overall risk of transmitting FXS
in the general population. Our finding is consistent
with the recent publication by Huang et al,15
who identified one pre-mutation carrier in their
population of 1113 Han Chinese (534 males and 579
non-pregnant females). Our finding also refutes the
belief that FXS pre-mutations are extremely rare
in Chinese.11 12 13 In fact, the incidence in Chinese is
comparable with some of the incidences reported
from Korea (1 in 1090).16
A standard capillary analyser is only capable
of detecting and sizing FMR1 PCR products with
less than 200 CGG repeats. Thus differentiating full
mutations with greater than 200 CGG repeats from
apparently homozygous normal female samples, and
confirming full mutations, has historically required
the Southern blot reflex test. The Southern blotting
assay, however, is expensive, labour intensive, and
requires a large amount of DNA making its use
in screening impractical.13 The advantage of this
FragilEase PCR assay is the ability to detect up to
1000 CGG repeats, so that even asymptomatic full-mutation
individuals can be identified during routine
screening, as shown in one of our cases. It has high
throughput and high sensitivity of 99%.14 The cost
for each fragile X assay is estimated to be only
US$44, deduced from a parallel run of a minimum
of four samples plus two reference standards on
each Bioanalyzer chip, and this cost includes that
of FragilEase reagent kit, DNA extraction kit, PCR-related
consumables, Bioanalyzer kit, equipment
maintenance, and staff costs. Processing of each chip
takes 1 hour and a maximum of nine samples per
chip can run. The low cost of this test is beneficial as
a screening test.
Our study showing an incidence of one pre-mutation
or full mutation of FXS in 883 pregnant
Chinese women has important implications for
counselling and implementation of a FXS carrier
screening programme in Hong Kong and in China,
as well as in countries where Chinese immigrants
are numerous. It remains controversial whether
FXS should be screened for, and which model
should be adopted. Some experts advocate universal
prenatal screening17 as it is much more effective in
identification of pre-mutation carriers compared
with case finding followed by cascade screening. The
latest UK Health Technology Assessment (HTA)
review18 indicated that the maximal rate of detection
of female pre-mutation carriers by population
screening is 60% whereas only 6% of carriers will
be identified by active cascade screening. In their
simulation model, the additional number of births
of FXS children that could be avoided each year was
estimated to be 15 with cascade screening compared
with 39 with prenatal screening. Since family size
tends to be small in many developed countries now,
the effectiveness of cascade screening has become
very limited. In Hong Kong, the average number of
children per household is only 1.24.19 In mainland
China, until 2015, families were allowed to have only
one child. The chance of revealing a positive family
history with affected siblings or close relatives is
thus low. Furthermore, even though parents might
be planning their second child, the first affected
child would not have been diagnosed with FXS if
very young. Such diagnosis is particularly difficult
and is delayed in Hong Kong, China, or other Asia-Pacific regions where clinical genetic services are
inadequate.20 The variable phenotypes of FXS may
also be masked by the mixed education levels of
the population in different geographical regions.
Indeed, the patient in our study who carried a full
mutation is a very good example of the limitation of
cascade screening with an uncertain family history
or without a formal genetic assessment.
Unlike first-trimester combined Down
syndrome screening that requires intensive training
and effort in ultrasound measurement and a
stringent algorithm in risk calculation to achieve a
90% detection rate with a 5% false-positive rate,21 22 23 24
screening for fragile X carriers is relatively simple
by a maternal blood test and is thus acceptable to
most women. It can also be done before conception.
Furthermore, once a carrier is identified, other
carriers may be found through family screening.
Hence the potential utility of this screening can be
profound. In the validation study of FragilEase by
Kwok et al,14 78 samples tested positive, of which
one was classified as false positive. This sample
was tested to have a CGG repeat number of 55
(pre-mutation) by FragilEase whereas Southern
blot analysis determined the repeat number to be
53 (intermediate). This gives a false-positive rate
of 1.3%. The false-positive result occurred because
the CGG repeat number was at the lower limit of
the pre-mutation range, such that a difference of 2
repeats led to an intermediate allele being classified
in the pre-mutation range. We believe that this false-positive
rate is overestimated, as the majority of the
pre-mutation carriers do not have a repeat number
at this lower limit that could lead to such a false-positive
result. Although the positive predictive
value calculated was 8.0%, assuming a fragile X
pre-mutation carrier prevalence of one in 883, the
performance of the test should be better because the
positive predictive value was underestimated due to
the overestimated false-positive rate.
There are no current data on the health care
costs of caring for a FXS patient in Hong Kong
or Asia. In the UK, the lifetime cost for each FXS
patient is estimated to be UK$380 000 and the HTA
model expects population screening to be a cost-effective
strategy.18 In fact, it has been shown that
health care professionals and families of patients
with FXS are in favour of preconception or prenatal
screening.25 26 Detection of pre-mutation alleles also offers information about the women’s own health,
as they are at increased risk of FXPOI and FXTAS.27
The above factors may affect a woman’s fertility
planning and allow informed choices not only in this
pregnancy but also subsequent pregnancies.
Despite this, the UK National Screening
Committee and the American College of
Obstetricians and Gynecologists do not advocate
universal screening,28 29 but rather screening in
those with a family history of congenital intellectual
disability, autism, or premature ovarian failure.
There are concerns over the counselling about
complex genetic mechanisms and the psychological
impact of FXS when population screening is
offered. The difficulties in counselling include (1)
the variable phenotypes (eg female fetuses with full
mutation) associated with FXS, and (2) identification
of individuals with pre-mutation allele may lead to
anxiety in these individuals because both FXPOI and
FXTAS have no specific treatment. Another factor
that limits population screening for fragile X is the
access to prenatal care and screening, especially in
rural areas of mainland China.
The strength of this study lies in its size. It
is the largest study of the prevalence of fragile X
pre-mutation carriers performed in the Chinese
pregnant women. This study also demonstrated the
feasibility of this validated FXS-specific PCR-based
method (FragilEase) in the Chinese population.14
One limitation is that not all pregnant women were
approached for the study and the study participants
were recruited by convenient sampling. During the
study period, approximately 13 600 Chinese women
attended our hospital but only 2650 women were
recruited. Women were recruited each day at one
convenient time-point by the research assistant in the
antenatal ward or clinic. This was not a true random
sample and hence has doubtful representativeness.
Nonetheless, as the largest obstetric hospital in
Hong Kong with participants recruited from both
antenatal clinic and obstetric wards, and a large
sample size of 2650, we aimed to include a group most
typical of the general obstetric population. Another
limitation is that our cohort represented mainly the
Southern Chinese population and not the entire
Chinese population. Despite this, the findings of our
study should provide a strong foundation for further
large-scale national studies that may benefit our
understanding of the carrier frequencies in different
parts of China and the Asia-Pacific region. Further
studies are also required to look into the different
models of carrier screening programmes and their
cost-effectiveness in our locale to determine which
screening strategy is the most appropriate in the
Chinese pregnant population.
Conclusions
The prevalence of pre-mutation and full-mutation
alleles altogether in the asymptomatic Southern
Chinese population was one in 883, and that for
pre-mutation alleles alone was one in 1325. These
figures are higher than those reported previously
in small-scale studies, and indicate that FXS is a
clinical condition not to be overlooked in our locale.
Further studies of the prevalence in different areas
of Asia may be beneficial to direct future screening
strategies.
Acknowledgements
We would like to thank the research and laboratory
staff of the Fetal Medicine Team, Department of
Obstetrics and Gynaecology, The Chinese University
of Hong Kong. We would also like to thank all the
pregnant women and their families who participated
in the study.
Declaration
This work was supported partially by funding from
the Hong Kong Obstetrical and Gynaecological Trust
Fund. PerkinElmer has supported some of the PCR
study reagents, but has no role in the design of the
study; collection, analysis, or interpretation of the
data; writing, review, or approval of the manuscript;
or the decision to submit the manuscript for
publication.
References
1. Sherman S. Epidemiology. In: Hagerman RJ, Silverman
AC, editors. Fragile X syndrome: diagnosis, treatment, and
research. Baltimore: The Johns Hopkins University Press;
1991: 69-97.
2. Coffee B, Keith K, Albizua I, et al. Incidence of fragile X
syndrome by newborn screening for methylated FMR1
DNA. Am J Hum Genet 2009;8:503-14. Crossref
3. Verkerk AJ, Pieretti M, Sutcliffe JS, et al. Identification of
a gene (FMR-1) containing a CGG repeat coincident with
a breakpoint cluster region exhibiting length variation in
fragile X syndrome. Cell 1991;65:905-14. Crossref
4. Kronquist KE, Sherman SL, Spector EB. Clinical
significance of tri-nucleotide repeats in fragile X testing:
a clarification of American College of Medical Genetics
guidelines. Genet Med 2008;10:845-7. Crossref
5. Jacquemont S, Leehey MA, Hagerman RJ, Beckett LA,
Hagerman PJ. Size bias of fragile X premutation alleles in
late-onset movement disorders. J Med Genet 2006;43:804-9. Crossref
6. Uzielli ML, Guarducci S, Lapi E, et al. Premature ovarian
failure (POF) and fragile X premutation females: from
POF to fragile X carrier identification, from fragile X
carrier diagnosis to POF association data. Am J Med Genet
1999;84:300-3. Crossref
7. Nolin SL, Glicksman A, Ding X, et al. Fragile X analysis
of 1112 prenatal samples from 1991 to 2010. Prenat Diagn
2011;31:925-31. Crossref
8. Nolin SL, Brown WT, Glicksman A, et al. Expansion of
the fragile X CGG repeat in females with premutation or
intermediate alleles. Am J Hum Genet 2003;72:454-64. Crossref
9. Fernandez-Carvajal I, Lopez Posadas B, Pan R, Raske C,
Hagerman PJ, Tassone F. Expansion of an FMR1 grey-zone
allele to a full mutation in two generations. J Mol Diagn
2009;11:306-10. Crossref
10. Hill MK, Archibald AD, Cohen J, Metcalfe SA. A systematic
review of population screening for fragile X syndrome.
Genet Med 2010;12:396-410. Crossref
11. Chiang SC, Lee YM, Wang TR, Hwu WL. Allele distribution
at the FMR1 locus in the general Chinese population. Clin
Genet 1999;55:352-5. Crossref
12. Huang KF, Chen WY, Tsai YC, et al. Original article pilot
screening for fragile X carrier in pregnant women of
southern Taiwan. J Chin Med Assoc 2003;66:204-9.
13. Tzeng CC, Tsai LP, Hwu WL, et al. Prevalence of the FMR1
mutation in Taiwan assessed by large-scale screening
of newborn boys and analysis of DXS548-FRAXAC1
haplotype. Am J Med Genet A 2005;133A:37-43. Crossref
14. Kwok YK, Wong KM, Lo FM, et al. Validation of a robust
PCR-based assay for quantifying fragile X CGG repeats.
Clin Chim Acta 2016;456:137-43. Crossref
15. Huang W, Xia Q, Luo S, et al. Distribution of fragile X
mental retardation 1 CGG repeat and flanking haplotypes
in a large Chinese population. Mol Genet Genomic Med
2015;3:172-81. Crossref
16. Han SH, Heo YA, Yang YH, Kim YJ, Cho HI, Lee KR.
Prenatal population screening for fragile X carrier and the
prevalence of premutation carriers in Korea. J Genet Med
2012;9:73-7. Crossref
17. Musci TJ, Moyer K. Prenatal carrier testing for fragile X:
counseling issues and challenges. Obstet Gynecol Clin
North Am 2010;37:61-70. Crossref
18. Song FJ, Barton P, Sleightholme V, Yao GL, Fry-Smith A.
Screening for fragile X syndrome: a literature review and
modelling study. Health Technol Assess 2003;7:1-106. Crossref
19. The Hong Kong Family Planning Association. The report
on the Survey of Family Planning Knowledge, Attitude and Practice in Hong Kong 2012. Available from: http://www.famplan.org.hk. Accessed 21 Apr 2016.
20. Chopra M, Duan T. Rare genetic disease in China: a call to
improve clinical services. Orphanet J Rare Dis 2015;10:140. Crossref
21. Leung TY, Chan LW, Law LW, et al. First trimester
combined screening for trisomy 21 in Hong Kong:
outcome of the first 10,000 cases. J Matern Fetal Neonat
Med 2009;22:300-4. Crossref
22. Sahota DS, Leung TY, Fung TY, Chan LW, Law LW, Lau
TK. Medians and correction of biochemical and ultrasound
markers in Chinese undergoing first-trimester screening
for trisomy 21. Ultrasound Obstet Gynecol 2009;33:387-93. Crossref
23. Leung TY, Chan LW, Leung TN, et al. First-trimester
combined screening for trisomy 21 in a predominantly
Chinese population. Ultrasound Obstet Gynecol
2007;29:14-7. Crossref
24. Sahota DS, Leung WC, To WK, Chan WP, Lau TK, Leung
TY. Quality assurance of nuchal translucency for prenatal
fetal Down syndrome screening. J Matern Fetal Neonatal
Med 2012;25:1039-43. Crossref
25. Skinner D, Sparkman KL, Bailey DB Jr. Screening for fragile
X syndrome: parent attitudes and perspectives. Genet Med
2003;5:378-84. Crossref
26. Acharya K, Ross LF. Fragile X screening: attitudes of genetic
health professionals. Am J Med Genet A 2009;149:626-32. Crossref
27. Jacquemont S, Hagerman RJ, Hagerman PJ, Leehey MA.
Fragile-X syndrome and fragile X–associated tremor/ataxia
syndrome: two faces of FMR1. Lancet Neurol 2007;6:45-55. Crossref
28. Antenatal screening
for fragile X syndrome: external review against programme
appraisal criteria for the UK National Screening Committee
(UK NSC). UK National Screening Committee; Oct 2014.
29. ACOG Committee Opinion No. 469: Carrier screening for fragile X syndrome. The American College of Obstetricians and Gynecologists Committee; Oct 2010.