Public knowledge of how to use an automatic external defibrillator in out-of-hospital cardiac arrest in Hong Kong
Hong Kong Med J 2016 Dec;22(6):582–8 | Epub 31 Oct 2016
DOI: 10.12809/hkmj164896
© Hong Kong Academy of Medicine. CC BY-NC-ND 4.0
ORIGINAL ARTICLE
Public knowledge of how to use an automatic external defibrillator in out-of-hospital cardiac
arrest in Hong Kong
KL Fan, MB, BS, FRCSEd1;
LP Leung, MB, BS, FRCSEd1;
HT Poon2;
HY Chiu2;
HL Liu2;
WY Tang2
1 Emergency Medicine Unit, Li Ka Shing Faculty of Medicine, The University of Hong Kong, Pokfulam, Hong Kong
2 Li Ka Shing Faculty of Medicine, The University of Hong Kong, Pokfulam, Hong Kong
Corresponding author: Dr LP Leung (leunglp@hku.hk)
 Full
paper in PDF
Full
paper in PDF
Abstract
Introduction: The survival rate of out-of-hospital
cardiac arrest in Hong Kong is low. A long delay
between collapse and defibrillation is a contributing
factor. Public access to defibrillation may shorten this
delay. It is unknown, however, whether Hong Kong’s
public is willing or able to use an automatic external
defibrillator. This study aimed to evaluate public
knowledge of how to use an automatic external
defibrillator in out-of-hospital cardiac arrest.
Methods: A face-to-face semi-structured
questionnaire survey of the public was conducted in
six locations with a high pedestrian flow in Hong Kong.
Results: In this study, 401 members of the public
were interviewed. Most had no training in first
aid (65.8%) or in use of an automatic external
defibrillator (85.3%). Nearly all (96.5%) would call
for help for a victim of out-of-hospital cardiac arrest
but only 18.0% would use an automatic external
defibrillator. Public knowledge of automatic external
defibrillator use was low: 77.6% did not know the
location of an automatic external defibrillator in
the vicinity of their home or workplace. People who
had ever been trained in both first aid and use of an
automatic external defibrillator were more likely to
respond to and help a victim of cardiac arrest, and to
use an automatic external defibrillator.
Conclusion: Public knowledge of automatic external
defibrillator use is low in Hong Kong. A combination
of training in first aid and in the use of an automatic
external defibrillator is better than either one alone.
New knowledge added by this study
- The prevalence of life-saving skills among Hong Kong citizens is low.
- Public knowledge of how to use an automatic external defibrillator is suboptimal.
- A programme that increases public access to an increased number of available automatic external defibrillators is unlikely to be successful without also improving public knowledge.
- Combining first aid training with automatic external defibrillator training is better than either one alone with regard to bystander basic life support and defibrillation skills.
Introduction
Out-of-hospital cardiac arrest (OHCA) is a major
cause of mortality globally.1 Despite major advances
in the field of resuscitation, the survival-to-hospital
discharge rate of OHCA in most regions is less than
10%.2 The crucial key lies in prehospital management.3
Research has shown that 53% of patients could be
in ventricular tachycardia or ventricular fibrillation
within 4 minutes of collapse in OHCA.4 Early
defibrillation in the prehospital phase is required
to terminate these rhythms and thus increase the
chance of survival. Based on the same rationale,
the strategy of public access defibrillation (PAD)
was introduced almost 20 years ago.5 There is now
increasing evidence that application of automatic
external defibrillator (AED) in communities by lay
bystanders improves survival following OHCA.6
Hong Kong has a population of about 7.3
million.7 As an international financial centre of
the world and a metropolis of China, Hong Kong
attracted nearly 61 million visitors from around the
world in 2014.8 The annual incidence of OHCA is
estimated to be 5000 to 6000. The survival rate for
non-traumatic OHCA to hospital discharge was
between 1.25% and 3.00%.9 10 11 This survival rate is
among the lowest compared with other Asian cities.12
Local studies have identified long time interval
between collapse and first defibrillation as one of the
factors contributing to the low survival rate.10 13 In
1995, in order to shorten the collapse to defibrillation
by first responder interval, AEDs were deployed in
ambulances in Hong Kong. In 2006, the Government
launched a PAD scheme whereby AED training was
provided to emergency responders, eg police officers
and other uniformed officers. Thereafter, AEDs
have been installed in various places in Hong Kong,
including public areas with a high public footfall. In
Hong Kong, neither cardiopulmonary resuscitation
nor use of an AED is a compulsory component of the
school curriculum. The first aid courses organised
by voluntary agencies may also not teach the use of
an AED. The number of laypersons trained in use of
an AED is unknown. It is also unknown whether a
layperson is willing or able to use the AED. Studies of
public knowledge about and attitudes to AED have
been conducted in the United States, Europe, and
Japan.14 15 16 There have been no similar investigations
in Hong Kong or other Chinese cities. This study
aimed to evaluate public knowledge about use of
an AED in OHCA in Hong Kong. Such data could
inform the health authorities when they are planning
local PAD programmes.
Methods
This study was a face-to-face semi-structured
questionnaire survey conducted on weekdays
between 2 November 2015 and 15 December
2015 (excluding Saturdays and public holidays).
The survey instrument was one adapted from an
investigation carried out in the United Kingdom.17
Two investigators performed the forward and
backward translation for the Chinese version to be
used in the survey. It consisted of three sections.
Section one collected demographic data. Questions
in sections 2 and 3 assessed the response to an
OHCA victim and knowledge of the use of an AED,
respectively.
The survey was conducted daily from 18:00 to
22:00 during the study period in six locations across
different districts of Hong Kong. Three locations
were in the vicinity of a mass transit railway (MTR)
station and the other three were close to a major
shopping centre. These spots were chosen to ensure
a high volume of pedestrians available for the
survey. All pedestrians at the location formed the
target population. One investigator from a team
of three medical students and one nursing student
approached the closest pedestrian, if possible one
chosen at random. All investigators were trained
how to administer the questionnaire in a standard
manner. After introduction of the research, informed
consent was obtained prior to completion of the
questionnaire. A pedestrian would be recruited for
the survey if he or she was aged 16 years or older
and a permanent resident of Hong Kong. The only
exclusion criterion was an inability to communicate
in Chinese or English. Each recruited subject was
asked for a response to each question, with no
prompting, to determine their response to a victim
in cardiac arrest and their knowledge of using an
AED. The whole survey took about 20 minutes.
No remuneration was received by the respondents.
The study was approved by the Institutional Review
Board of the University of Hong Kong/Hospital
Authority Hong Kong West Cluster (Reference
number: UW16-141).
The subject characteristics and their responses
are described by descriptive statistics. Comparison
was made between respondents who were and were
not trained in first aid, and between those who were
first aid–trained respondents with and without AED
training. Significance testing was done by Chi squared
test and Mann-Whitney U test where appropriate.
A P value of <0.05 was considered significant.
Statistical analysis was performed by the Statistical
Package for the Social Sciences (Windows version
23.0; SPSS Inc, Chicago [IL], US). For sample size, to
attain a margin of error of 5% with a confidence level
of 95% regarding pedestrians’ response to an OHCA
victim (assumed to be 50% to maximise the sample
requirement), the minimum sample size was 385.
Results
During the study period, there were a total of
192 sessions (32 days x 6 spots); 733 pedestrians
were stopped and listened to the investigators’
introduction, and were invited for an interview at
one of the six locations. Overall, 42 did not fulfil the
inclusion criteria; 401 accepted the invitation and
completed the interview. On average, 3.8 pedestrians
per session were invited for an interview and 2.0
pedestrians per session completed the interview.
The response rate was 58% (401/691) with a slight
female predominance. Most were younger than 40
years and over half had attended university. The
majority of respondents had no training in first aid
(65.8%) or use of an AED (85.3%) [Table 1]. Of the 137 subjects trained in first aid, 49 were also trained
in use of an AED. Although most respondents
(96.5%) would summon help for a victim of OHCA,
only a minority of them were willing to do more,
eg perform cardiopulmonary resuscitation
(20.4%) or apply an AED (18.0%) [Table 2].
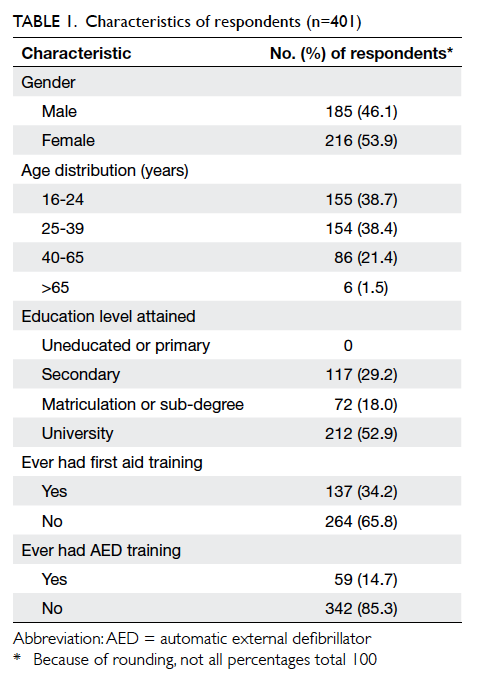
Table 1. Characteristics of respondents (n=401)
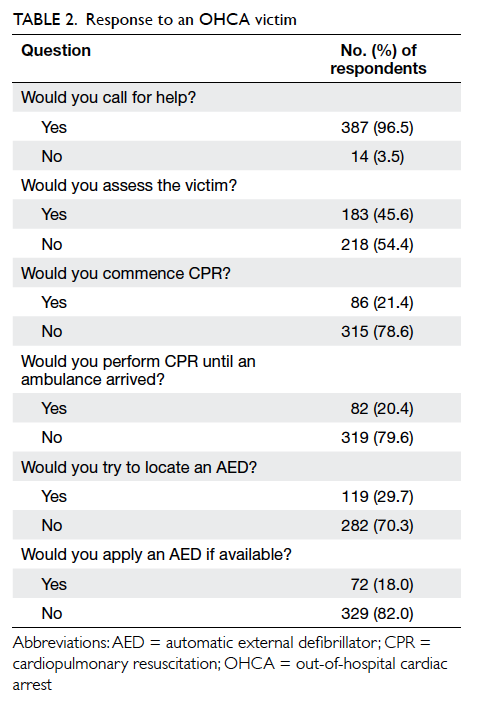
Table 2. Response to an OHCA victim
In general, knowledge about use of an AED
was suboptimal (Table 3). Comparison of first aiders with non–first aiders revealed that first aiders had
a more positive attitude in responding to a cardiac
arrest victim and were more knowledgeable about
the use of an AED (Table 4). When first aiders with and without AED training were compared, those
with training were also more likely to respond to a
cardiac arrest victim, be more knowledgeable about
AED, and were more likely to try to locate an AED
and apply it (Table 5).
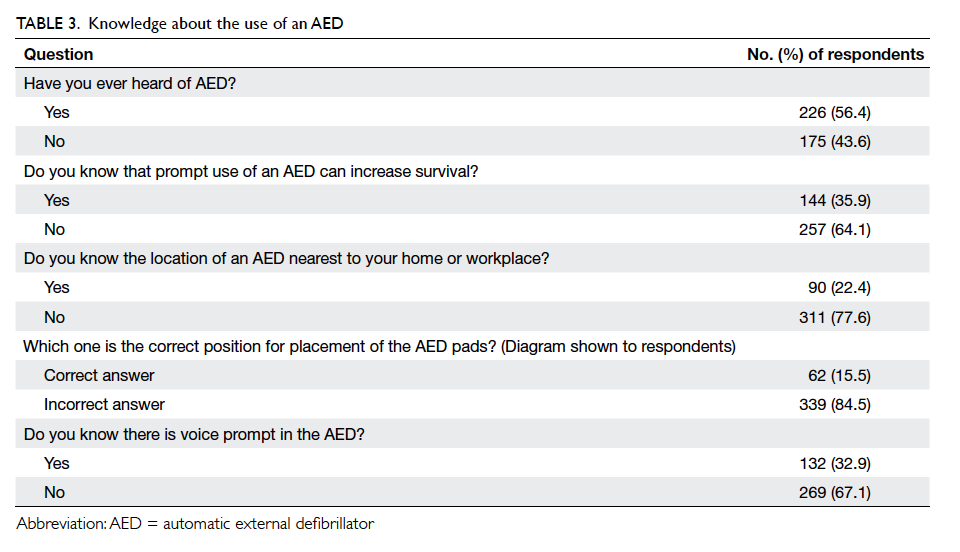
Table 3. Knowledge about the use of an AED
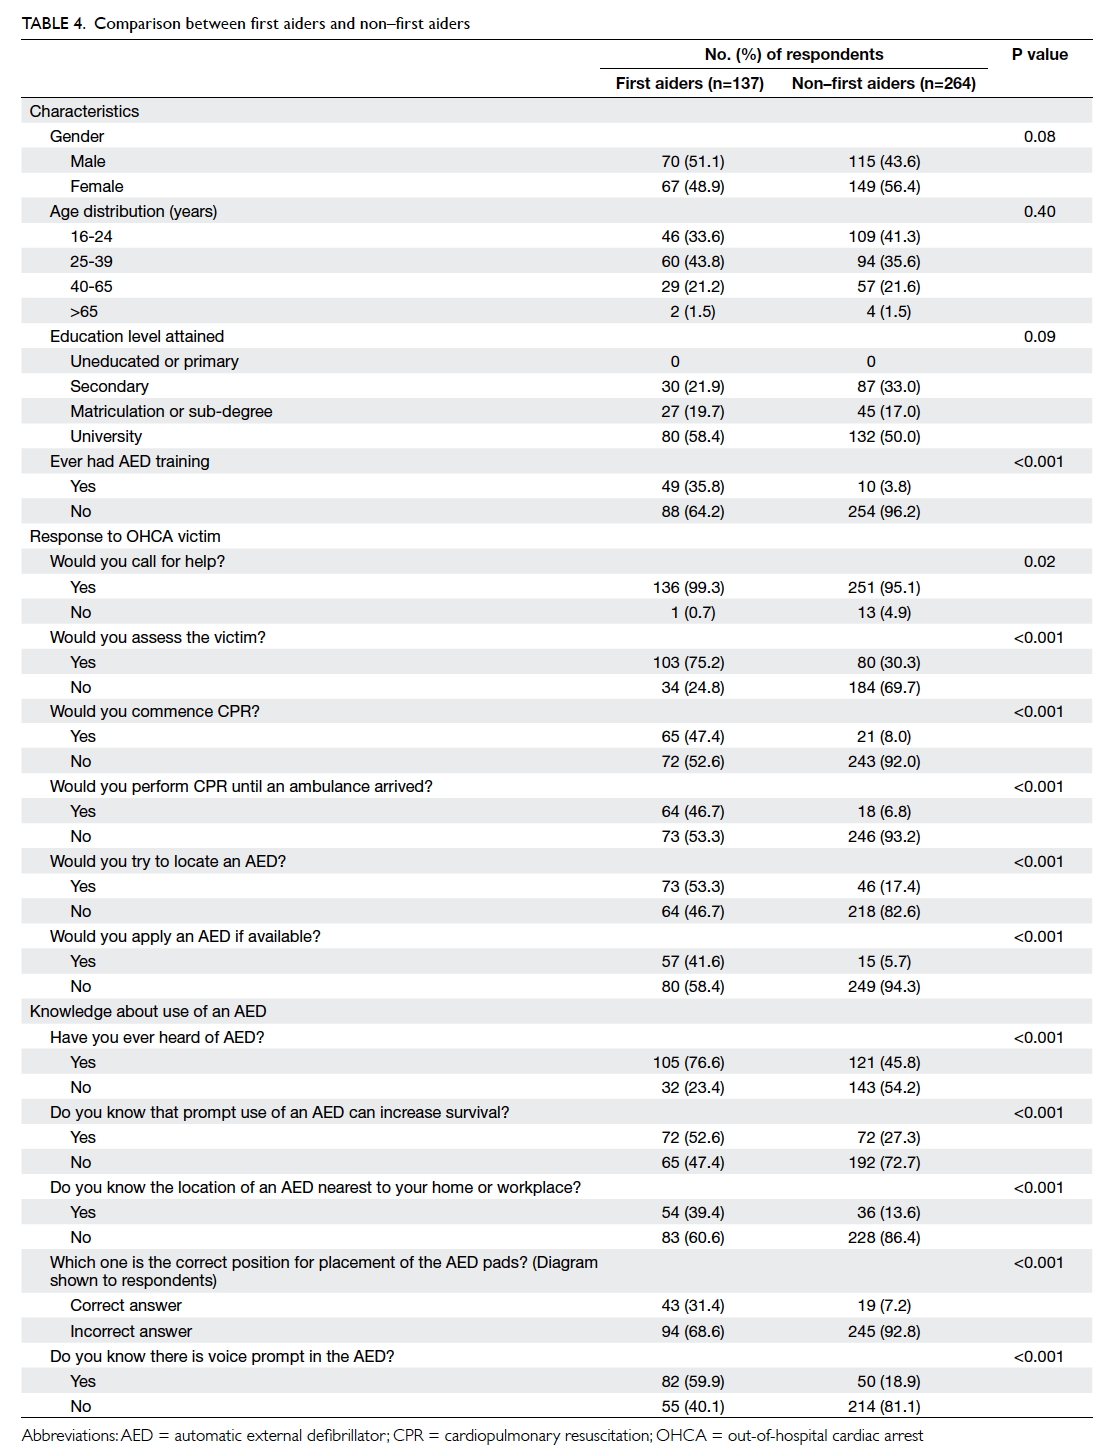
Table 4. Comparison between first aiders and non–first aiders
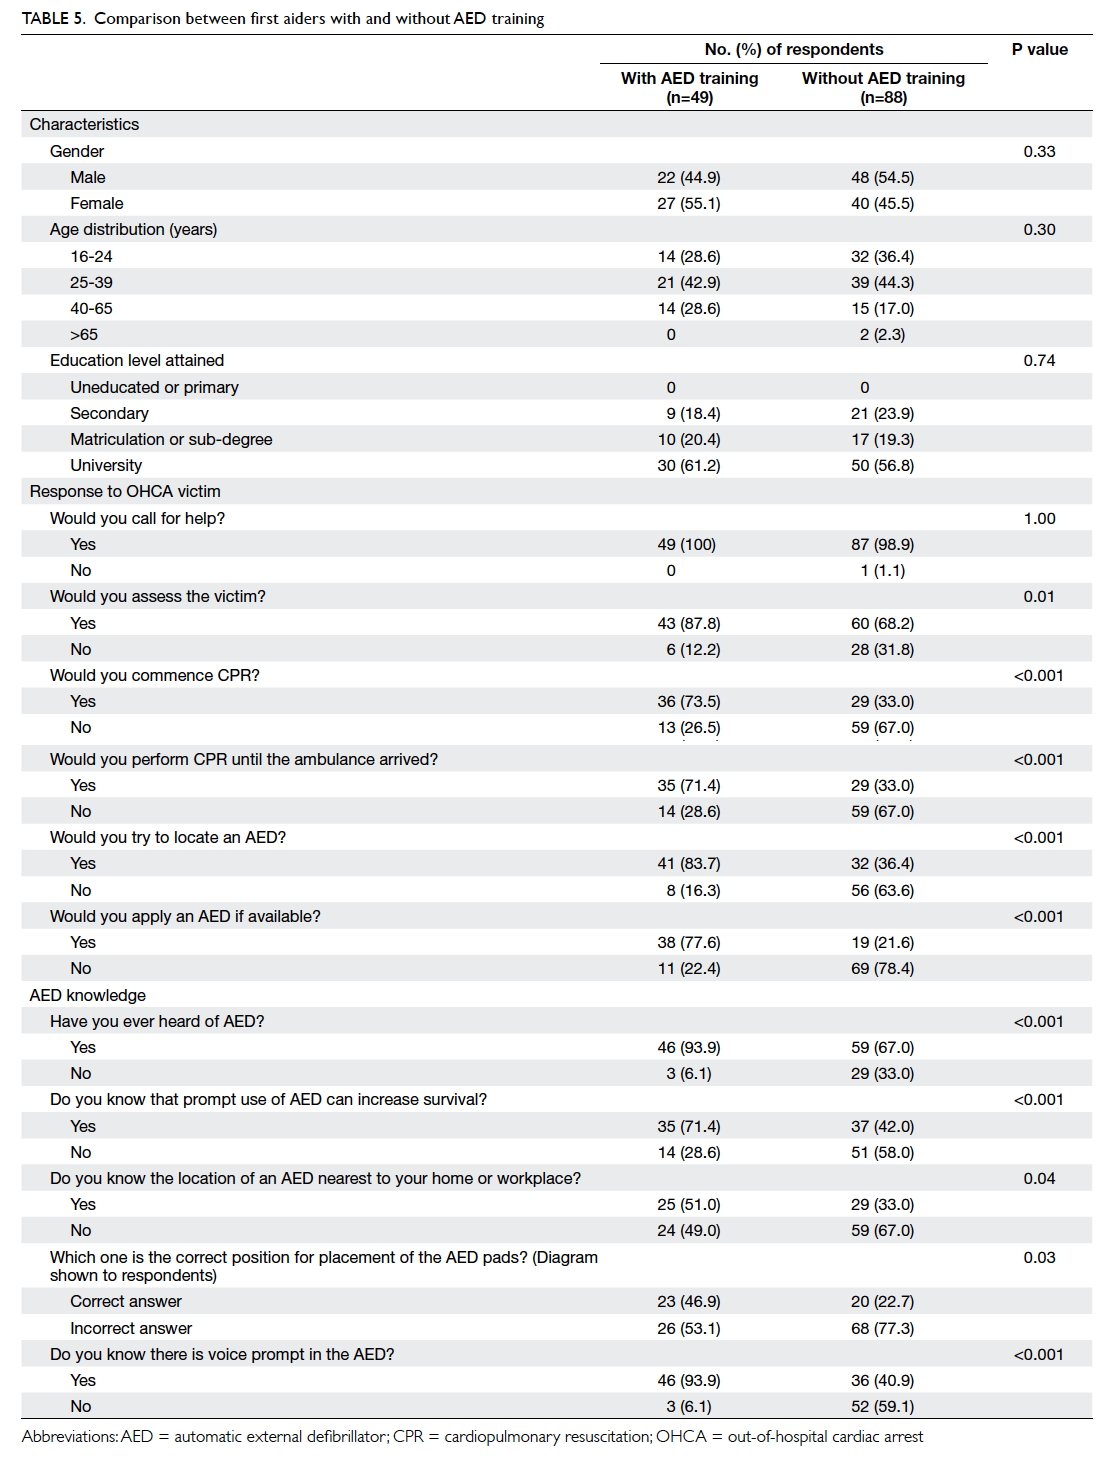
Table 5. Comparison between first aiders with and without AED training
Discussion
The response rate of this study was only 58% among
those who stopped and listened to the investigators’
introduction. The exact cause for the apparently small
number of pedestrians being invited was unclear.
One of the possibilities included extra time being
spent in answering the queries of pedestrians and
thus the time left for invitation was reduced. Further,
part of the sessions fell within rush hour. Many
pedestrians, especially those at the MTR stations,
were in a hurry and reluctant to be interviewed.
This study revealed that approximately 34% of
respondents were trained in first aid. This percentage
is low in comparison to Sweden (45%), New Zealand
(74%), and Washington (79%) but comparable to
Singapore (31%).18 19 20 21 An even lower percentage
(approximately 15%) were trained in the use of
AED. Although subject recruitment and sampling
methods differed in these studies, both findings
from this study raise concern about the prevalence
of life-saving skills among Hong Kong citizens. It
is reasonable to postulate that an OHCA victim in
Hong Kong is less likely to receive life-saving support
by a bystander as most have received no training in
first aid or use of an AED. This is reflected by the
incongruity between the willingness to summon help
and reluctance to perform life-support procedures
for an OHCA victim. After calling for help for the
victim, most respondents would not try to locate an
AED or use it if available. These findings suggest that
there is an urgent need to implement community-based
education and training about sudden cardiac
arrest and basic life support, including the use of an
AED. The governments of many developed countries
have invested heavily in recent years to promote PAD
in their communities, eg the National Defibrillator
Programme in the United Kingdom.22 The results
of their efforts are encouraging with a significant
number of lives saved.
In this study, the high rate of reluctance to use an
AED may be explained by the suboptimal knowledge
of the respondents. They performed particularly
poorly in their knowledge of an AED location in the
vicinity of their home or workplace and the actual
operation of an AED. A comprehensive plan for
promoting PAD, with raising the public awareness of
the distribution of AED and teaching its operation
as a priority, is indicated in Hong Kong. Further,
because of the pervasiveness of mobile devices for
information and communication, use of mobile
apps to locate an AED may be useful. For example,
mobile apps using GPS (Global Positioning System)
technology to inform the potential responder to an
OHCA victim of the whereabouts of an AED have to
be explored. A Japanese study on the use of a mobile
AED map has shown promising results.23
Combined first aid and AED training seems
to be better than training in first aid alone. For first
aiders who were also trained in AED, they were more
likely to provide life-support intervention, including
the use of an AED, to an OHCA victim. For any
agency that organises first aid courses for the public,
the inclusion of AED training should be considered.
Limitations
This study is limited by the response rate of
approximately 58% that may be an overestimate as
the number of pedestrians refusing the invitation
right away were not included in the calculation. The
investigators were unable to obtain the characteristics
of the non-respondents for comparison. The
respondents included for analysis in this study
were relatively young and over half of them had
a university education. This casts doubt on the
representativeness of the sample. Representativeness
was also undermined by the adoption of convenience
sampling that is associated with selection bias of
subjects for interviews. Caution is thus required
when interpreting the results. Nonetheless it is
reasonable to suggest that people of older age or
with a lower education level are less likely to be
more knowledgeable about AED than the young or
those with a higher education level. Therefore, the
findings from this study may underestimate the lack
of knowledge about AED by the general public in
Hong Kong. An additional caution in interpretation
is information bias. Responses were self-reported
and not validated. The respondents may have given
what they considered to be socially desirable answers
to the interviewers.
Conclusion
Public knowledge of AED in Hong Kong is low.
Simply increasing the number of AED devices
installed is unlikely to be enough to increase its use
in OHCA victims. A territory-wide PAD programme
that couples first aid training with AED training may
increase the use of AED in OHCA victims in Hong
Kong. Use of mobile information technology, eg an
AED locator app, should also be explored.
Declaration
All authors have disclosed no conflicts of interest.
References
1. Nichol G, Thomas E, Callaway CW, et al. Regional variation in out-of-hospital cardiac arrest incidence and outcome. JAMA 2008;300:1423-31. Crossref
2. Berdowski J, Berg RA, Tijssen JG, Koster RW. Global
incidences of out-of-hospital cardiac arrest and survival rates: Systematic review of 67 prospective studies. Resuscitation 2010;81:1479-87. Crossref
3. McNally B, Robb R, Mehta M, et al. Out-of-hospital cardiac
arrest surveillance—Cardiac Arrest Registry to Enhance Survival (CARES), United States, October 1, 2005—December 31, 2010. MMWR Surveill Summ 2011;60:1-19.
4. Herlitz J, Ekström L, Wennerblom B, Axelsson A, Bång A,
Holmberg S. Type of arrhythmia at EMS arrival on scene in out-of-hospital cardiac arrest in relation to interval from collapse and whether a bystander initiated CPR. Am J Emerg Med 1996;14:119-23. Crossref
5. Weisfeldt ML, Kerber RE, McGoldrick RP, et al.
Public access defibrillation. A statement for healthcare professionals from the American Heart Association Task
Force on Automatic External Defibrillation. Circulation 1995;92:2763. Crossref
6. Weisfeldt ML, Sitlani CM, Ornato JP, et al. Survival after
application of automatic external defibrillators before arrival of the emergency medical system: evaluation in
the resuscitation outcomes consortium population of 21 million. J Am Coll Cardiol 2010;55:1713-20. Crossref
7. Census and Statistics Department, Hong Kong SAR
Government. Population. 2014. Available from: http://www.censtatd.gov.hk/hkstat/sub/so20.jsp. Accessed 5 Jan 2016.
8. Tourism Commission, Commerce and Economic Development Bureau, Hong Kong SAR Government. Tourism performance in 2014. Available from: http://www.tourism.gov.hk/english/statistics/statistics_perform.html. Accessed 5 Jan 2016.
9. Wong TW, Yeung KC. Out-of-hospital cardiac arrest: two
and a half years experience of an accident and emergency
department in Hong Kong. J Accid Emerg Med 1995;12:34-9. Crossref
10. Lui JC. Evaluation of the use of automatic external
defibrillation in out-of-hospital cardiac arrest in Hong
Kong. Resuscitation 1999;41:113-9. Crossref
11. Leung LP, Wong TW, Tong HK, Lo CB, Kan PG. Out-of-hospital
cardiac arrest in Hong Kong. Prehosp Emerg Care
2001;5:308-11. Crossref
12. Ong ME, Shin SD, De Souza NN, et al. Outcomes for
out-of-hospital cardiac arrests across 7 countries in Asia:
The Pan Asian Resuscitation Outcomes Study (PAROS).
Resuscitation 2015;96:100-8. Crossref
13. Fan KL, Leung LP. Prognosis of patients with ventricular
fibrillation in out-of-hospital cardiac arrest in Hong Kong:
prospective study. Hong Kong Med J 2002;8:318-21.
14. Kozłowski D, Kłosiewicz T, Kowalczyk A, et al. The
knowledge of public access to defibrillation in selected
cities in Poland. Arch Med Sci 2013;9:27-33. Crossref
15. Taniguchi T, Sato K, Kurita A, Noda T, Okajima M.
Attitudes toward automated external defibrillator use in
Japan in 2011. J Anesth 2014;28:34-7. Crossref
16. Gonzalez M, Leary M, Blewer AL, et al. Public knowledge
of automatic external defibrillators in a large U.S. urban
community. Resuscitation 2015;92:101-6. Crossref
17. Brooks B, Chan S, Lander P, Adamson R, Hodgetts GA,
Deakin CD. Public knowledge and confidence in the use of
public access defibrillation. Heart 2015;101:967-71. Crossref
18. Axelsson AB, Herlitz J, Holmberg S, Thorén AB. A
nationwide survey of CPR training in Sweden: foreign born
and unemployed are not reached by training programmes.
Resuscitation 2006;70:90-7. Crossref
19. Larsen P, Pearson J, Galletly D. Knowledge and attitudes
towards cardiopulmonary resuscitation in the community.
N Z Med J 2004;117:U870.
20. Sipsma K, Stubbs BA, Plorde M. Training rates and
willingness to perform CPR in King County, Washington: a
community survey. Resuscitation 2011;82:564-7. Crossref
21. Ong ME, Quah JL, Ho AF, et al. National population based
survey on the prevalence of first aid, cardiopulmonary
resuscitation and automated external defibrillator skills in
Singapore. Resuscitation 2013;84:1633-6. Crossref
22. UK Department of Health. National Defibrillator
Programme. 2010. Available from: http://webarchive.nationalarchives.gov.uk/+/www.dh.gov.uk/en/Healthcare/Longtermconditions/Vascular/Coronaryheartdisease/Coronarypromotionproject/index.htm. Accessed 1 Feb 2016.
23. Sakai T, Iwami T, Kitamura T, et al. Effectiveness of the
new ‘Mobile AED Map’ to find and retrieve an AED: A
randomised controlled trial. Resuscitation 2011;82:69-73. Crossref