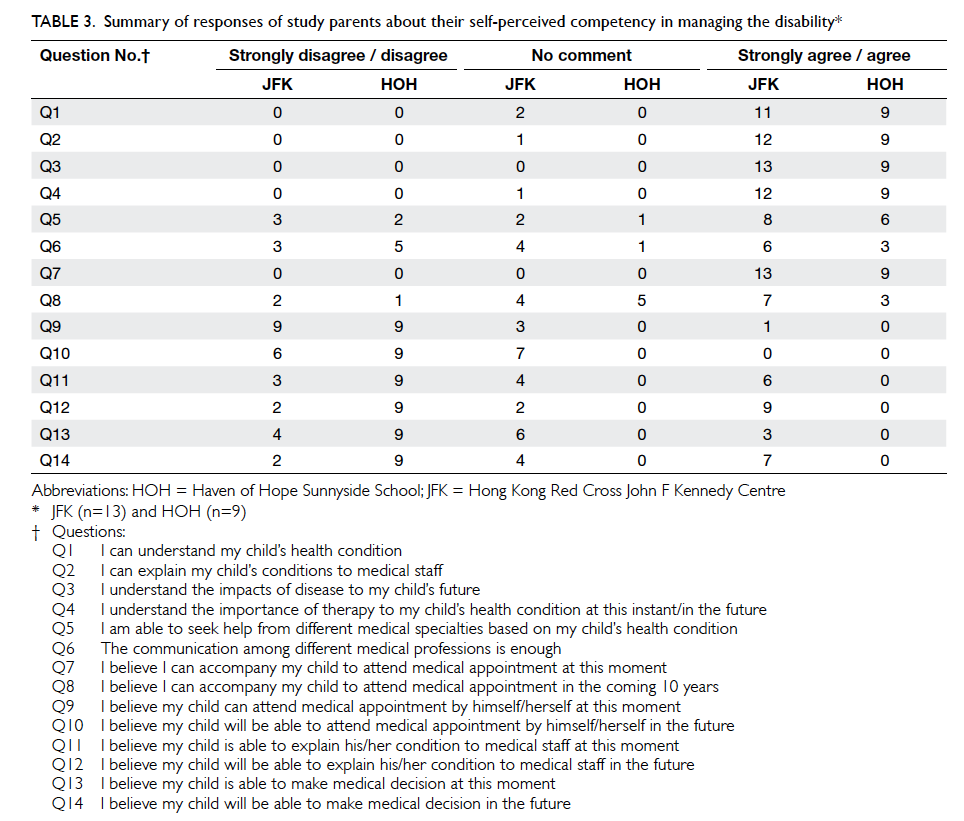
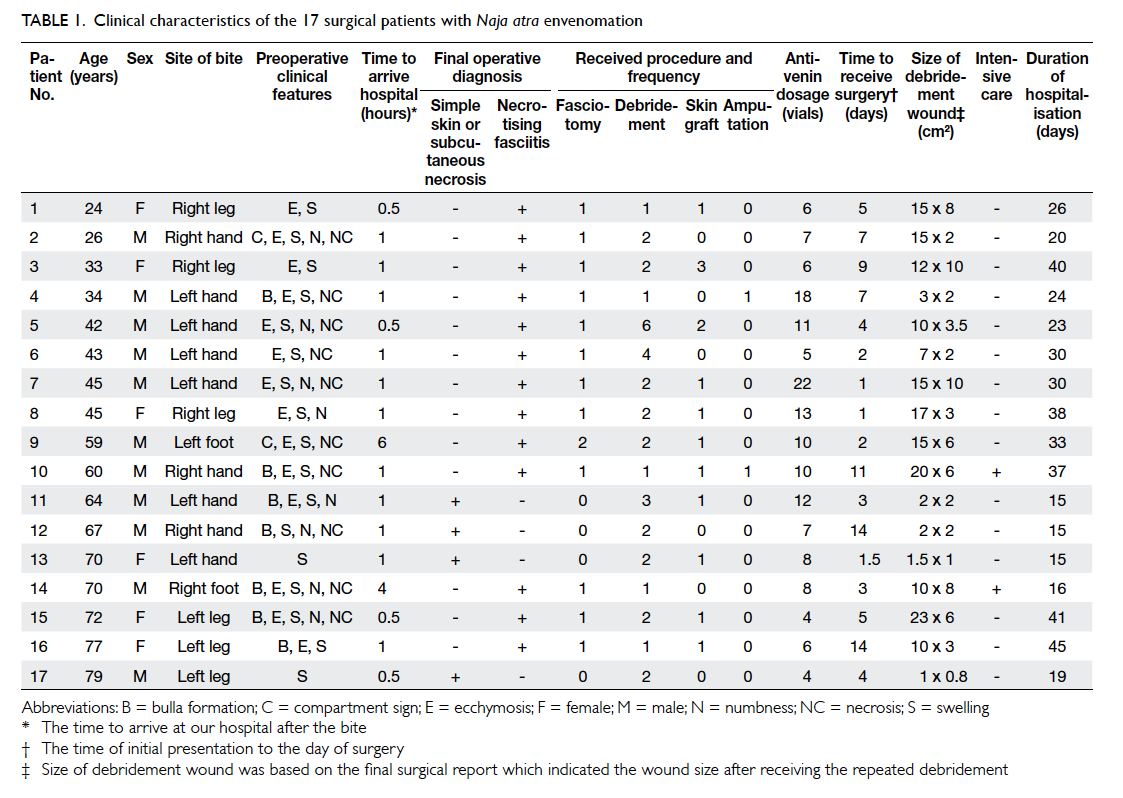
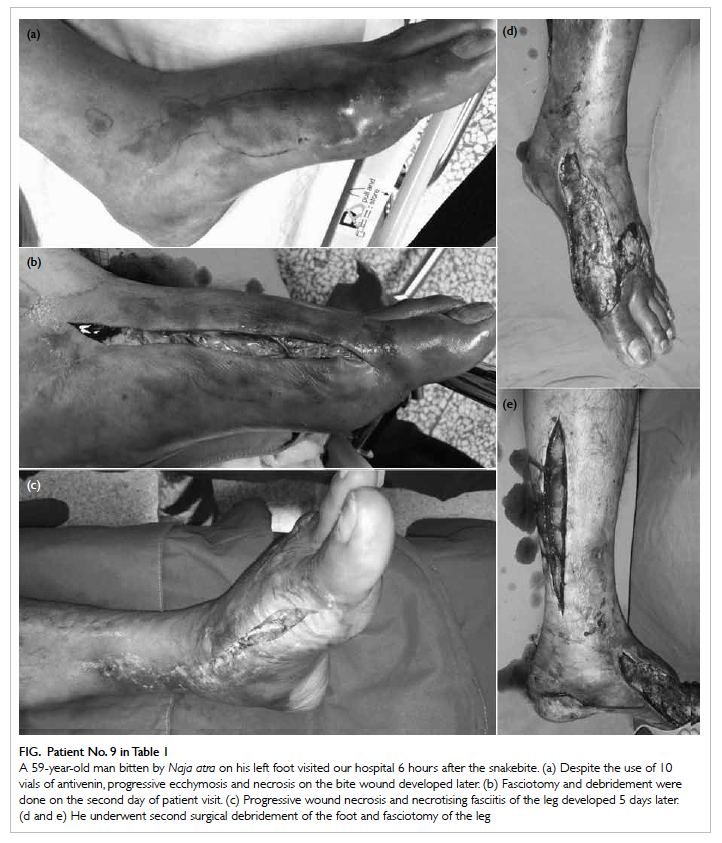
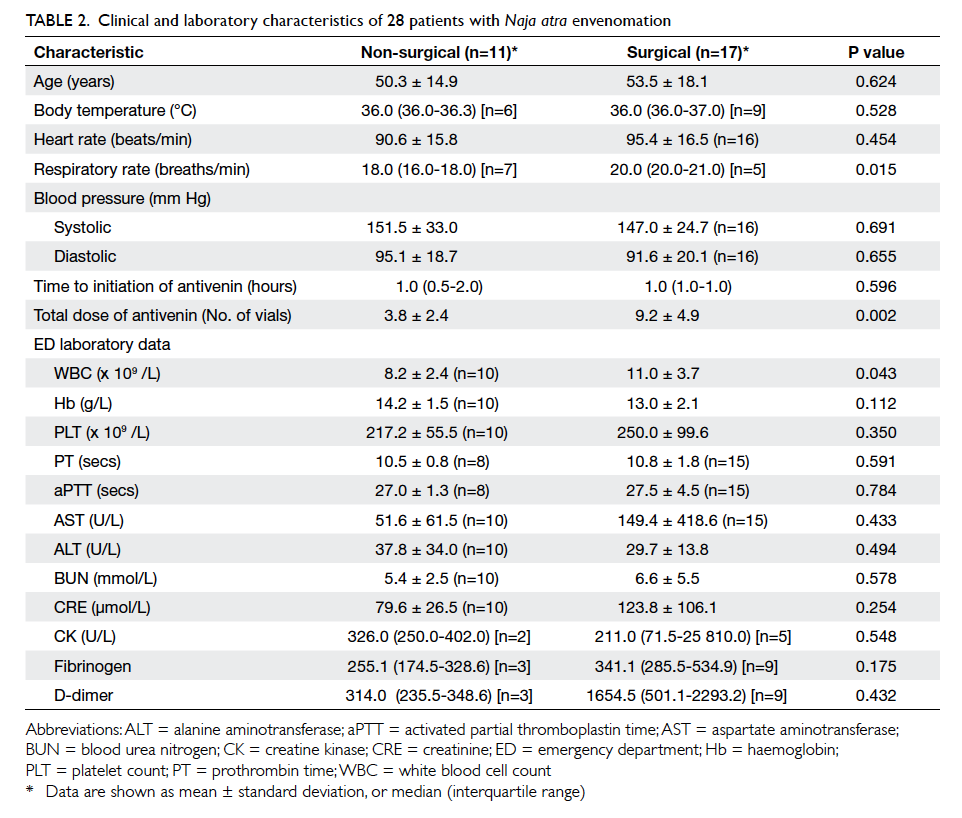
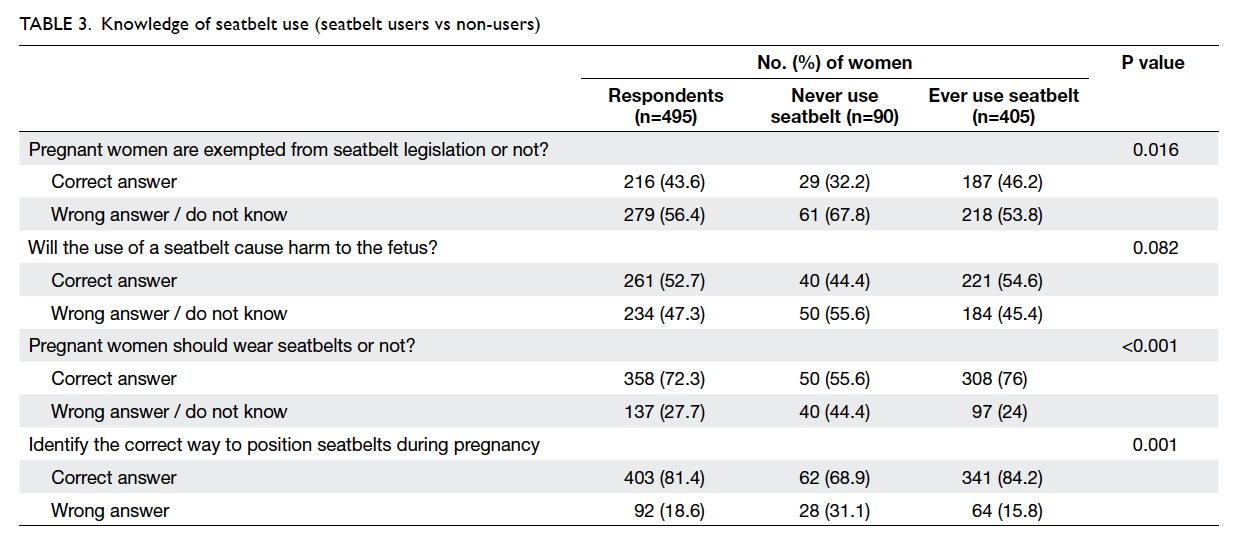
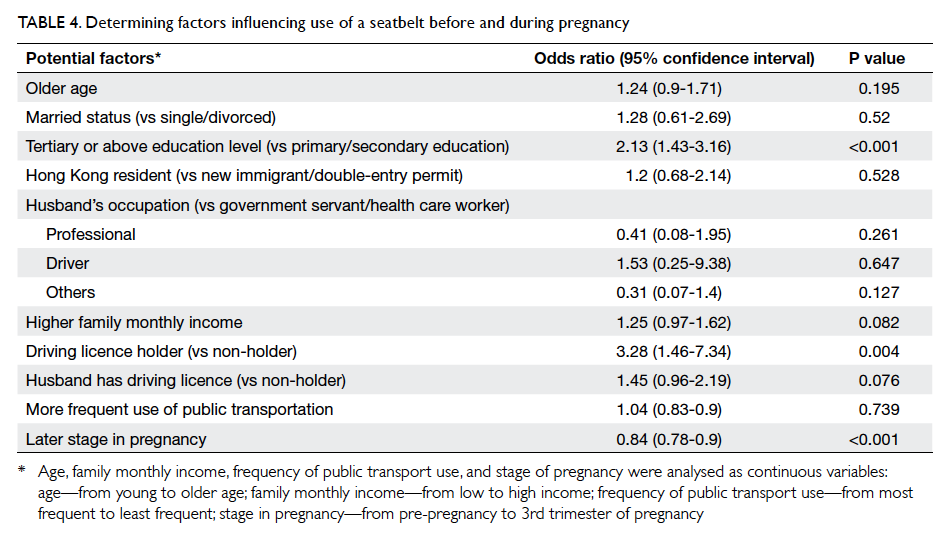
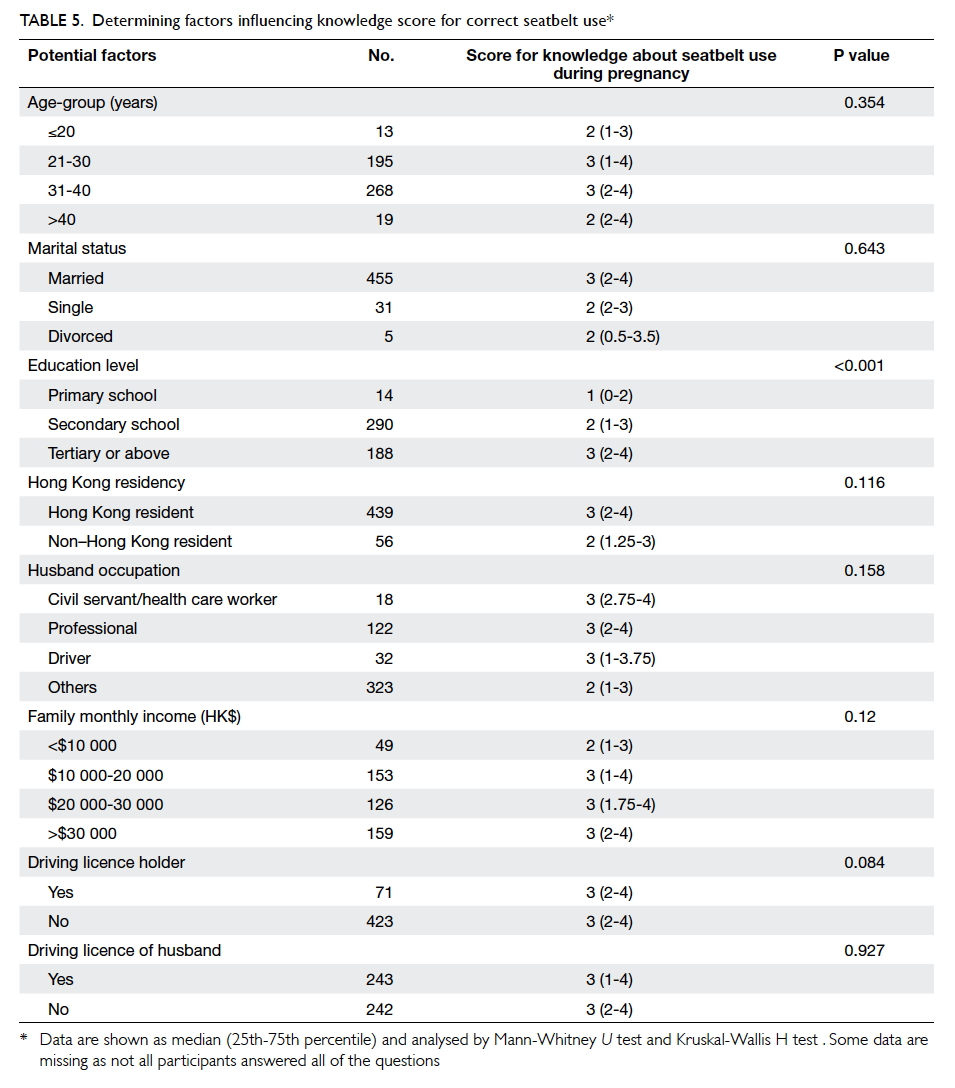
Violence against emergency department employees and the attitude of employees towards violence
Hong Kong Med J 2016 Oct;22(5):464–71 | Epub 26 Aug 2016
DOI: 10.12809/hkmj154714
© Hong Kong Academy of Medicine. CC BY-NC-ND 4.0
ORIGINAL ARTICLE
Violence against emergency department employees and the attitude of employees
towards violence
Halil Í Çıkrıklar, MD1;
Yusuf Yürümez, MD1;
Buket Güngör, MD2;
Rüstem Aşkın, MD2;
Murat Yücel, MD1;
Canan Baydemir, MD3
1 Department of Emergency Medicine, Sakarya University, Medical
Faculty, Sakarya, Turkey
2 Psychiatry Clinic, Ministry of Health, Şevket Yilmaz Training and Research Hospital, Bursa, Turkey
3 Department of Biostatistics, Eskişehir Osmangazi University, Medical Faculty, Eskişehir, Turkey
Corresponding author: Dr Halil Í Çıkrıklar (halilcikriklar@hotmail.com)
 Full
paper in PDF
Full
paper in PDF
Abstract
Introduction: This study was conducted to evaluate
the occurrence of violent incidents in the workplace
among the various professional groups working
in the emergency department. We characterised
the types of violence encountered by different
occupation groups and the attitude of individuals
working in different capacities.
Methods: This cross-sectional study included 323
people representing various professional groups
working in two distinct emergency departments in
Turkey. The participants were asked to complete
questionnaires prepared in advance by the
researchers. The data were analysed using the
Statistical Package for the Social Sciences (Windows
version 15.0).
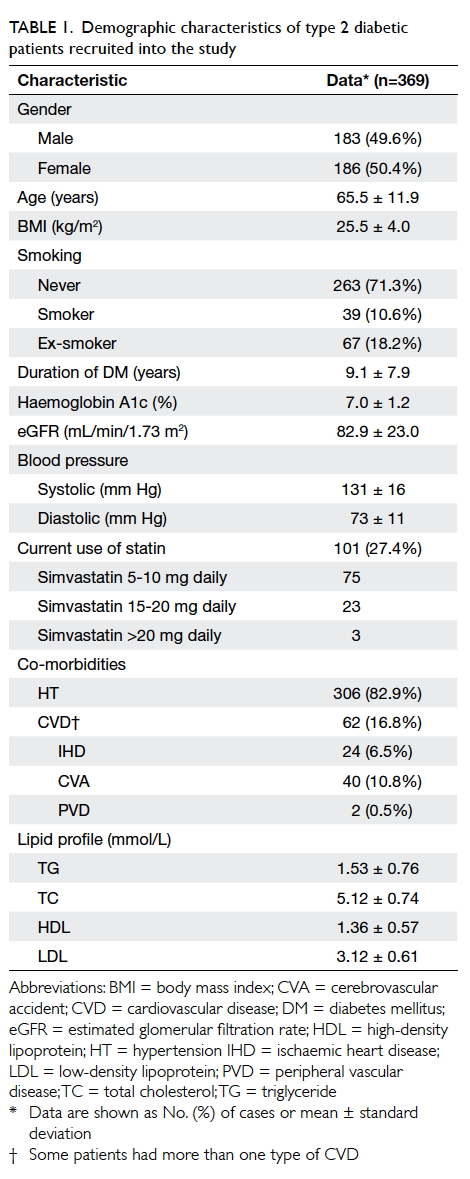
Results: A total of 323 subjects including 189 (58.5%) men and 134 (41.5%) women participated in the study. Their mean (± standard deviation) age was 31.5 ± 6.5 years and 32.0 ± 6.9 years, respectively. In all, 74.0% of participants had been subjected to verbal or physical violence at any point since starting employment in a medical profession. Moreover, 50.2% of participants stated
that they had been subjected to violence for more
than 5 times. Among those who reported being
subjected to violence, 42.7% had formally reported
the incident(s). Besides, 74.3% of participants did not enjoy their profession, did not want to
work in the emergency department, or would
prefer employment in a non–health care field after
being subjected to violence. According to
the study participants, the most common cause of
violence was the attitude of patients or their family
members (28.7%). In addition, 79.6% (n=257) of
participants stated that they did not have adequate
safety protection in their working area. According
to the study participants, there is a need for legal
regulations to effectively deter violence and increased
safety measures designed to reduce the incidence of
violence in the emergency department.
Conclusion: Violence against employees in the
emergency department is a widespread problem. This
situation has a strong negative effect on employee
satisfaction and work performance. In order to
reduce the incidence of violence in the emergency
department, both patients and their families should
be better informed so they have realistic expectations
as an emergency patient, deterrent legal regulations
should be put in place, and increased efforts should
be made to provide enhanced security for emergency
department personnel. These measures will reduce
workplace violence and the stress experienced by
emergency workers. We expect this to have a positive
impact on emergency health care service delivery.
New knowledge added by this study
- The prevalence of violence against employees in emergency departments is high.
- Various measures can be implemented to reduce the incidence of violence in the emergency department.
Introduction
Violence, which has been ever present throughout
the history of humanity, is defined as a threat or
application of possessed power or strength towards
another person, self, a group, or a community in
order to cause injury and/or loss.1 The World Health
Organization defines violence as “physical assault,
homicide, verbal assault, emotional, sexual or racial
harassment”.2
Workplace violence is defined as “abuse or
attacks by one or more people on an employee
within the workplace”.3 The health care field, which
encompasses a wide range of employees, is among
those in which workplace violence is common.4
Violence in the health care field is defined as “risk
to a health worker due to threatening behaviour,
verbal threats, physical assault and sexual assault
committed by patients, patient relatives, or any other
person”.3
According to the 2002 Workplace Violence
in the Health Sector report, 25% of all violent
incidents occurred in the health care sector.5 A study
conducted in the United States determined that the
risk of being subjected to violence is 16 times higher
in the health care sector relative to other service
sectors.6 Within the health care field, the department
that is most frequently exposed to violence is the
emergency department (ED).3 7 8 9 In this context,
verbal and physical attacks by dissatisfied patients
and their relatives are at the forefront.10 11
In this study we aimed to determine the extent
of violence towards ED employees, analyse the
attitude of the staff exposed to violence, and propose
possible solutions.
Methods
This cross-sectional study was conducted in the EDs
of Şevket Yilmaz Training and Research Hospital and
Sakarya University between 1 July and 15 August 2012. Employees of
ED—including doctors, nurses, health care officials,
Emergency Medical Technicians (EMT), secretaries,
laboratory technicians, radiology technicians, and
security and cleaning staff—were included in the
study. The questionnaire was prepared in accordance
with previous publications3 10 11 and distributed to
participants. All study participants were provided
with information regarding the objectives of the
study and were given instructions for completing the
form. Of the 437 ED employees working in the two
hospitals, 323 (73.9%) agreed to participate in the
study and returned a completed questionnaire.
In addition to demographic information,
the questionnaire contained questions about the
number of violent incidents to which the individual
had been subjected to, the type of violence, and
whether the subject reported the incident or the
reason for not reporting. Additional questions
concerned a description of the person(s) responsible
for the violence, the estimated age of the person(s)
responsible for the violence, and the severity of
the violence. We also asked participants about
their attitude following the violent incident and
suggestions for reducing violence in the ED.
This study was conducted in accordance with
the principles of the 2008 Helsinki Declaration. The
data were analysed using the Statistical Package for
the Social Sciences (Windows version 15.0; SPSS
Inc, Chicago [IL], US). Both proportions and mean ±
standard deviation were used to represent the results.
The Student’s t test, Pearson’s Chi squared test, and
the Monte Carlo Chi squared tests were used to
evaluate observed differences between groups and
a P value of <0.05 was considered to represent a
statistically significant difference.
Results
Among the 323 participants included in the study,
189 (58.5%) were male and 134 (41.5%) were female.
The mean age of the male participants was 31.5
± 6.5 years (range, 18-55 years) and that of the
female participants was 32.0 ± 6.9 years (range,
20-52 years). There was no significant difference in
the age distribution between the male and female
participants (P=0.476).
When participants were asked if they had ever
been exposed to verbal or physical violence in the
workplace during the course of their career, 239
(74.0%) indicated that they had been
subjected to one or the other, and 57 (17.6%) reported
being subjected to both verbal and physical violence.
Among the participants who were subjected to
violence, 162 (67.8%) reported being the
victim of more than five violent incidents (Table 1).
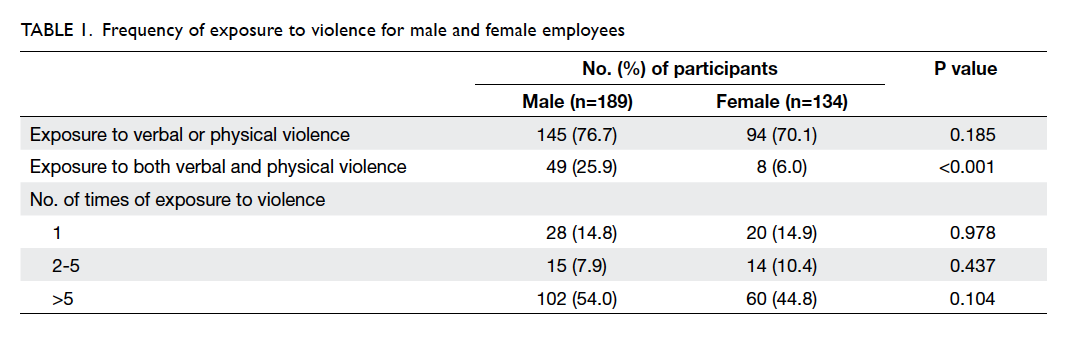
Table 1. Frequency of exposure to violence for male and female employees
The frequency of exposure to violence and
the frequency of exposure to more than five violent
incidents were similar for both men and women
(P=0.185 and 0.104, respectively). Nonetheless,
25.9% of men reported both verbal and physical
violence compared with only 6.0% of women,
suggesting that the incidence of verbal and physical
violence against men was greater than that against
women (P<0.001) [Table 1].
We investigated the frequency of exposure
to violence and the reported incidence of violence
among various occupation groups (Table 2). The prevalence of exposure to violence was the highest
among health care officials, EMTs, doctors, and
security staff (P<0.001). In addition, only 102 (42.7%)
out of 239 participants reported these violent
incidents. It is notable that although the rate of
incident reporting was 100% among security staff,
none of the laboratory technicians reported the
violent incidents (P<0.001).
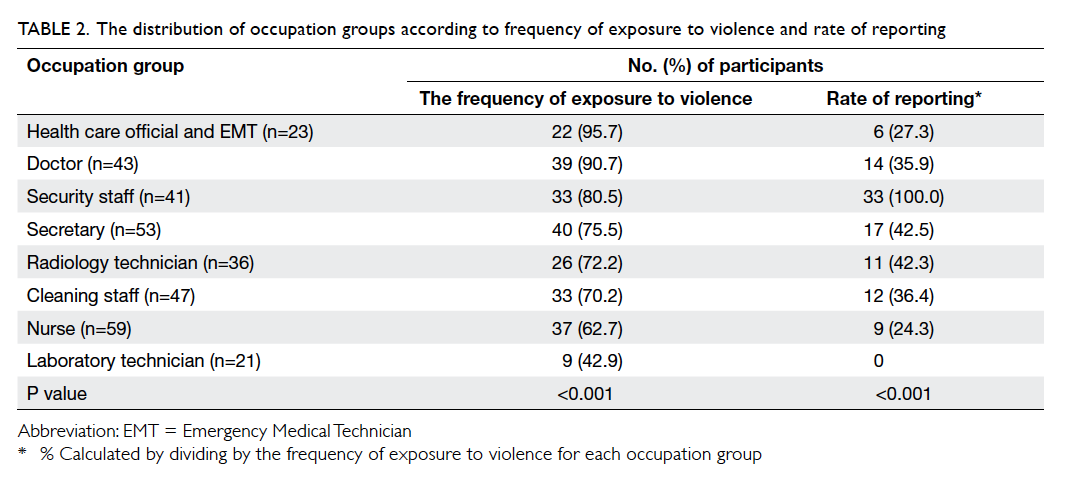
Table 2. The distribution of occupation groups according to frequency of exposure to violence and rate of reporting
A total of 43 (31.4%) out of the 137 study
participants who had been exposed to violence but
had not reported the incident provided reasons
(Table 3). The most common reason for not notifying the authorities was the perception that “no
resolution will be reached”. Other important reasons
included the heavy workload, not wanting to deal
with the legal process, disregarding verbal attacks,
understanding/sympathising with the emotions of
patients and their relatives, fear of the threat from
patients and their relatives, and not knowing how
and where to report such incidents.
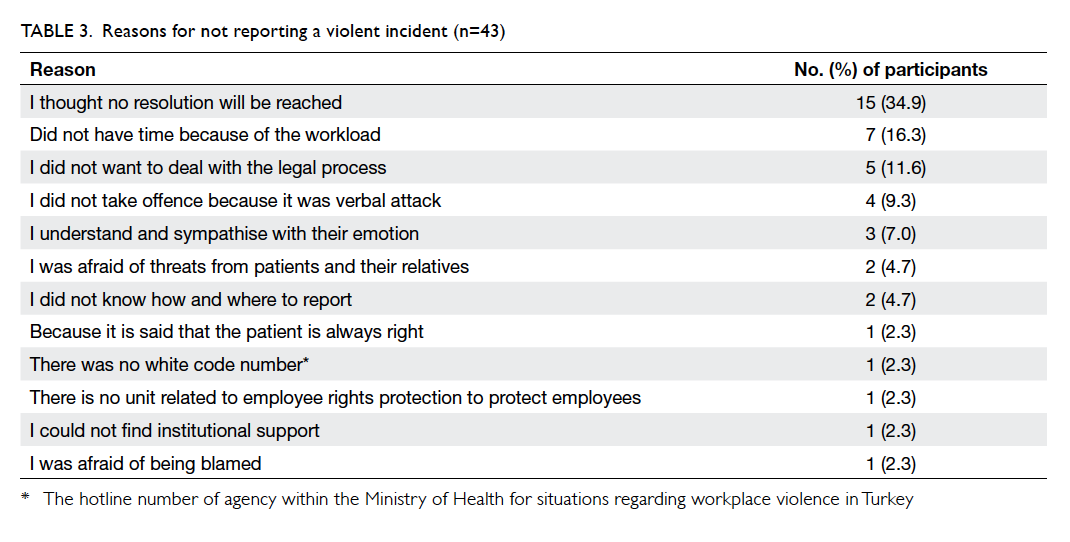
Table 3. Reasons for not reporting a violent incident (n=43)
A total of 248 participants responded to a
question regarding the identity of the person who
was to blame for the violence in ED in general (not
their own experiences). Accordingly, 65.3% (n=162)
stated that the patient’s relatives were responsible,
27.0% (n=67) stated that both the patients and
their relatives were responsible, and 5.2% (n=13)
placed sole responsibility on the patients. Six (2.4%)
participants stated that they had been subjected to
violence from other health care professionals.
When we asked individuals to estimate the
age of the person(s) causing the violence that they
had experienced, respondents who were exposed to
multiple violent incidents answered this question by
selecting multiple options and a total of 405 answers
were obtained. As shown in Table 4, the majority (71.4%) of people responsible for violent incidents
were young patients and patient relatives between
the ages of 18 and 39 years.
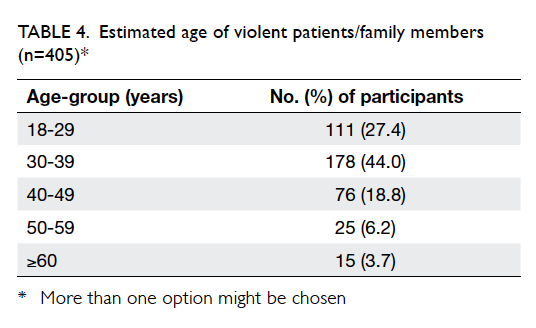
Table 4. Estimated age of violent patients/family members (n=405)
When participants who were exposed
to violence were asked who caused the violent
incident, three (1.3%) participants stated that they
themselves were responsible, five (2.1%) indicated that both sides were responsible, and the
remaining 231 (96.7%) held the attacker
responsible.
Participants were asked “What do you
think is the reason for the violence?”. A total of 181
(56.0%) participants responded to this question.
Some participants indicated more than one reason
and a total of 188 answers were obtained. The top 10
most common responses to this question are given in
descending order of frequency in Table 5. The most common cause of violence was ignorance and lack
of education of patients and their relatives (28.7%), followed by the impatient attitudes and demanding
priorities (23.4%) and the heavy workload and prolonged waiting time (10.6%).
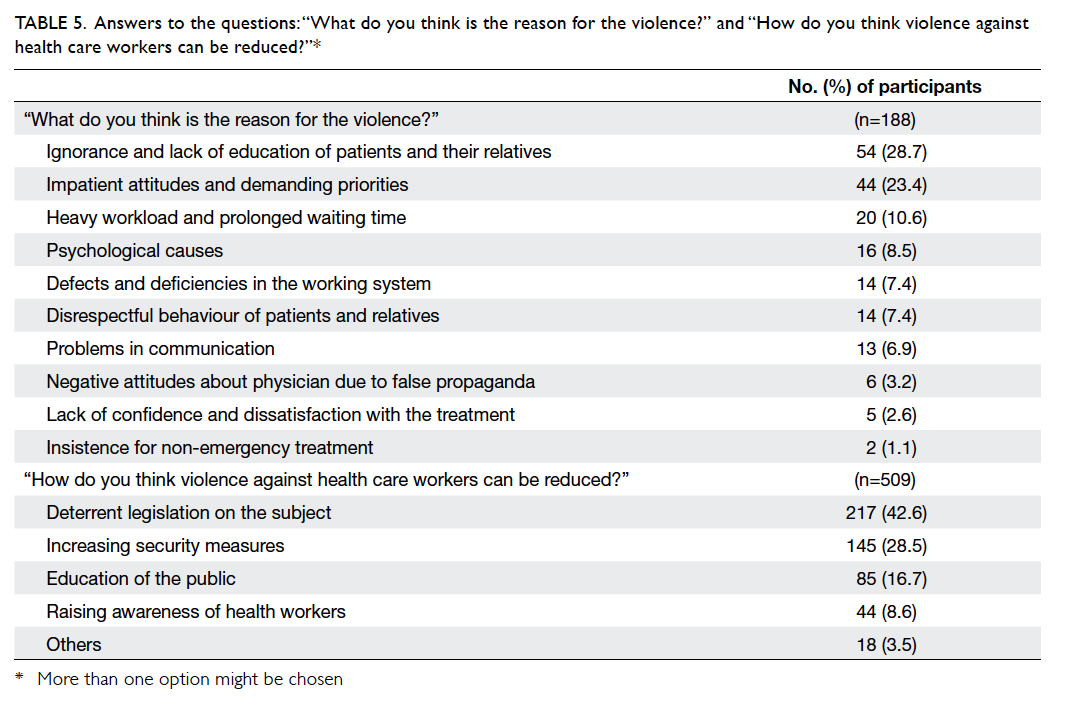
Table 5. Answers to the questions: “What do you think is the reason for the violence?” and “How do you think violence against health care workers can be reduced?”
Participants were asked “How do you
think violence against health care workers can be
reduced?”. Some participants indicated more than
one reason and a total of 509 answers were obtained.
They considered the most important steps suggested
to reduce violence against ED employees were the
enactment of deterrent legislation (42.6%), increased
security measures in hospitals (28.5%), and improved
public education (16.7%) [Table 5].
Participants were asked about their attitude
after experiencing violence. Some respondents gave
more than one answer and a total of 498 answers
were obtained. There were 27.1% of participants who
did not enjoy working in their current profession,
25.7% wanted to work in non–health care field, and
21.5% did not want to work in the ED (Table 6).
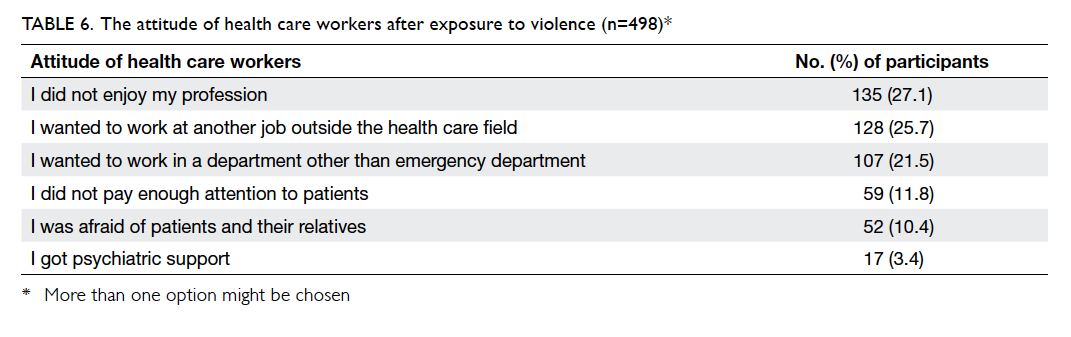
Table 6. The attitude of health care workers after exposure to violence (n=498)
A total of 96.3% (n=311) of participants
answered “Yes” to the question “Do you think
that the violence against health care workers has
increased in recent years?” Moreover, 90.7% (n=293)
of the participants answered “Yes” to the question
“Do news reports regarding violence against health
care workers affect you?”. Then, when participants
were asked “How does the news affect you?”, 64.7%
(n=209) reported that they were “sad”, 44.3% (n=143)
said they were “angry”, and 18.9% (n=61) said they
were “scared”.
When participants were asked “Are there
sufficient security measures in your workplace?”,
only 66 (20.4%) participants gave a positive response,
while 257 (79.6%) responded negatively. Among the
41 participants working as security staff, 33 (80.5%)
found the safety measures inadequate. Thus, both the
security staff and the general employee population
agreed that hospital security was inadequate.
Discussion
Workplace violence is the most prevalent in the
health care sector.4 The ED is the health care
unit with the highest frequency of exposure to
violence.3 7 8 9 According to several previous studies,
the proportion of health care professionals who
report prior exposure to violence in the workplace
ranges from 45% to 67.6%.3 8 12 13 14 The rate of violence against ED employees (79%-99%), however, is higher
than the average for the health care field.15 16 17
Emergency services are high-risk areas
for patients and staff with regard to workplace
violence18 19 20 21; 24-hour accessibility, a high-stress
environment, and the apparent lack of trained
security personnel are underlying factors.22
Workplace violence negatively affects the morale of
health care workers and negatively affects the health
and effectiveness of presentation.23 24 25 26
Our study was conducted among ED employees
of two different hospitals. We investigated the rate of
exposure to verbal or physical violence. Among the
participants, 239 (74.0%) stated that they had been
subjected to exposure to violence, and 57 (17.6%)
reported having been exposed to both verbal and
physical violence. A study in Turkey found that
among ED employees, including nurses, in the İzmir
province of Turkey, 98.5% of respondents had been
subjected to verbal violence and 19.7% were exposed
to physical violence.16 In another study conducted
in Turkey, 88.6% of ED employees were subjected to
verbal violence and 49.4% reported having been the
victim of physical violence.17
In the present study, the rate of exposure to
violence by profession was 95.7% among health care
officials/EMTs, 90.7% among doctors, and 80.5%
among security personnel. According to Ayrancı et
al,3 exposure to violence was most common among
practitioners (67.6%) and nurses (58.4%). In another
study, Alçelik et al27 reported that nurses were
exposed to violence 3 times more often than other
health care professionals. In the present study, the
frequency of exposure to violence among nurses was
62.7%, which is lower than that in other professional
groups.
In the present study, the estimated age
distribution of patients and patient relatives
responsible for violent incidents showed that the
majority (71.4%) were between 18 and 39 years of
age. Other studies have reported that individuals
prone to violence are generally younger than 30
years.28
Health care workers are often subjected to verbal
and physical attacks from patients and their relatives
who are dissatisfied with the services provided.10 11 In the present study, the most common cause of
violence was the lack of education and ignorance of
the patients and their relatives. Heavy workload was
identified as another cause of workplace violence.
Factors such as patient stress and anxiety regarding
their condition, high expectations of the patients
and their relatives, lack of effective institutional and
legal arrangements aimed at preventing violence,
and the failure to effectively document the extent of
workplace violence contribute to the high frequency
of violence.12 There are several factors that increase
the risk of violence in health care institutions,
including 24-hour service, long waiting time for
patients, poor access to health care services, heavy
workload, limited staff, inadequate employee
training, and lack of security personnel.29 30
Previous studies conducted in Turkey revealed
that 60% of ED employees who were exposed to
violence did not report the incident. Among the
reasons for not reporting was a lack of confidence
in health care and executive leadership as well
as the justice system.12 In the present study, the
incident reporting rate was also low (42.7%) and the
most important reason (34.9%) for not reporting
was the perception that “no resolution will be
reached”. Indeed, a study found that there were no
repercussions for the attacker in 77% of instances.12
This suggests the perception that “no resolution will
be reached” is a valid one.
A heavy workload consumes the energy of
employees and reduces their ability to empathise
with patients and tolerate violent situations.
Sometimes verbal or physical conflicts may arise
between a stressed patient who may be subject to
long waiting times and exhausted and stressed health
care workers. Training regarding communication
with patients helps health care professionals to avoid
these problems.31 Effective communication alone,
however, is not sufficient and additional steps must
be taken to reduce waiting time of patients. Previous
studies have indicated that the most important
reason for patient dissatisfaction in the ED is the
waiting time.32 33 Yet, the most important reason for long waiting times is the heavy workload caused, in
part, by the discourteous attitude of patients and
their relatives. Studies have also shown that more
than half of patients who present to the ED are not
‘emergency patients’.34 35 36 Further education regarding
the definition of “emergency” and the practice of
effective triage may reduce the heavy workload in
the ED and associated violent incidents.
One previous study reported that verbal and
physical attacks by patients and their relatives are
the most important factors contributing to stress
among ED employees.37 Consistent exposure to
high-stress conditions resulting from exposure to
verbal and physical violence results in both physical
and mental exhaustion. As a result, a situation known
commonly as ‘burnout syndrome’ emerges.38 39 The
burnout syndrome is defined as holding a negative
view of current events, frequent despair, and lost
productivity and motivation.40 Reluctance among
physicians to work in the ED is one consequence of
burnout syndrome.41 In the present study, among the
participants who were subjected to violence, 21.5%
indicated that they wanted to work in a department
other than the ED, while 25.7% stated a desire to work
outside the health care field. In a study conducted in
Canada, 18% of participants who had been exposed
to violence stated that they did not want to work in
the ED, and 38% wanted to work outside the health
care field.9 Others indicated that they had quitted their
jobs because of workplace stress.9 In the present
study, 10.4% of ED employees stated that they were
afraid of patients and their relatives. In the same
Canadian study, 73% of respondents stated that after
experiencing violence they were afraid of patients.9
In our study, 96.3% of respondents thought that
there had been an increase in violence against ED
health care workers in recent years. Moreover, 79.6%
of respondents stated that the safety measures in
their institutions were insufficient. The participants
in the present study suggested that the preparation
of deterrent legislation, increased security measures,
and efforts to better educate the general population
regarding the appropriate use of ED resources will
help to reduce violence against health care workers.
Limitations
The study was carried out in only two hospitals in
Turkey that may not be representative of all hospitals.
In addition, participants could decide whether or
not to answer all questions and some questionnaires
were incomplete. The response rate was only 74%
and this might give rise to self-selection bias, that
is, those who did not respond may have had a higher
(or lower) exposure to violence than those who
responded. Hence, the various percentages reported
in this paper might be over- or under-estimated.
Conclusion
The results of the current study as well as those
of earlier studies indicate that the prevalence of
violence against ED employees is high. Factors
such as patient and stress of health care provider,
prolonged waiting times due to overcrowding in the
ED, negative attitude of discourteous patients and
their relatives, insufficient security measures, and
the lack of sufficiently dissuasive legal regulations
may contribute to increased violence in the ED.
These factors in turn increase stress among ED
employees, reduce job satisfaction, and lower the
quality of services provided. Measures to decrease
the workload in the ED and shorten waiting time
of patients, the adoption of legal policies that deter
violent behaviour, and increased security measures
in health care facilities should be reassessed. Steps
should be taken to educate the public in order to
reduce violence against health care workers.
Declaration
All authors have disclosed no conflicts of interest.
References
1. Kocacik F. On violence [in Turkish]. Cumhuriyet Univ J
Econ Adm Sci 2001;2:1-2.
2. Violence and injury prevention. Available from: http://www.who.int/violence_injury_prevention/violence/activities/workplace/documents/en/index.html. Accessed
Nov 2012.
3. Ayrancı Ü, Yenilmez Ç, Günay Y, Kaptanoğlu C. The
frequency of being exposed to violence in the various
health institutions and health profession groups. Anatol J
Psychiatry 2002;3:147-54.
4. Wells J, Bowers L. How prevalent is violence towards
nurses working in general hospitals in the UK? J Adv Nurs
2002;39:230-40. Crossref
5. Workplace violence in the health sector. Framework
guidelines for addressing workplace violence in the health
sector. Available from: http://www.ilo.org/wcmsp5/groups/public/---ed_dialogue/---sector/documents/publication/wcms_160912.pdf. Accessed Nov 2012.
6. Kingma M. Workplace violence in the health sector: a
problem of epidemic proportion. Int Nurs Rev 2001;48:129-30. Crossref
7. Gülalp B, Karcıoğlu, Köseoğlu Z, Sari A. Dangers faced
by emergency staff: experience in urban centers in southern
Turkey. Ulus Travma Acil Cerrahi Derg 2009;15:239-42.
8. Lau J, Magarey J, McCutcheon H. Violence in the
emergency department: a literature review. Aust Emerg
Nurs J 2004;7:27-37. Crossref
9. Fernandes CM, Bouthillette F, Raboud JM, et al. Violence
in the emergency department: a survey of health care
workers. CMAJ 1999;161:1245-8.
10. Yanci H, Boz B, Demirkiran Ö, Kiliççioğlu B, Yağmur F.
Medical personal subjected to the violence in emergency
department—enquiry study. Turk J Emerg Med 2003;3:16-20.
11. Sucu G, Cebeci F, Karazeybek E. Violence by patient and
relatives against emergency service personnel. Turk J
Emerg Med 2007;7:156-62.
12. Çamci O, Kutlu Y. Determination of workplace violence
toward health workers in Kocaeli. J Psychiatr Nurs
2011;2:9-16.
13. Stirling G, Higgins JE, Cooke MW. Violence in A&E
departments: a systematic review of the literature. Accid
Emerg Nurs 2001;9:77-85. Crossref
14. Sönmez M, Karaoğlu L, Egri M, Genç MF, Günes G, Pehlivan E. Prevalence of workplace violence against health
staff in Malatya. Bitlis Eren Univ J Sci Technol 2013;3:26-31.
15. Stene J, Larson E, Levy M, Dohlman M. Workplace violence
in the emergency department: giving staff the tools and
support to report. Perm J 2015;19:e113-7. Crossref
16. Senuzun Ergün F, Karadakovan A. Violence towards
nursing staff in emergency departments in one Turkish
city. Int Nurs Rev 2005;52:154-60. Crossref
17. Boz B, Acar K, Ergin A, et al. Violence toward health care
workers in emergency departments in Denizli, Turkey. Adv
Ther 2006;23:364-9. Crossref
18. Joa TS, Morken T. Violence towards personnel in out-of-hours
primary care: a cross-sectional study. Scand J Prim
Health Care 2012;30:55-60. Crossref
19. Magnavita N, Heponiemi T. Violence towards health care
workers in a Public Health Care Facility in Italy: a repeated
cross-sectional study. BMC Health Serv Res 2012;12:108. Crossref
20. Arimatsu M, Wada K, Yoshikawa T, et al. An epidemiological
study of work-related violence experienced by physicians
who graduated from a medical school in Japan. J Occup
Health 2008;50:357-61. Crossref
21. Taylor JL, Rew L. A systematic review of the literature:
workplace violence in the emergency department. J Clin
Nurs 2011;20:1072-85. Crossref
22. Gacki-Smith J, Juarez AM, Boyett L, Homeyer C, Robinson
L, MacLean SL. Violence against nurses working in US
emergency departments. J Nurs Adm 2009;39:340-9. Crossref
23. Kowalenko T, Gates D, Gillespie GL, Succop P, Mentzel
TK. Prospective study of violence against ED workers. Am
J Emerg Med 2013;31:197-205. Crossref
24. Position statement: violence in the emergency care setting.
Available from: https://www.ena.org/government/State/Documents/ENAWorkplaceViolencePS.pdf. Accessed Nov
2012.
25. Workplace violence. Washington, DC: United States
Department of Labor; 2013. Available from: http://www.osha.gov/SLTC/workplaceviolence/index.html. Accessed Nov
2012.
26. Adib SM, Al-Shatti AK, Kamal S, El-Gerges N, Al-Raqem
M. Violence against nurses in healthcare facilities in
Kuwait. Int J Nurs Stud 2002;39:469-78. Crossref
27. Alçelik A, Deniz F, Yeşildal N, Mayda AS, Ayakta Şerifi B.
Health survey and life habits of nurses who work at the
medical faculty hospital at AIBU [in Turkish]. TAF Prev
Med Bull 2005;4:55-65.
28. Young GP. The agitated patient in the emergency
department. Emerg Med Clin North Am 1987;5:765-81.
29. Stathopoulou HG. Violence and aggression towards health
care professionals. Health Sci J 2007;2:1-7.
30. Hoag-Apel CM. Violence in the emergency department.
Nurs Manage 1998;29:60,63.
31. Yardan T, Eden AO, Baydın A, Genç S, Gönüllü H.
Communication with relatives of the patients in emergency
department. Eurasian J Emerg Med 2008;7:9-13.
32. Al B, Yıldırım C, Togun İ, et al. Factors that affect patient satisfaction in emergency department. Eurasian J Emerg
Med 2009;8:39-44.
33. Yiğit Ö, Oktay C, Bacakoğlu G. Analysis of the patient
satisfaction forms about Emergency Department services
at Akdeniz University Hospital. Turk J Emerg Med
2010;10:181-6.
34. Kiliçaslan İ, Bozan H, Oktay C, Göksu E. Demographic properties of patients presenting to the emergency
department in Turkey. Turk J Emerg Med 2005;5:5-13.
35. Ersel M, Karcıoğlu Ö, Yanturali S, Yörüktümen A, Sever M, Tunç MA. Emergency Department utilization
characteristics and evaluation for patient visit
appropriateness from the patients’ and physicians’ point of
view. Turk J Emerg Med 2006;6:25-35.
36. Aydin T, Aydın ŞA, Köksal Ö, Özdemir F, Kulaç S, Bulut M. Evaluation of features of patients attending the Emergency
Department of Uludağ University Medicine Faculty
Hospital and emergency department practices. Eurasian J
Emerg Med 2010;9:163-8. Crossref
37. Kalemoglu M, Keskin O. Evaluation of stress factors and
burnout in the emergency department staff [in Turkish].
Ulus Travma Derg 2002;8:215-9.
38. Ferns T, Stacey C, Cork A. Violence and aggression in the
emergency department: Factors impinging on nursing
research. Accid Emerg Nurs 2006;14:49-55. Crossref
39. Keser Özcan N, Bilgin H. Violence towards healthcare
workers in Turkey: A systematic review [in Turkish].
Turkiye Klinikleri J Med Sci 2011;31:1442-56. Crossref
40. Maslach C. Burned-out. Hum Behav 1976;5:16-22.
41. Dwyer BJ. Surviving the 10-year ache: emergency practice
burnout. Emerg Med Rep 1991;23:S1-8.