Breast pain in lactating mothers
Hong Kong Med J 2016 Aug;22(4):341–6 | Epub 17 Jun 2016
DOI: 10.12809/hkmj154762
© Hong Kong Academy of Medicine. CC BY-NC-ND 4.0
ORIGINAL ARTICLE
Breast pain in lactating mothers
Sophie SF Leung, FHKCPaed, FHKAM (Paediatrics)
Department of Paediatrics, The Chinese University of Hong Kong, Shatin, Hong Kong (c/o: Room 1502, 15/F, Hong Kong Pacific Centre, 28 Hankow Road, Tsimshatsui, Hong Kong)
Corresponding author: Dr Sophie SF Leung (dr.leung@ssfl.com.hk)
 Full
paper in PDF
Full
paper in PDF
Abstract
Introduction: The number of new mothers who
breastfeed has increased dramatically over the last
three decades. There is a concern that the present
related medical service may be inadequate. Breast
pain is the most common complaint among lactating
mothers who seek medical help. This study aimed to
investigate this problem.
Methods: Medical records of women who
presented with breast pain to a private clinic run
by a doctor who was trained as an International
Lactation Consultant were reviewed over a period
of 6 months in 2015. Most patients were self-referred
after chatting online. Assessment included
characteristics and duration of pain, treatment prior
to consultation, feeding practices, mother’s diet,
and breast examination. Any site of blockage was
identified and relieved. Those with persistent pain
were given antibiotics. When there were signs of
abscess or abscess that could not be drained, they
were referred to a breast surgeon.
Results: A total of 69 patients were seen of whom 45
had been breastfeeding for more than 1 month. Pain
was experienced for longer than 7 days in 22 women.
Antifungal or antibacterial treatment had been
unsuccessful in 31 women prior to consultation. The
diagnoses were engorgement in five women, blocked duct in 35,
mastitis in 13, breast abscess in six, poor positioning
and latch in seven, nipple cracks in two, and skin infection
in one. Oral antibiotics were prescribed to 21 patients
and local antifungal treatment was given to one
patient only.
Conclusion: Blocked duct was the most common
cause of breast pain in lactating mothers. Without
prompt relief it is possible that it will progress
to mastitis/breast abscess or the mother may
discontinue breastfeeding. This may be a suitable
time for Hong Kong to set up one or more public full-time
breastfeeding clinics to provide a better service
to lactating mothers and to facilitate professional
training and research.
New knowledge added by this study
- Most breast pain in lactating mothers is not necessarily due to bacterial or fungal infection but due to duct blockage that can be relieved promptly by gentle breast massage and milk expression.
- Local mothers had a specific dietary practice to encourage milk production that could sometimes be harmful.
- To cope with the increased prevalence of breastfeeding, relevant clinical services should be established, including one or more full-time breastfeeding clinics in the public sector that mothers can attend without the need for medical referral. This will also help in research since local practices and clinical problems may differ to those described in the literature.
Introduction
Hong Kong has experienced a tremendous change in
lifestyle and the consequent clinical problems pose a
challenge to the medical profession. A good example
of this is infant feeding. Almost half a century ago,
the prevalence of breastfeeding in Hong Kong was
at its lowest rate of 5% in 1978 after a dramatic fall
from 44% in 1967.1 Following the joint efforts of
doctors, nurses and mothers, the prevalence of the
ever breastfeeding rate in Hong Kong has rapidly
climbed from 20% in 1992 to 60% in 2002 and 86%
in 2014.2 The efforts of both the UNICEF Baby-Friendly Hospital Initiative and the Department of Health should be applauded.
Breast milk is the best for babies. Mothers
should be encouraged to breastfeed fully for 6
months, followed by introduction of solid foods and
continuation of breastfeeding for 2 years or more.
Recent data have shown that only 27% of mothers
can sustain breastfeeding for 4 to 6 months.2 There
are areas where we, as medical professionals, can
provide support. For historical reasons, however, not
many local doctors and nurses have been trained to
manage the clinical problems encountered by breastfeeding mothers. One such problem is breast pain.
Breast pain, which may lead to cessation
of breastfeeding, is the most common complaint
of lactating mothers seen in a private general
paediatric clinic run by a doctor (author) trained in
2000 as an International Lactation Consultant. This
study aimed to analyse the reasons for breast pain
and how it can be relieved.
Methods
Clinical records of lactating
mothers who presented with breast pain over a
6-month period (January to June 2015) were retrieved. Patients
were self-referred after chatting online with other
breastfeeding mothers. During consultation,
patients were asked about the history of pain,
prior treatment, breastfeeding practices, and their
own diet. Breast examination was then performed,
including the nipple and areola, to identify any
redness or tenderness. In particular, any blockage
was identified.
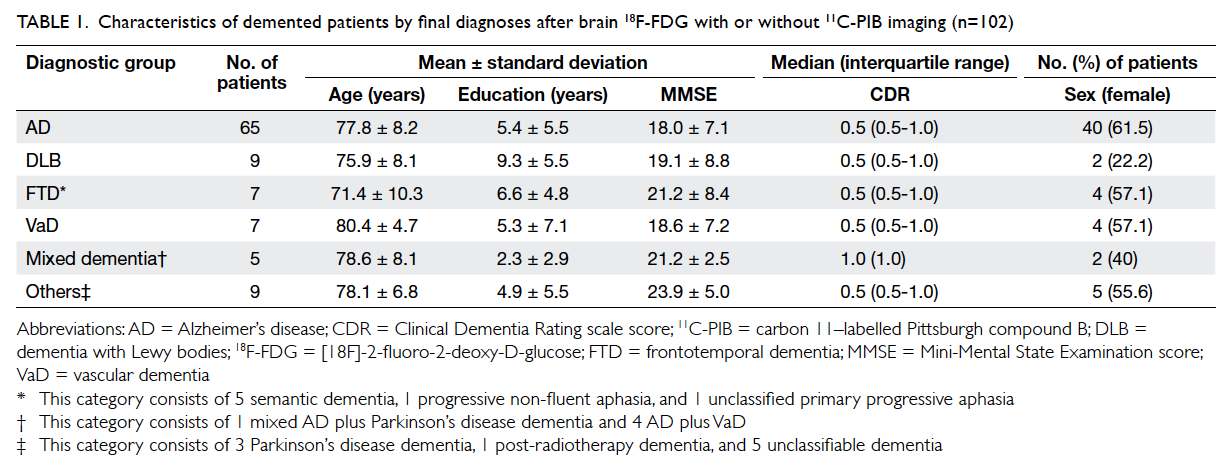
If redness or tenderness was generalised
in either or both breasts, it was diagnosed as
engorgement (Fig a). If it was confined to a segment, this implied only a lobule was involved. If gentle
massage and milk expression provided relief, a
blocked duct was diagnosed (Fig b). The ability to express pus (Fig c) or an area of fluctuation or skin thinning (Fig d) was indicative of breast abscess.
Mastitis was diagnosed in the presence of fever
and tenderness/mass that could not be relieved but
had not progressed to an abscess.3 Nipples were
examined for cracks (Fig e). Feeding position and
latch were checked when appropriate and corrected
accordingly. When there was a white spot in the
nipple, it was cleared by simple expression or by
using a needle to open up the blockage. If there was
a shinny reddish colour of the nipple and areola
together with burning, stinging, and itchiness then
fungal infection was diagnosed. In such case, the
baby’s mouth was also examined for the presence of
oral thrush.
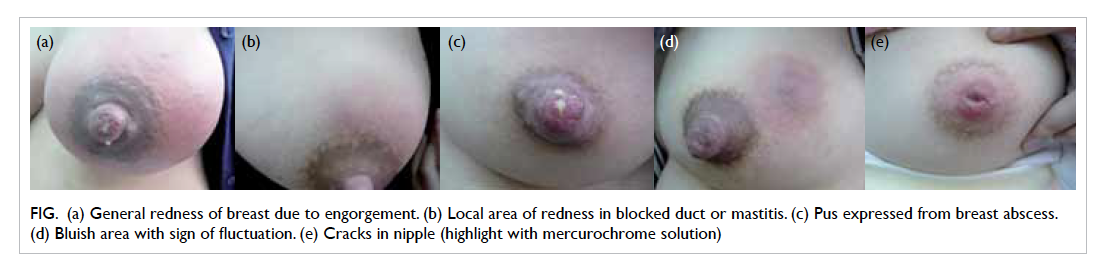
Figure. (a) General redness of breast due to engorgement. (b) Local area of redness in blocked duct or mastitis. (c) Pus expressed from breast abscess. (d) Bluish area with sign of fluctuation. (e) Cracks in nipple (highlight with mercurochrome solution)
Results
A total of 69 patients were seen of whom 45 had been
breastfeeding for more than 1 month. All except six
were in their 30s. The age of the baby was less than
1 month in 24 (35%) women, 1 to 6 months in 27
(39%), and over 6 months in 18 (26%). Only 13 (19%)
used complementary infant milk formula.
Breast pain was present for less than 3 days in
35 (51%) women but for longer in the remaining 34
(49%). Pain duration exceeded 7 days in 22 (32%); 15
(22%) of whom had intermittent pain for 14 to 30
days. In 31 (45%) patients, earlier treatment had been
received from various sources including Maternal
and Child Health Centres (MCHCs), family doctors,
general practitioners, obstetricians, doctors at an
accident and emergency department, surgeons in
a breast surgery clinic, or lactation consultants.
Antifungal or antibacterial medication, either local
or systemic, was prescribed.
Apart from breast pain, there were other
additional complaints: nipple pain in eight (12%) women,
sharp needle pain after feeding in eight (12%), white
spot at nipple in 15 (22%), and fever in 14 (20%).
All had decreased milk production by the affected
breast despite frequent feeding or pumping.
The following diagnoses were made: nipple
cracks (n=2), poor positioning and latch (n=7),
engorgement (n=5), blocked duct (n=35), mastitis
(n=13), breast abscess (n=6), and skin infection
(n=1). One had all pus drained via the milk duct.
Another had pus formed in the sebaceous gland at
the areola and was fully drained. The remaining four
were referred to a surgeon for further management.
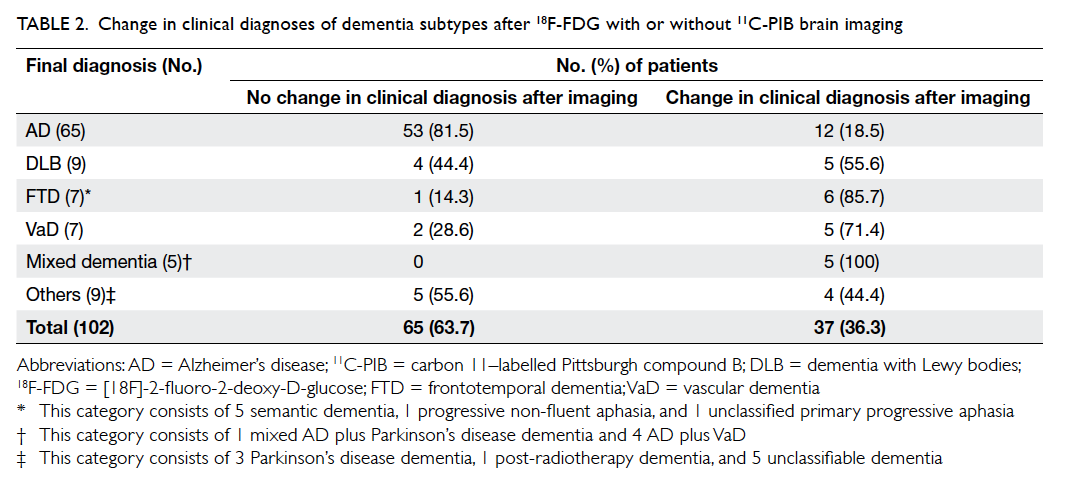
Oral antibiotics were prescribed to 21 (30%) women. Fungal
infection was suspected in only one woman. Clinical
details of four patients chosen for illustration are
shown in the Table.
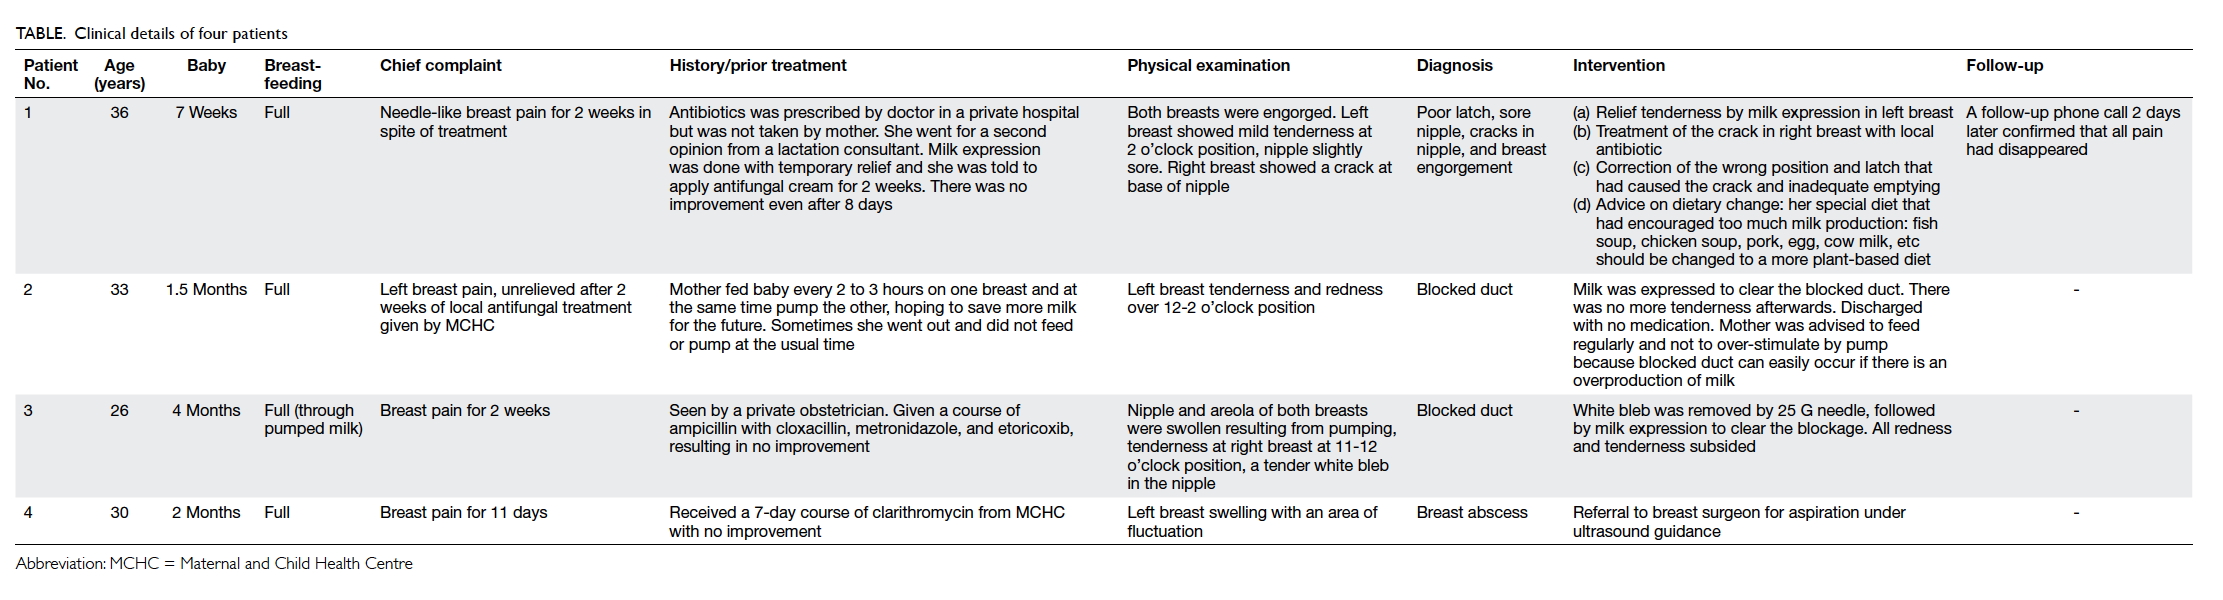
Table. Clinical details of four patients
Discussion
Subjects in this study represent mothers who were
very dedicated to breastfeeding. Most had been
breastfeeding for more than 1 month and had not
given up, despite experiencing pain for quite a
number of days.
Blocked duct/mastitis
Blocked duct was the most common cause of breast
pain in this study group. Delay in diagnosing and
treating a blocked duct can lead to a more serious
condition of mastitis and breast abscess.
Engorgement, blocked duct, mastitis, and
breast abscess reflect progression from a common
original problem of inadequate drainage that can
be due to poor positioning and latching, inadequate
emptying, or overproduction.3 Obtaining a good
history, performing a thorough breast examination,
and milk expression can help to make the diagnosis.
Engorgement usually involves the whole
breast whereas a blocked duct involves a lobule.
In the latter, redness and tenderness are apparent
and examination of the areola may reveal a tender
swelling representing a blockage of the duct near the
opening. Gentle massage and milk expression will
relieve the pain and tenderness. A simple blocked
duct can be relieved immediately. Nonetheless, when
the swelling can only be partially relieved, it may
represent tissue inflammation indicative of mastitis.
Mothers were encouraged to feed more often on the
affected breast. If this failed after one or two feeds,
antibiotics were prescribed to prevent progression
to breast abscess.
Milk is a very good medium for bacterial
culture. Stasis of milk for too long may lead to
infection (mastitis) and pus formation (abscess). The
common guideline is to relieve a blocked duct as
soon as possible, especially in the presence of fever.
Once fever has persisted for longer than 24 hours,
antibiotics are required. In one woman in this study,
however, breast abscess was evident within the first
few hours of fever and in another woman without
fever, thus fever should be considered a non-specific
sign. Clinical assessment was the most important. The
ratio of breast abscess to mastitis was higher in
this series (46.2%) compared with that reported
in the literature (11.1%).3 This may have been due
to a difference in sampling methods or different
diagnostic criteria for mastitis. The difference
between a blocked duct and mastitis can be very
subtle. Presence of redness and tenderness in the
breast with little effort to clear the blockage may be
classified as mastitis. What is of more concern is the
possible delay in management that allows untreated
mastitis to progress to breast abscess. An abscess can
be drained through the duct manually, but needle
aspiration under ultrasound guidance or incision
may be required in some cases. If there is an incision,
the wound must be left open for continuous drainage
and the mother may be forced to stop breastfeeding.
Since most of these infections are due to
Staphylococcus aureus, Streptococcus, or Escherichia
coli, antibiotics chosen should be amoxicillin with
clavulanate, cloxacillin, or cefuroxime; all of which
are compatible with continuation of breastfeeding.3
Nipple pain
Nipple pain may indicate a blocked duct because the
duct beneath the areola is swollen. There should be
some tenderness although not as much as that of the
affected breast lobule. After relief of the blockage,
nipple pain will resolve.
A white spot at the nipple may also indicate a
blocked duct. Blockage of a lobule and then stasis of
milk at the opening of the duct can lead to further
blockage by milk that has a high fat or high calcium
content. This spot will be white in colour, sometimes
referred to as a bleb. It can be removed by milk
expression, needle or local application of vegetable
oil. This should not be confused with thrush.
Concern has already been raised about the
general overdiagnosis of fungal infection as a cause
of breast pain, nipple pain, or white spot.4 Patients
treated for a presumed ‘yeast infection’ might have
shown improvement in symptoms as a result of the
anti-inflammatory effect of the antifungal drugs
or because the blocked duct resolved on its own.
Fungal infection of the breast and nipple may be
considered if a blocked duct has been excluded and
is often associated with other risk factors. Examples
are consuming a diet with high sugar content that
promotes growth of fungus, mother having received
antibiotics, a maternal history of vaginal candidiasis,
or baby’s oral mucosa with thrush.4 All these risk
factors were not found in any of the mothers in this
study. Excruciating pain after a feed is a non-specific
sign. It is more likely to be due to a blocked duct
or inadequate emptying of the breast, as shown in
this study. These patients had failed to improve after
being given local or systemic antifungal treatment in
their previous consultations prior to presentation to
this clinic. Pain was relieved only after the blocked
duct was cleared.
Diet of lactating mothers
There was a general misunderstanding among the
lactating mothers that eating more animal foods
could improve milk supply. Previous studies have
shown that the protein intake of local lactating
mothers is much higher than that of those in other
countries. At 3 months postpartum, Hong Kong
mothers had a protein intake of 98 g/day5 compared
to 81 g/day in the UK6 and 80 g/day in Japan.7 In
the first month after delivery (known locally as the
confinement period), the protein intake was even
higher (133 g/day)5 than at 3 months. During this
month, local mothers usually consume a special diet
consisting of much more pork, fish, chicken, egg,
and milk.
The practice of eating a special diet with
additional animal foods during confinement may
be unique to Hong Kong Chinese population and is
likely a long Chinese tradition. The original rationale
was to replenish the blood loss of childbirth and
may have been necessary at a time when the general
population had barely enough food. Prior to the
1960s, our ancestors usually ate a plant-based diet,
with pork available only in the Chinese New Year
or during some festivals. There was very little over-nutrition.
Time has changed. The diet of adults
today is generally high in animal protein8 and fat.
Further increase will lead to new clinical problems,
not just weight gain in mothers but also increased
risk of blockage and inflammation in breastfeeding
mothers. A diet that contains much more meat
has been shown to be associated with higher
inflammatory index scores9 and one of these is C-reactive
protein.10
The quantity and quality of fat in breast milk
can be affected by the fat in the maternal diet.
Lactating mothers in Chongqing (a major city in
Southwest China) consumed a diet wherein fat
came from lard. Total fat in the breast milk was
higher in Chongqing: 38 g/L compared with 32 g/L in
Hong Kong.11 Chongqing mothers did not appear to
have problems of blocked ducts or mastitis. Thus, a
high-fat diet per se may not cause mastitis, it is the
quality of fat that matters. Mothers who consume
a diet high in saturated fat may be more prone to
duct blockage.3 Mothers with a recurrent blocked
duct were often advised to change their diet to one
with more polyunsaturated fat or use a supplement,
lecithin.3 A dietary source of lecithin is mainly soy
or eggs. It would appear to be a good practice for
lactating mothers in Chongqing to eat lots of eggs.
However, in view of the possibility of egg allergy,
Hong Kong mothers may be better advised to eat
more soy products. Mothers in this study group
appeared to eat very few soy products.
High milk production together with
inadequate emptying definitely poses a problem.
Many Hong Kong mothers took both Chinese
remedies (herbs, fish soups) and drank western teas
(eg fenugreek) to increase milk production. Nearly
all breastfeeding mothers had a breast pump. Some
mothers pumped milk more often to produce an
excess for later use. Indeed quite a number of the
studied mothers had plenty of stored milk in their
refrigerator. Working mothers may have stopped
pumping during weekends. Such irregular breast
emptying may cause the problem of milk stasis. The
presence of fatigue, stress, and an imbalanced diet
can encourage inflammation that can easily progress
to mastitis. Recurrence of blocked duct/mastitis may
occur if the mother’s diet and practice of feeding or
pumping are not corrected.
A diet rich in white sugar or corn syrup,
pastries, and cakes can enhance the growth of fungus
but was generally not observed in our subjects.
This may explain why fungal infection was rare. A
natural well-balanced diet with whole grains, plenty
of vegetables and fruits, and no excessive animal
products should be recommended. Refined sugary
foods, foods with chemicals, colouring agents, and
preservatives should be avoided.
Medical services
A substantial number of nurses had passed the
examination that qualified them as an International
Lactation Consultant. They worked mainly in
the maternity wards of hospitals and MCHCs in
Hong Kong. They were very successful in initiating
breastfeeding. Some hospitals ran a breastfeeding
clinic to support mothers after discharge from the
maternity ward but they were not available round the
clock. Most mothers with breastfeeding problems
attended a MCHC to seek for help. Other mothers
chose to see their family doctors. In general, doctors
had little training in dealing with problems related
to breastfeeding. In 2011, the Department of Health
produced a self-learning kit on breastfeeding for any
doctor who was interested, but it is difficult for the
public to identify such doctors.
Breast pain can sometimes be unbearable.
Some patients described it as worse than labour pain.
It is unknown from this study how many mothers
had stopped breastfeeding because of the pain or
how many ended up in hospital with a high fever and
abscess that required surgery. Many patients in this
study stated that after earlier treatment failed, they
had no idea where else to seek further help. Others
hesitated to seek medical help because they were
afraid they would be told to stop breastfeeding. The
mothers in this study were perhaps exceptional. They
had tried very hard to find a solution for their pain
even though it might have taken a number of days.
These mothers deserve a better medical service. The
Secretary for Food and Health has stated that the
government is very supportive of breastfeeding and
is ready to collaborate with health care professional
bodies or non-governmental organisations in
training personnel and promoting breastfeeding.12
Setting up breastfeeding clinics is the correct
approach. These clinics can be run by MCHCs or a
Baby-Friendly Hospital and should be full time and
open to all. Doctors and lactation consultants can
accumulate clinical experience faster and can then
act as professional trainers. There is also a need for
more local research on the diet and health of lactating
mothers, especially those in confinement, so that
appropriate education can be delivered to doctors,
lactation consultants, midwives, peer counsellors,
confinement nannies, and the public.
This study was limited by its retrospective
nature. There was a lack of standard protocols for
data recording and retrieval. Not all women were
followed up to determine if they had completely
recovered since it is difficult to do so in a private
clinic. What is certain is that those with engorgement
and a blocked duct felt immediate relief the moment
they left the clinic. It is also quite possible that many
cases of breast pain were treated by other doctors
and lactation consultants. The data of this study may
thus not be representative of Hong Kong in general.
Conclusion
Blocked duct was the most common cause of breast
pain in lactating mothers. Without prompt relief
it may progress to mastitis/breast abscess or the
mother may choose to stop breastfeeding. It may
be a suitable time for Hong Kong to set up one or
more public full-time breastfeeding clinics in order
to provide a better service for lactating mothers and
to facilitate professional training and research.
Declaration
The author has disclosed no conflicts of interest.
References
1. Baber FM. The current situation in Hong Kong. Hong
Kong Pract 1981;5:132-7.
2. Baby-Friendly Hospital Initiative Hong Kong Association. Available from: http://www.babyfriendly.org.hk/en/breastfeeding-in-hk/breastfeeding-trend/. Accessed Feb 2016.
3. Lawrence RA, Lawrence RM. Breast feeding: a guide for
the medical profession. 5th ed. St Louis: Mosby; 1999:
273-83.
4. Wilson-Clay B, Hoover K. The breastfeeding atlas. 5th ed.
US: LactNews Press; 2013: 57-8.
5. Chan SM, Nelson EA, Leung SS, Cheng JC. Bone mineral
density and calcium metabolism of Hong Kong Chinese
postpartum women—a 1-y longitudinal study. Eur J Clin
Nutr 2005;59:868-76. Crossref
6. Black AE, Wiles SJ, Paul AA. The nutrient intakes of
pregnant and lactating mothers of good socio-economic
status in Cambridge, UK: some implications for
recommended daily allowances of minor nutrients. Br J
Nutr 1986;56:59-72. Crossref
7. Takimoto H, Yoshiike N, Katagiri A, Ishida H, Abe S.
Nutritional status of pregnant and lactating women in
Japan: a comparison with non-pregnant/non-lactating
controls in the National Nutrition Survey. J Obstet
Gynaecol Res 2003;29:96-103. Crossref
8. Leung SS, Woo J, Ho S, Lam TH, Janus ED. Hong Kong
dietary survey. Aust J Nutr Diet 1988;55(Suppl):S11-4.
9. Morimoto Y, Beckford F, Cooney RV, Franke AA,
Maskarinec G. Adherence to cancer prevention
recommendations and antioxidant and inflammatory
status in premenopausal women. Br J Nutr 2015;114:134-43. Crossref
10. Turner-McGrievy GM, Wirth MD, Shivappa N, et al.
Randomization to plant-based dietary approaches leads to
larger short-term improvements in Dietary Inflammatory
Index scores and macronutrient intake compared with diets
that contain meat. Nutr Res 2015;35:97-106. Crossref
11. Chen ZY, Kwan KY, Tong KK, Ratnayake WM, Li HQ,
Leung SS. Breast milk fatty acid composition: a comparative
study between Hong Kong and Chongqing Chinese. Lipids
1997;32:1061-7. Crossref
12. Hong Kong Paediatric Society, Hong Kong Paediatric
Foundation. Summit on Breastfeeding and Early Childhood
Nutrition in the First 1000 Days 2015; Abstract: 18.