Hong Kong Med J 2016 Apr;22(2):144–51 | Epub 29 Jan 2016
DOI: 10.12809/hkmj144458
© Hong Kong Academy of Medicine. CC BY-NC-ND 4.0
ORIGINAL ARTICLE
Comparison of fluorescence in-situ hybridisation with dual-colour in-situ hybridisation for
assessment of HER2 gene amplification of breast cancer in Hong Kong
Scott MC Tang, MB, ChB, MRCSEd1;
Inda S Soong, FRCR, FHKAM (Radiology)2;
MY Luk, FRCR, FHKAM (Radiology)3;
Dacita TK Suen, FRACS, FHKAM (Surgery)4;
F Hioe, FHKCPath, FHKAM (Pathology)5;
Ellen PS Man, MMedSc1;
Obe KL Tsun, CFIAC, MMedSc1;
US Khoo, FRCPath, FHKAM (Pathology)1
1 Department of Pathology, LKS Faculty of Medicine, The University of
Hong Kong, Hong Kong
2 Department of Clinical Oncology, Pamela Youde Nethersole Eastern
Hospital, Chai Wan, Hong Kong
3 Department of Clinical Oncology, Queen Mary Hospital, Pokfulam, Hong
Kong
4 Department of Surgery, Queen Mary Hospital, Pokfulam, Hong Kong
5 Department of Pathology, Pamela Youde Nethersole Eastern Hospital,
Chai Wan, Hong Kong
Corresponding author: Prof US Khoo (uskhoo@hku.hk)
 Full
paper in PDF
Full
paper in PDF
Abstract
Objectives: To compare the PathVysion fluorescence
in-situ hybridisation assay with the INFORM
HER2 Dual in-situ hybridisation assay on 104
invasive breast cancers with a broad spectrum of
immunohistochemistry scores.
Methods: This case series involved consecutive patients diagnosed with invasive breast carcinoma with equivocal immunohistochemistry score and referred for further HER2 assessment from the departments of Surgery and/or Clinical Oncology of the two hospitals between January 2013 and February 2014. An additional 10 cases with negative HER2 immunohistochemistry and 11 cases with positive HER2 immunohistochemistry were further included.
Results: The results of both fluorescence in-situ
hybridisation and dual in-situ hybridisation were
available in 99 of 104 cases, respectively. Student’s
t test showed no statistically significant difference
in the mean number of HER2 count, CEP17 copies,
or HER2/CEP17 ratio between that obtained by
fluorescence in-situ hybridisation and that obtained
by dual in-situ hybridisation. Pearson’s correlation of
results for the two assays was strong for HER2/CEP17 signal
ratio (R=0.963, P<0.001) and mean HER2 copies
per nucleus (R=0.897, P<0.001). Overall agreement
was 96.0% (95 out of 99 cases, ĸ=0.882). Three of
the four discordant cases were equivocal for either
fluorescence in-situ hybridisation or dual in-situ
hybridisation. The results of immunohistochemistry
0/1+ and 3+ cases showed 100% concordance
between the two assays. The failure rate was 0.96%
for fluorescence in-situ hybridisation and 3.85%
for dual in-situ hybridisation. Cases that failed for
fluorescence in-situ hybridisation were successful
for dual in-situ hybridisation and vice versa.
Conclusions: Our study showed that dual in-situ
hybridisation is a reliable and useful option for HER2
testing in breast cancer.
New knowledge added by this study
- Our local experience confirmed the diagnostic value of dual in-situ hybridisation (DISH) for assessment of HER2 gene amplification in breast cancer, with excellent correlation between fluorescence in-situ hybridisation assay (FISH) and DISH results. Cases that failed FISH were successful with DISH and vice versa.
- DISH provides a reliable and useful option for HER2 testing in breast cancer, and offers some practical advantages.
Introduction
Breast cancer is the most common female
malignancy. In Hong Kong, breast cancer accounted
for about 26% of newly diagnosed cancers and
10% of cancer mortality in women.1 The human
epidermal growth factor receptor type 2 (HER2) gene is
a very important predictor of clinical outcome in
breast cancer patients; protein overexpression or gene amplification is associated with
higher rates of recurrence and higher mortality,2 and
responsiveness to endocrine3 and chemotherapeutic
regimens.4 Trastuzumab (Herceptin; Genentech
Inc, South San Francisco, US) that targets the HER2
oncoprotein is an established therapy for HER2-positive breast cancer patients in both the adjuvant5 6
and metastatic settings.7 8 Thus HER2 status is an
important guide to the use of systemic adjuvant
therapies. Because of the expense and potential
life-threatening cardiotoxicity of Herceptin therapy,
accuracy of the HER2 testing is of primary importance.
The American Society of Clinical Oncology
and the College of American Pathologists (ASCO/CAP)
have issued guidelines recommending determination
of HER2 status in all patients with invasive breast
cancer (early stage, or recurrence/metastasis)
to guide therapy.9 10 11 Following the guidelines
published in 2007, many laboratories now use
immunohistochemistry (IHC) as a screening test,
with fluorescence in-situ hybridisation (FISH) used
to determine HER2 status in equivocal IHC cases and
to serve as a reference standard. The prevalence of
HER2 gene amplification in breast cancer varies between
studies, ranging from about 20% to 30%.10 12 13 14 15
Although FISH remains the ‘gold standard’ to
determine HER2 gene amplification, in 2013, the
INFORM HER2 Dual-ISH DNA Probe Cocktail
assay (Ventana Medical Systems, Tucson, US) was
approved by the Food and Drug Administration
(FDA) for determination of HER2 gene amplification status
as an alternative to FISH.16 It utilises silver in-situ
hybridisation (ISH) to detect the HER2 gene and
chromogenic ISH for the chromosome 17 centromere
(CEP17) for visualisation on the same slide under
light microscopy. Both FISH and dual-colour in-situ
hybridisation (DISH) use formalin-fixed, paraffin-embedded
breast cancer tissue specimens, but DISH
has the advantage of allowing light microscopy
assessment. This enables concurrent visualisation of
histomorphological features with HER2 gene status,
permitting the invasive component of the tumour
to be more easily identified and analysed. Unlike
FISH where the immunofluorescent signals will
fade, DISH specimens can be archived and retrieved
indefinitely. The assay can be processed on an
automated platform and can contribute to reduced
reporting turnaround time.
Some studies that compared FISH and DISH
assays have shown excellent concordance.17 18 19 20
We have previously reported the prevalence and
concordance between IHC HER2 overexpression
and ISH assay of breast cancers in Hong Kong.21
Funded by the SK Yee Medical Foundation to provide
HER2 FISH testing in patients receiving treatment
from public hospitals, and with subsequent FDA
approval to provide the alternative HER2 DISH test,
we performed a validation study in our laboratory
to compare the results of FISH and DISH tests in
determining HER2 status in breast cancer, before
offering DISH for routine testing.
Methods
Patients
This retrospective study included 104 breast cancer
cases referred from the Department of Clinical
Oncology of Pamela Youde Nethersole Eastern
Hospital and Queen Mary Hospital, and from the
Department of Surgery, Queen Mary Hospital. Case
selection was based on IHC results representing
three IHC categories: negative (0 or 1+ HER2 score),
equivocal (2+ HER2 score), and positive (3+ HER2
score) for HER2 overexpression, interpreted and
classified according to the ASCO/CAP guidelines
at the time of presentation. Slides from both
hospitals were reviewed and confirmed to fulfil the
updated classification score of the ASCO/CAP 2013
guidelines. These included 83 consecutive cases
between January 2013 and February 2014 that were
equivocal for HER2 IHC (2+ score). In addition, 10
cases that were reported to be HER2 IHC-negative
(0 or 1+ score) and 11 cases reported as HER2 IHC-positive
(3+ score) were added to the study.
All patients had undergone surgery for invasive
breast cancer. None had received preoperative
chemotherapy. All tests were performed at the CAP-accredited
University Pathology Laboratory of the
University of Hong Kong.
Serial 4-6 µm sections were prepared from
formalin-fixed, paraffin-embedded tumour tissue.
Sections were sent for haematoxylin and eosin
(H&E) and immunohistochemical staining. The H&E
sections were reviewed by a certified pathologist.
Areas of invasive tumour were marked on the slide
for assessment. For FISH analysis, only the invasive
tumour components were included for assessment,
being mindful that it is difficult to distinguish
in-situ from invasive carcinoma under assessment by dark field imaging.
Fluorescence in-situ hybridisation analysis
The FISH testing was performed using the FDA-approved
PathVysion HER2 DNA Probe Kit (Abbott
Molecular Inc, Illinois, US). All samples were
processed following previously defined protocols in
compliance with the manufacturer’s instructions.
Briefly, the slides were baked overnight at 56°C,
deparaffinised, dehydrated, and air-dried. This was
followed by protease treatment for 30 minutes. DNA
was denatured at 72°C and hybridisation carried out
at 37°C for 16 hours.
Slides were then washed and air-dried.
Counterstain was applied and the slide covered and
sealed. Positive and negative controls were included
for each batch of analysis. Slides were then visualised
under a fluorescence microscope (CGH workstation,
Leica Q550CW) with a 100x objective using a triple
filter that included DAPI, GFP, and Texas Red. The
HER2 gene is visualised as a red/orange signal, and
the CEP17 as a green signal.
The number of HER2 and CEP17 signals was
counted for 20 nuclei. The signal ratio was then
calculated for each case. One to three photos were
taken for each case. Following criteria given by the
ASCO/CAP guidelines, a FISH result was rejected
and repeated if: controls were not as expected;
observer could not find and count at least two areas
of invasive tumour; >25% of signals were unscorable
due to weak signals; >10% of signals occurred
over cytoplasm; nuclear resolution was poor;
or autofluorescence was strong.9 Figures 1a and 1c
show representative FISH results of a sample from
two patients.
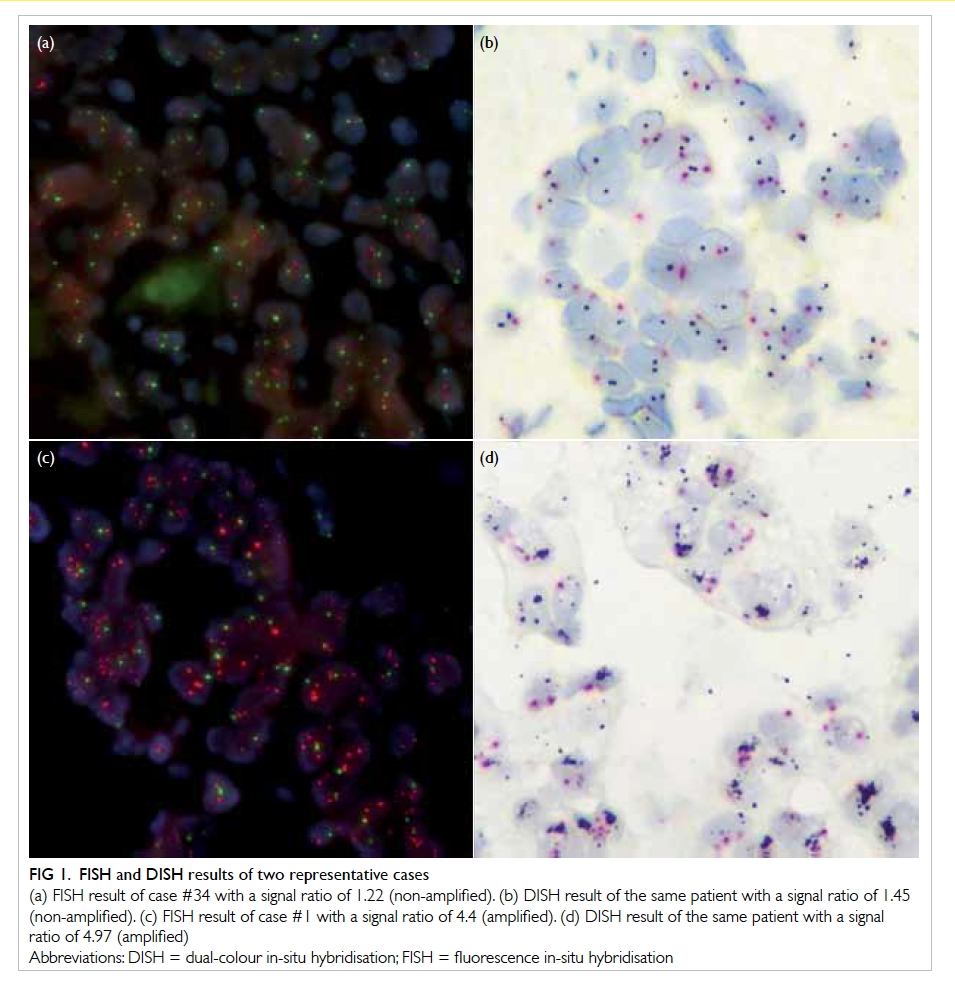
Figure 1. FISH and DISH results of two representative cases
(a) FISH result of case #34 with a signal ratio of 1.22 (non-amplified). (b) DISH result of the same patient with a signal ratio of 1.45 (non-amplified). (c) FISH result of case #1 with a signal ratio of 4.4 (amplified). (d) DISH result of the same patient with a signal ratio of 4.97 (amplified)
Dual-colour in-situ hybridisation analysis
The DISH testing was performed using the INFORM
HER2 Dual-ISH DNA Probe Cocktail assay
(Ventana Medical Systems, Tucson, US). All samples
were processed automatically by BenchMark XT
(Ventana Medical Systems). The HER2 was detected by a
dinitrophenyl (DNP)–labelled probe and visualised
in black colour utilising the ultraView Silver ISH
DNP Detection Kit (Ventana Medical Systems).
The CEP17 was targeted with a digoxigenin
(DIG)–labelled probe and detected as a red signal
using the ultraView Red ISH DIG Detection Kit
(Ventana Medical Systems). Haematoxylin II
was used as counterstain. Positive and negative
controls were included for each batch of analysis.
Slides were visualised under a 40x objective with a
light microscope. Signal counting was performed
according to the manufacturer’s interpretation
guide. The number of HER2 and CEP17 signals was
counted for 20 nuclei and the signal ratio calculated
for each case. One to three photos were taken for
each slide. A DISH result was rejected and repeated
according to the same criteria as FISH in the ASCO/CAP guidelines. Figures 1b and 1d show the DISH
results for the same two patients in Figures 1a and 1c.
Scoring criteria
For signal counting of FISH and DISH, the number of
HER2 gene signals and CEP17 signals were counted
in 20 tumour nuclei. The HER2/CEP17 signal ratio
and mean number of HER2 signals per nucleus
was calculated. HER2 gene amplification status was
then determined according to ASCO/CAP 2013
guidelines for dual-probe ISH assay.9 For cases that
presented before the 2013 guidelines, raw data of
signal enumeration were retrieved, and the results
reclassified after applying the new guideline. Briefly,
if HER2/CEP17 ratio was ≥2.0, it was classified as
positive. If HER2/CEP17 ratio was <2.0, classification
would be based on mean HER2 copy number per
nucleus. If mean HER2 copy number per nucleus
was ≥6, then it was positive; if it was ≥4.0 and <6.0, then it
was equivocal; if it was <4.0, then it was negative.
Statistical analyses
Cases that failed FISH or DISH analysis were
excluded from statistical analysis. The Statistical
Package for the Social Sciences (Windows version
20.0; SPSS Inc, Chicago [IL], US) was used. The
following statistical analyses were performed:
(1) First, one-way analysis of variance (ANOVA)
test was used to analyse the relationship
between IHC result and quantitative results of
FISH and DISH.
(2) We tested whether DISH underestimated or
overestimated the number of HER2 or CEP17
copies when compared with FISH. The null
hypothesis was that there was no difference.
Student’s t test was used to examine the result
of both tests on mean HER2/CEP17 ratio and
mean HER2 copy number per nucleus.
A P value of <0.05 indicated a statistically
significant difference.
(3) We also used the Bland-Altman plots to show
the degree of agreement graphically. Linear
regression was used to show the relationship
of FISH and DISH results. Pearson product-moment
correlation coefficient (R) was
calculated to evaluate the correlation between
quantitative results of FISH and DISH. A
positive R (0 to 1) indicates positive correlation
and a negative R indicates negative correlation.
If -1≤R<-0.7 or 0.7<R≤1, it indicates strong
association. A P value of <0.05 indicated a
statistically significant difference.
(4) To evaluate agreement between FISH and DISH
in the classification of HER2 gene amplification
status, Cohen’s Kappa coefficient was used
to factor in the possibility that the two tests
agreed due to chance. We also calculated
simple agreement percentage for comparison
with results of other studies.
All tests were two-sided. All confidence
intervals (CIs) and P values were included in the
results.
Results
Failure cases
Both FISH and DISH results were available in 99 of
104 cases. One case (#85) failed FISH analysis after
two attempts. Four cases (#14, #78, #84, #101) failed
DISH analysis after two attempts. The failure rate
was 0.96% for FISH and 3.85% for DISH. The reasons
for failure included criteria for result rejection as
stated in ASCO/CAP guidelines.
One-way analysis of variance
The results of one-way ANOVA analysis are shown
in Table 1. For FISH versus IHC, the P value was <0.001
for mean HER2/CEP17 ratio and mean HER2
copies per nucleus. Both were <0.05, indicating a
significantly different FISH reading for the different
IHC groups. For DISH versus IHC, the P value was <0.001
for mean HER2/CEP17 ratio and mean HER2
copies per nucleus. Both were <0.05, indicating a
significantly different DISH reading for the different
IHC groups.
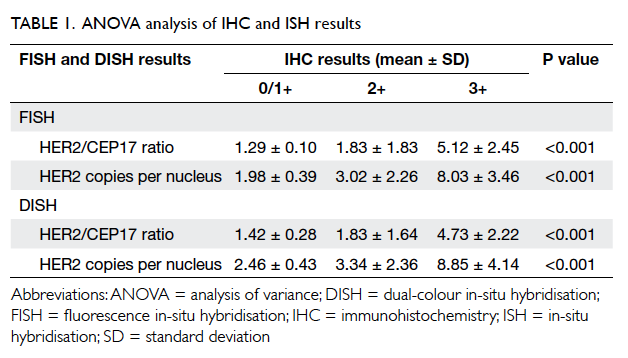
Table 1. ANOVA analysis of IHC and ISH results
Student’s t test
The result of Student’s t test is shown in Table 2. The mean number (± standard deviation)
of HER2 counts by FISH analysis was 3.5 ± 2.8,
result by DISH was 3.8 ± 3.0 with no statistically
significant difference between the results (P=0.41). The mean HER2/CEP17 ratio by FISH was 2.1 ± 2.1, result by DISH
was 2.1 ± 1.8. There was no statistically significant
difference between the results (P=0.86).
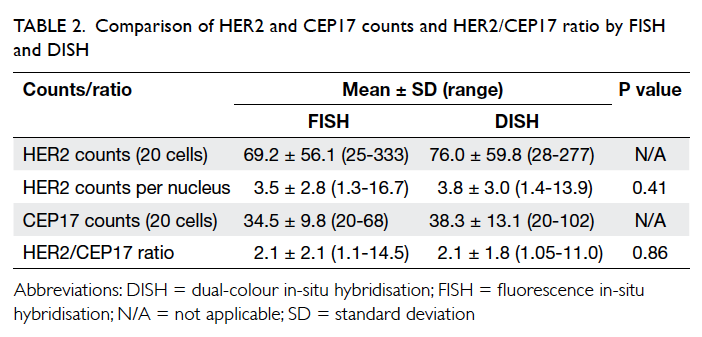
Table 2. Comparison of HER2 and CEP17 counts and HER2/CEP17 ratio by FISH and DISH
Bland-Altman (limits of agreement) plot
The Bland-Altman plot is shown in Figure 2a. For HER2 counts per nucleus, the mean difference (FISH-DISH) was 0.386. The 95% CI was -2.99 to 2.22.
For HER2/CEP17 ratio, the mean difference (FISH-DISH) was 0.279. The 95% CI was -0.87 to 1.43.
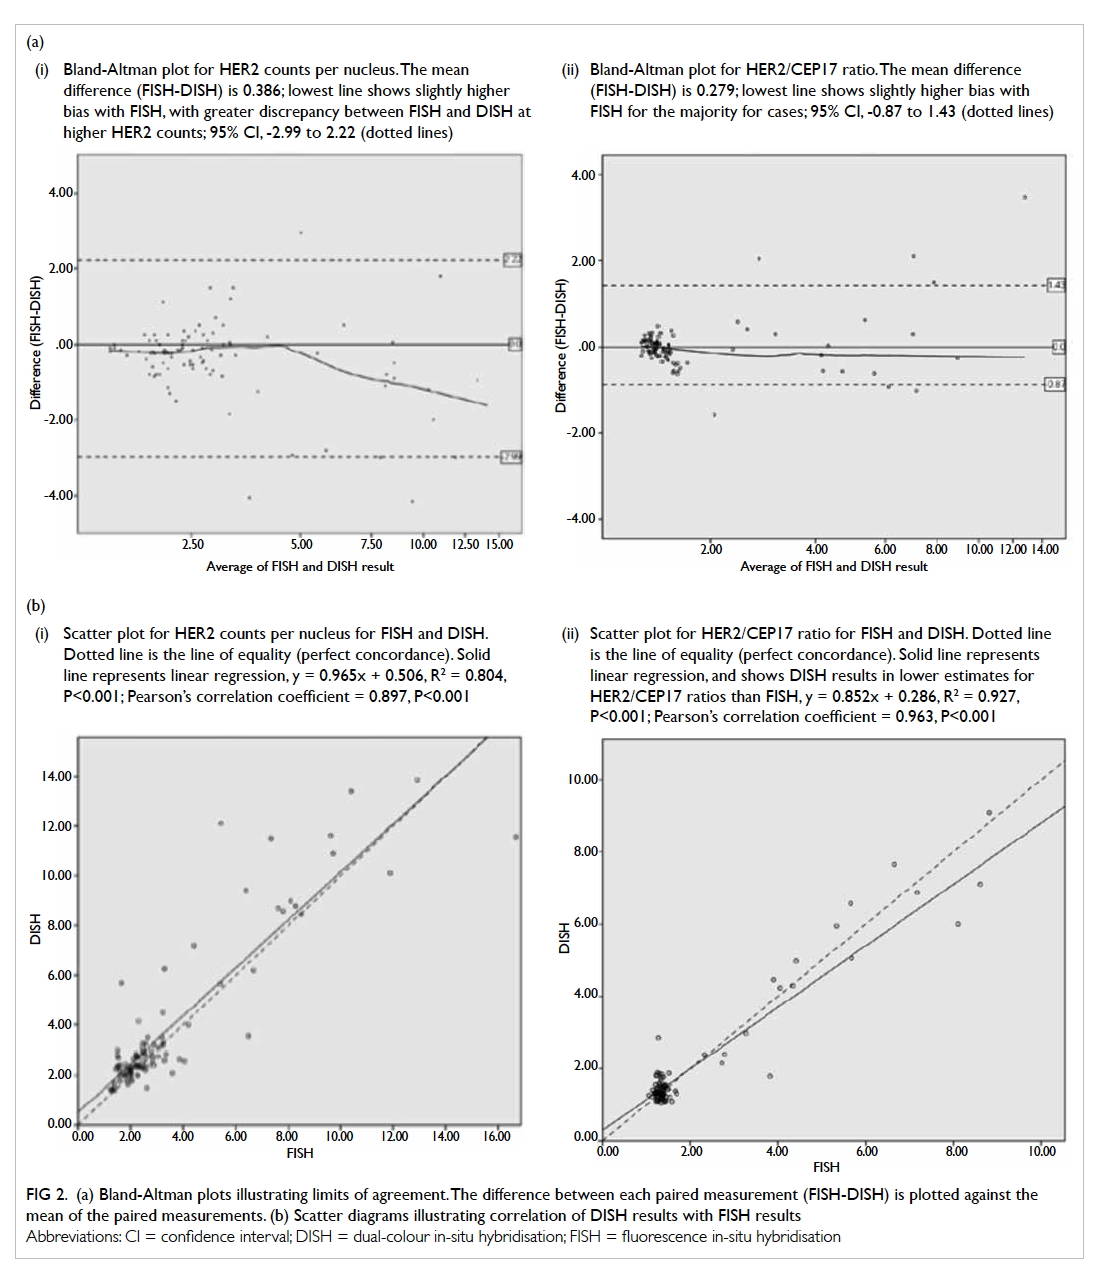
Figure 2.
(a) Bland-Altman plots illustrating limits of agreement. The difference between each paired measurement (FISH-DISH) is plotted against the mean of the paired measurements. (i) Bland-Altman plot for HER2 counts per nucleus. The mean difference (FISH-DISH) is 0.386; lowest line shows slightly higher bias with FISH, with greater discrepancy between FISH and DISH at higher HER2 counts; 95% CI, -2.99 to 2.22 (dotted lines). (ii) Bland-Altman plot for HER2/CEP17 ratio. The mean difference (FISH-DISH) is 0.279; lowest line shows slightly higher bias with FISH for the majority for cases; 95% CI, -0.87 to 1.43 (dotted lines).
(b) Scatter diagrams illustrating correlation of DISH results with FISH results. (i) Scatter plot for HER2 counts per nucleus for FISH and DISH. Dotted line is the line of equality (perfect concordance). Solid line represents linear regression, y = 0.965x + 0.506, R2 = 0.804, P<0.001; Pearson’s correlation coefficient = 0.897, P<0.001. (ii) Scatter plot for HER2/CEP17 ratio for FISH and DISH. Dotted line is the line of equality (perfect concordance). Solid line represents linear regression, and shows DISH results in lower estimates for HER2/CEP17 ratios than FISH, y = 0.852x + 0.286, R2 = 0.927, P<0.001; Pearson’s correlation coefficient = 0.963, P<0.001
Linear regression and Pearson’s correlation
between the two in-situ hybridisation assays
Scatter diagrams of DISH plotted against FISH results
are shown in Figure 2b. Linear regression showed that
DISH resulted in a lower HER2/CEP17 ratio than
FISH, the tendency being more obvious at a higher
ratio. Pearson’s correlation coefficient was 0.897 (95%
CI, 0.84-0.95, P<0.001) for mean HER2 copies per
nucleus and 0.963 (95% CI, 0.95-0.98, P<0.001) for
HER2/CEP17 ratio. This indicated the correlation
was excellent.
Kappa’s agreement between amplification
status results by the two in-situ hybridisation
assays
The result of amplification status by DISH and FISH
is shown in Table 3. Overall agreement of FISH and
DISH was 96.0% (95 out of 99 cases), and Cohen’s
Kappa coefficient was 0.882 (95% CI, 0.77-0.99,
P<0.001), which indicates good agreement. Results
for IHC 0/1+ and 3+ cases showed 100% concordance
between FISH and DISH. All discordant cases
belonged to the IHC 2+ category and details of the
cases are shown in Table 4. It is interesting to note
that three of these four discordant cases were in the
equivocal category for either FISH or DISH.
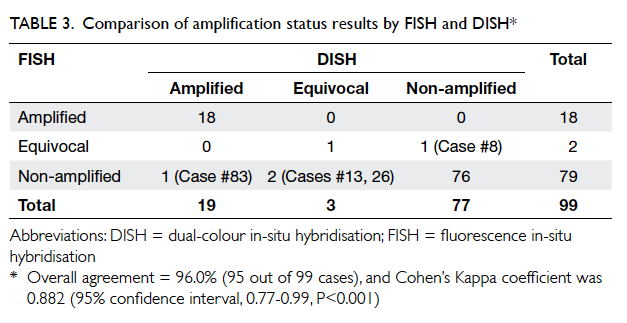
Table 3. Comparison of amplification status results by FISH and DISH
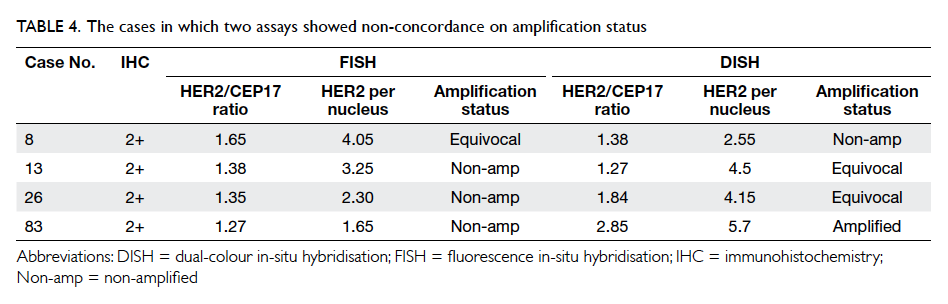
Table 4. The cases in which two assays showed non-concordance on amplification status
Discussion
It is important to develop an accurate test for
HER2 status in breast cancer so that patients can
receive optimal treatment. A false-negative result
may lead to delay or omission of HER2 targeting
treatment. A false-positive one, however, may result
in unnecessary treatment for the patient. This is
particularly important because HER2 targeting
drugs are known to cause rare but significant
adverse effects, including serious cardiotoxicity.10 In
addition, the cost of treatment is high and may be a
financial burden for patients.
Various methods have been developed
for HER2 testing. The ASCO/CAP guidelines
recommend HER2 testing by IHC and ISH methods.
Each has their own advantages and disadvantages.
The advantages of IHC include its high
specificity, relatively low price, and short turnaround
time. Further, the immunostain does not degrade over
time. Its sensitivity is variable, however, and affected
significantly by pre-analytic, analytic, and post-analytic
factors.2 11 22 Tissue fixation factors, such
as ethanol exposure and antigen retrieval methods,
can lead to inaccurate IHC results.11 In an ideal
setting, tissue for IHC should be fixed in 10% neutral
buffered formalin for 6 to 48 hours,9 but in practice
it is not uncommon for insufficient formalin to be
used or for time-to-fixation to be often prolonged.11
There may also be scoring error. Although the use
of controls can reduce interobserver variability, it
cannot be eliminated.22
The general advantage of ISH methods
compared with IHC is that ISH may be accurately
performed on tissues fixed for variable lengths of
time and in other fixatives.11 In addition, ISH can
also be applied to a wide range of tissue samples,
such as paraffin-embedded tissue, frozen samples,
or micro-tissue arrays.2 Nonetheless, the different
types of ISH also have their respective shortcomings.
The disadvantage for FISH is that, first, it
is not possible to identify cell morphology and
other histological features because it is visualised
under fluorescence microscopy. Second, since the
fluorescence of the probe will decay with time,
samples cannot be archived.2 This makes it difficult
for future retrieval and for re-examination. Third,
sample preparation is complex and usually takes at
least 2 days.
On the other hand, DISH makes use of bright-field
microscopy that allows better delineation of
cell morphology, tumour heterogeneity, and easier
identification of tumour cells.2 Also, automation
is possible so complexity and time required for
sample preparation can be reduced. The DISH assay,
however, is not perfect. One of its disadvantages is
that analysis may sometimes fail. In our experience,
the failure rate for DISH is somewhat higher than
that for FISH. To date, there remain few studies
published on the accuracy of DISH compared with
FISH or IHC.17 18 19 20
This study provides more information about concordance
of DISH and FISH, and is the first report
from Hong Kong. In our study, FISH and DISH
showed no statistical difference for HER2/CEP17
ratio and HER2 counts per nucleus. Correlation
between the values was high. Pearson’s correlation
coefficient in our study was 0.963 for
HER2/CEP17 ratio, and 0.897 for mean HER2
copies per nucleus. This is similar to the values
reported by other studies, ranging from 0.79 to 0.81
by Gao et al17 and 0.85 to 0.87 by Horii et al.18 This
indicates that DISH consistently correlates well with
FISH for quantitative results. Our study also showed
that FISH and DISH had a high level of agreement
in classifying HER2 gene amplification status. Bland-Altman plot showed good agreement between
FISH and DISH. Agreement was less at a higher
HER2/CEP17 ratio, and DISH tended to underestimate
the result. This is similar to the findings by
Mansfield et al.20 Cohen’s Kappa coefficient in our
study was 0.882. Reports by other studies vary, from
>0.9 in the study by Horii et al18 in which only 48%
of cases studied were of the equivocal IHC category,
to 0.58 by Mansfield et al20 who focused on samples
enriched for difficult-to-assess HER2 anomalies.
For our case series, the failure rate of FISH was
0.96%. This is consistent with failure rates reported
in the literature that range from <1% to 8.4%.11 17 18 20
The failure rate for DISH in our case series was
3.85%, which is slightly higher than the reported
failure rate of 0% to 2.8% in previous studies.17 18 20
This may be explained by the fact that most cases in
our series were of IHC 2+ category, which is the most
challenging group of cases. It is worth noting that in
all cases wherein FISH or DISH analysis failed, when
one test failed, the other gave useful information
on HER2 gene amplification status. Therefore the
availability of both FISH and DISH assay allows one
test to be used as an alternative, when the other fails.
The number of cases in our study was relatively
small compared with other published studies,17 18 20
with only 83 consecutive cases of equivocal IHC
cases within a given time period. Although it may
be argued that the further 21 cases added in the
IHC-positive or -negative category may constitute
sampling bias, re-analysis of the data excluding these
cases made no significant difference to the findings.
Moreover, these 21 cases demonstrated 100%
concordance between FISH and DISH, supporting
the robustness of both tests in straightforward cases.
Indeed, of the four discordant cases between FISH
and DISH, three were of the equivocal category by
FISH or by DISH by the updated ASCO/CAP 2013
guidelines, but had given concordant non-amplified
results both by FISH and by DISH using the earlier
ASCO/CAP 2007 guidelines.
Another limitation of our study was that
it was not prospective: only raw data of signal
enumeration for FISH testing previously performed
were available. The statistical analysis was based on
reclassification of cases according to new ASCO/CAP 2013 guidelines. Although the FISH and DISH
slides were interpreted by different personnel,
with the possibility of interobserver variability, the
concordance between the two assays was very good.
Conclusions
Our study confirms that the determination of HER2
gene amplification status by DISH correlates well
with that by FISH. In our laboratory, DISH would
be a reliable and useful option for HER2 testing in
breast cancer. Having both FISH and DISH assay
available for service could help reduce the number
of failed cases.
Acknowledgements
This study was supported by the SK Yee Medical
Foundation (project number: 213218).
References
1. Cancer Registry 2011. Hospital Authority, Hong Kong.
Available from: http://www3.ha.org.hk/cancereg/rank_2011.pdf. Accessed Oct 2015.
2. Gutierrez C, Schiff R. HER2: biology, detection, and clinical
implications. Arch Pathol Lab Med 2011;135:55-62.
3. Konecny G, Pauletti G, Pegram M, et al. Quantitative
association between HER-2/neu and steroid hormone
receptors in hormone receptor-positive primary breast
cancer. J Natl Cancer Inst 2003;95:142-53. Crossref
4. Ménard S, Valagussa P, Pilotti S, et al. Response to
cyclophosphamide, methotrexate, and fluorouracil in
lymph node–positive breast cancer according to HER2
overexpression and other tumor biologic variables. J Clin
Oncol 2001;19:329-35.
5. Joensuu H, Kellokumpu-Lehtinen PL, Bono P, et al.
Adjuvant docetaxel or vinorelbine with or without
trastuzumab for breast cancer. N Engl J Med 2006;354:809-20. Crossref
6. Piccart-Gebhart MJ, Procter M, Leyland-Jones B, et al.
Trastuzumab after adjuvant chemotherapy in HER2-positive breast cancer. N Engl J Med 2005;353:1659-72. Crossref
7. Slamon DJ, Leyland-Jones B, Shak S, et al. Use of
chemotherapy plus a monoclonal antibody against HER2
for metastatic breast cancer that overexpresses HER2. N
Engl J Med 2001;344:783-92. Crossref
8. Valero V, Forbes J, Pegram MD, et al. Multicenter phase
III randomized trial comparing docetaxel and trastuzumab
with docetaxel, carboplatin, and trastuzumab as first-line
chemotherapy for patients with HER2-gene-amplified
metastatic breast cancer (BCIRG 007 study): two highly
active therapeutic regimens. J Clin Oncol 2011;29:149-56. Crossref
9. Wolff AC, Hammond ME, Hicks DG, et al.
Recommendations for human epidermal growth factor
receptor 2 testing in breast cancer: American Society
of Clinical Oncology/College of American Pathologists
clinical practice guideline update. J Clin Oncol
2013;31:3997-4013. Crossref
10. Wolff AC, Hammond ME, Schwartz JN, et al. American
Society of Clinical Oncology/College of American
Pathologists guideline recommendations for human
epidermal growth factor receptor 2 testing in breast cancer.
J Clin Oncol 2007;25:118-45. Crossref
11. Sauter G, Lee J, Bartlett JM, Slamon DJ, Press MF.
Guidelines for human epidermal growth factor receptor 2
testing: biologic and methodologic considerations. J Clin
Oncol 2009;27:1323-33. Crossref
12. Yaziji H, Goldstein LC, Barry TS, et al. HER-2 testing in
breast cancer using parallel tissue-based methods. JAMA
2004;291:1972-7. Crossref
13. Slamon DJ, Godolphin W, Jones LA, et al. Studies of the
HER-2/neu proto-oncogene in human breast and ovarian
cancer. Science 1989;244:707-12. Crossref
14. Slamon DJ, Clark GM, Wong SG, Levin WJ, Ullrich
A, McGuire WL. Human breast cancer: correlation of
relapse and survival with amplification of the HER-2/neu
oncogene. Science 1987;235:177-82. Crossref
15. Owens MA, Horten BC, Da Silva MM. HER2 amplification
ratios by fluorescence in situ hybridization and correlation
with immunohistochemistry in a cohort of 6556 breast
cancer tissues. Clin Breast Cancer 2004;5:63-9. Crossref
16. INFORM HER2 Dual ISH DNA Probe Cocktail—P100027. Available from: http://www.accessdata.fda.gov/cdrh_docs/pdf10/P100027b.pdf. Accessed 6 Dec 2013.
17. Gao FF, Dabbs DJ, Cooper KL, Bhargava R. Bright-field
HER2 dual in situ hybridization (DISH) assay vs
fluorescence in situ hybridization (FISH): focused study
of immunohistochemical 2+ cases. Am J Clin Pathol
2014;141:102-10. Crossref
18. Horii R, Matsuura M, Iwase T, Ito Y, Akiyama F. Comparison
of dual-color in-situ hybridization and fluorescence in-situ
hybridization in HER2 gene amplification in breast cancer.
Breast Cancer 2014;21:598-604. Crossref
19. Koh YW, Lee HJ, Lee JW, Kang J, Gong G. Dual-color silver-enhanced
in situ hybridization for assessing HER2 gene
amplification in breast cancer. Mod Pathol 2011;24:794-800. Crossref
20. Mansfield AS, Sukov WR, Eckel-Passow JE, et al.
Comparison of fluorescence in situ hybridization (FISH)
and dual-ISH (DISH) in the determination of HER2 status
in breast cancer. Am J Clin Pathol 2013;139:144-50. Crossref
21. Yau TK, Sze H, Soong IS, Hioe F, Khoo US, Lee AW. HER2
overexpression of breast cancers in Hong Kong: prevalence
and concordance between immunohistochemistry and
in-situ hybridisation assays. Hong Kong Med J 2008;14:130-5.
22. Perez EA, Cortés J, Gonzalez-Angulo AM, Bartlett JM.
HER2 testing: current status and future directions. Cancer
Treat Rev 2014;40:276-84. Crossref