A prospective interventional study to examine the effect of a silver alloy and hydrogel-coated catheter on the incidence of catheter-associated urinary tract infection
Hong Kong Med J 2017 Jun;23(3):239–45 | Epub 17 Feb 2017
DOI: 10.12809/hkmj164906
© Hong Kong Academy of Medicine. CC BY-NC-ND 4.0
ORIGINAL ARTICLE
A prospective interventional study to examine
the effect of a silver alloy and hydrogel–coated
catheter on the incidence of catheter-associated
urinary tract infection
Patrick HY Chung, FRCSEd(Paed), FHKAM (Surgery)1;
Carol WY Wong, MB, BS, MRCSEd1;
Christopher KC Lai, MB, ChB, FRCPath2;
HK Siu, BSc (Statistics), MPhil (CUHK)3;
Dominic NC Tsang, MB, BS, FRCPath2,3;
KY Yeung, MNurs, BNurs4;
Dennis KM Ip, MB, BS, MPhil(Epidemiology)(Cantab)5;
Paul KH Tam, FRCS (Edin, Glasg, Irel), FHKAM (Surgery)1
1 Department of Surgery, Li Ka Shing Faculty of Medicine, The University
of Hong Kong, Pokfulam, Hong Kong
2 Department of Pathology, Queen Elizabeth Hospital, Jordan, Hong Kong
3 Chief Infection Control Officer’s Office, Hospital Authority, Hong Kong
4 Infection Control Team, Central Nursing Department, Kowloon Hospital,
Argyle Street, Hong Kong
5 School of Public Health, Li Ka Shing Faculty of Medicine, The University
of Hong Kong, Pokfulam, Hong Kong
Corresponding author: Dr Christopher KC Lai (laikcc@ha.org.hk)
 Full
paper in PDF
Full
paper in PDF
Abstract
Introduction: Catheter-associated urinary tract
infection is a major hospital-acquired infection. This
study aimed to analyse the effect of a silver alloy
and hydrogel–coated catheter on the occurrence of
catheter-associated urinary tract infection.
Methods: This was a 1-year prospective study
conducted at a single centre in Hong Kong. Adult
patients with an indwelling urinary catheter for
longer than 24 hours were recruited. The incidence
of catheter-associated urinary tract infection in
patients with a conventional latex Foley catheter
without hydrogel was compared with that in patients
with a silver alloy and hydrogel–coated catheter. The
most recent definition of urinary tract infection was
based on the latest surveillance definition of the
National Healthcare Safety Network managed by
Centers for Disease Control and Prevention.
Results: A total of 306 patients were recruited with
a similar ratio between males and females. The
mean (standard deviation) age was 81.1 (10.5) years.
The total numbers of catheter-days were 4352 and
7474 in the silver-coated and conventional groups,
respectively. The incidences of catheter-associated
urinary tract infection per 1000 catheter-days were
6.4 and 9.4, respectively (P=0.095). There was a 31%
reduction in the incidence of catheter-associated
urinary tract infection per 1000 catheter-days in the silver-coated group.
Escherichia coli was the most commonly involved
pathogen (36.7%) of all cases. Subgroup analysis
revealed that the protective effect of silver-coated
catheter was more pronounced in long-term users
as well as female patients with a respective 48%
(P=0.027) and 42% (P=0.108) reduction in incidence
of catheter-associated urinary tract infection. The
mean catheterisation time per person was the longest
in patients using a silver-coated catheter (17.0 days)
compared with those using a conventional (10.8
days) or both types of catheter (13.6 days) [P=0.01].
Conclusions: Silver alloy and hydrogel–coated
catheters appear to be effective in preventing
catheter-associated urinary tract infection based
on the latest surveillance definition. The effect is
perhaps more prominent in long-term users and
female patients.
New knowledge added by this study
- The use of a silver alloy and hydrogel–coated (SAH) catheter has the potential to reduce catheter-associated urinary tract infection (CA-UTI), especially in certain subgroups of patients (long-term users and female patients).
- The use of a SAH catheter potentially reduces the incidence of CA-UTI. This will lead to less morbidity and medical costs associated with CA-UTI.
- This study provides pilot data for future research.
Introduction
Catheter-associated urinary tract infection (CA-UTI) is a major cause of hospital-acquired infection,
with local data showing 4.9 infections per 1000
catheter-days.1 Internationally, an estimated 900 000
nosocomial UTIs occur every year, prolonging the
mean duration of hospital stay by 1 to 3.8 days. It
has been estimated that approximately 80% of UTIs
are related to the presence of an indwelling urinary
catheter. In severe cases, these infections may lead
to bacteraemia, urosepsis, and even mortality.2 3 A
case-control study also suggested that patients with
CA-UTI had excess costs of US$3803 compared with
patients without infection.4 Therefore, by prevention
of CA-UTI, a significant reduction in morbidity
and mortality, as well as the health care economic
burden, can be anticipated.
Bactiguard-coated Foley catheters (Bactiguard,
Sweden) were approved by the US Food and Drug
Administration in 1994. These catheters have a stable
noble metal alloy and hydrogel coating (also referred
to as silver alloy and hydrogel–coated, SAH) on the
outer- and inner-luminal surfaces of the catheter,
providing repellent and anti-infective properties by
preventing the formation of microbial biofilm. The
coating consists of gold, silver and palladium, and
also preserves the urethral mucosal integrity and
helps to avoid the onset of inflammation. Previous
studies of CA-UTI prevention had asymptomatic
bacteriuria (ASB) alone or in combination with
symptomatic UTI as the endpoint so their clinical
relevance was called into question. We conducted
a prospective, interventional study to provide
additional data on the effectiveness of the noble
metal alloy urinary catheter in the prevention of
CA-UTI, using the updated surveillance definition
of National Healthcare Safety Network (NHSN)
managed by the Centers for Disease Control and
Prevention (CDC). This surveillance definition
was adopted in 2009 and modified the criteria for
symptomatic infection, as well as adding a category
and definition for asymptomatic bacteraemic UTI
together with the removal of ASB completely.5 To
study the effect on ASB, we adopted the criteria
used in the Infectious Diseases Society of America
practice guideline developed in 2009.6
Methods
This single-centre 1-year prospective study was
completed in 2012 in a regional rehabilitation
hospital in Hong Kong. The study population was
in-patients in two medical rehabilitation wards. All
patients over 18 years of age on either of the wards
during the study period with an indwelling catheter
for longer than 24 hours were recruited after
giving informed consent. Patients who underwent
suprapubic catheterisation, single in-and-out
catheterisation for collection of a urine specimen,
intermittent catheterisation for urine drainage,
catheterisation for less than 24 hours, or who were
catheterised with a silicone Foley catheter, and those
who had been treated with antibiotics for a UTI were
excluded from the study. Both of the study wards
rotated through the two different interventions in
two 6-month periods in order to act as a self-control
to minimise the potential problem of variability
in medical and nursing practice that might affect
the outcomes. Conventional latex Foley catheters
without hydrogel (sized Fr 12, 14, and 16) were used
for catheterisation on both wards during the first
half of the study period; SAH catheters (sized Fr
12, 14, and 16) were used during the second half of
the study period. If a catheter was changed due to
the presence of infection, the appropriate catheter
according to the month of the study was used. Thus
it was possible for patients who required a catheter
for a long time and underwent catheter exchange to
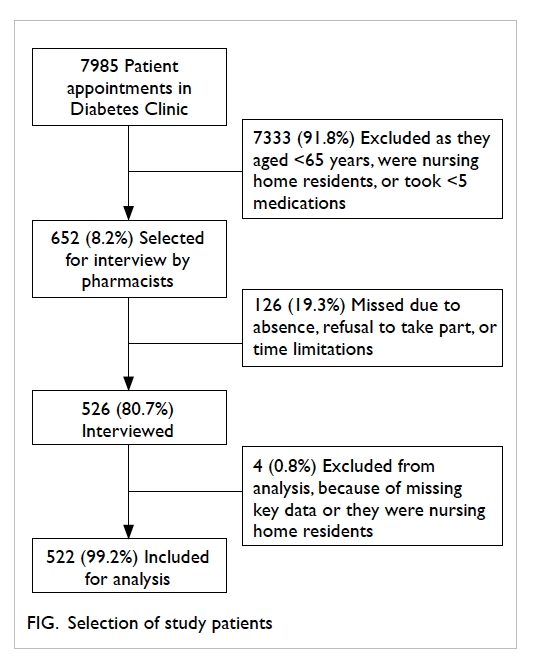
be exposed to both types of urinary catheter (Fig 1).
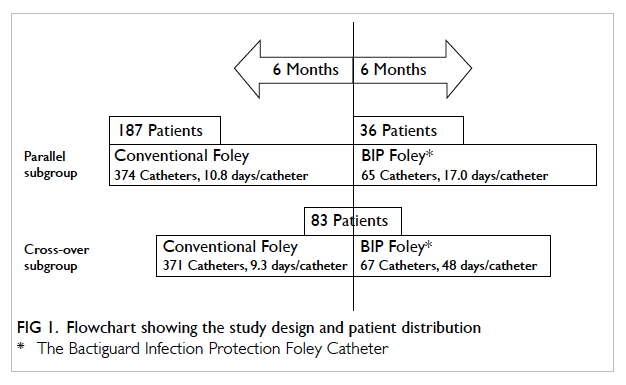
Figure 1. Flowchart showing the study design and patient distribution
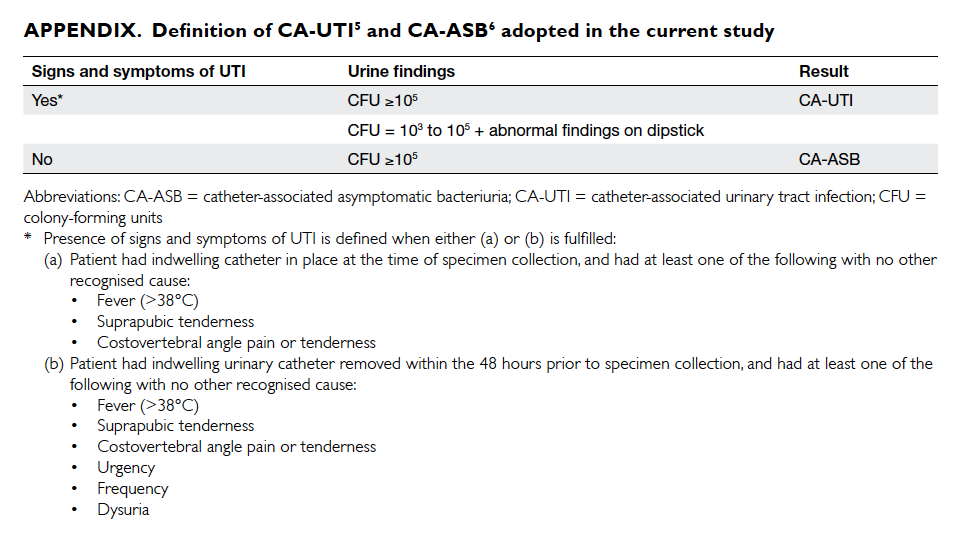
The definition of CA-UTI was adopted
and modified from the CDC/NHSN definition of
symptomatic UTI (Appendix5 6). Routine, regular
screening and clinical urine samples were collected
from all subjects according to the hospital protocol.
Routine urine samples were taken from all subjects
at four fixed time-points: on admission, on
catheterisation, before removal of the catheter, and
before hospital discharge. Screening samples were
taken weekly. Clinical samples were taken whenever
a patient demonstrated symptoms and signs of
UTI, or as part of a sepsis workup. The incidence
of CA-UTI in the two groups was analysed in terms
of the absolute number of CA-UTI episodes and
the number of CA-UTI episodes per 1000 catheter-days.
Values were expressed as mean ± standard
deviation. Comparison between the two groups was
performed by Pearson’s Chi squared test, Student’s
t test, and one-way analysis of variance test when
appropriate with a two-sided significance level of
0.05. The rate ratio of CA-ASB and CA-UTI between
the two groups was compared by exact Poisson test
for rate ratio. The occurrence of CA-UTI between
the two groups was also analysed with Kaplan-Meier
analysis. Results were analysed using the Statistical
Package for the Social Sciences (Windows version
21.0; SPSS Inc, Armonk [NY], US) and R version
3.1.2.
This study was done in accordance with the principles outlined in the Declaration of Helsinki.
Results
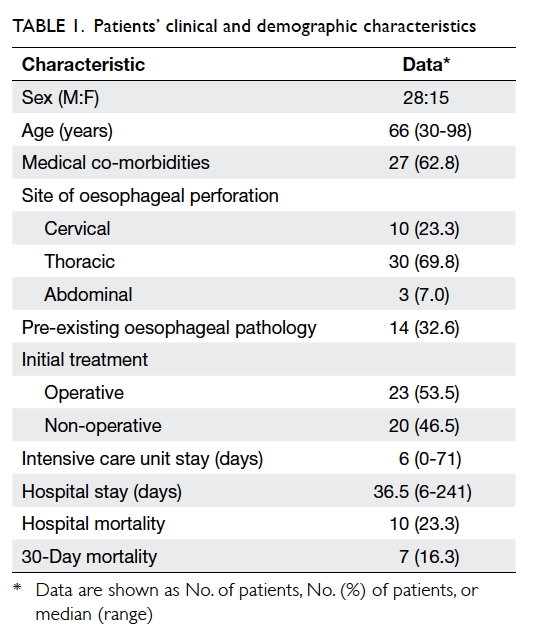
During the 1-year study period, 306 patients were
recruited. The male-to-female ratio was 1:1.13 and
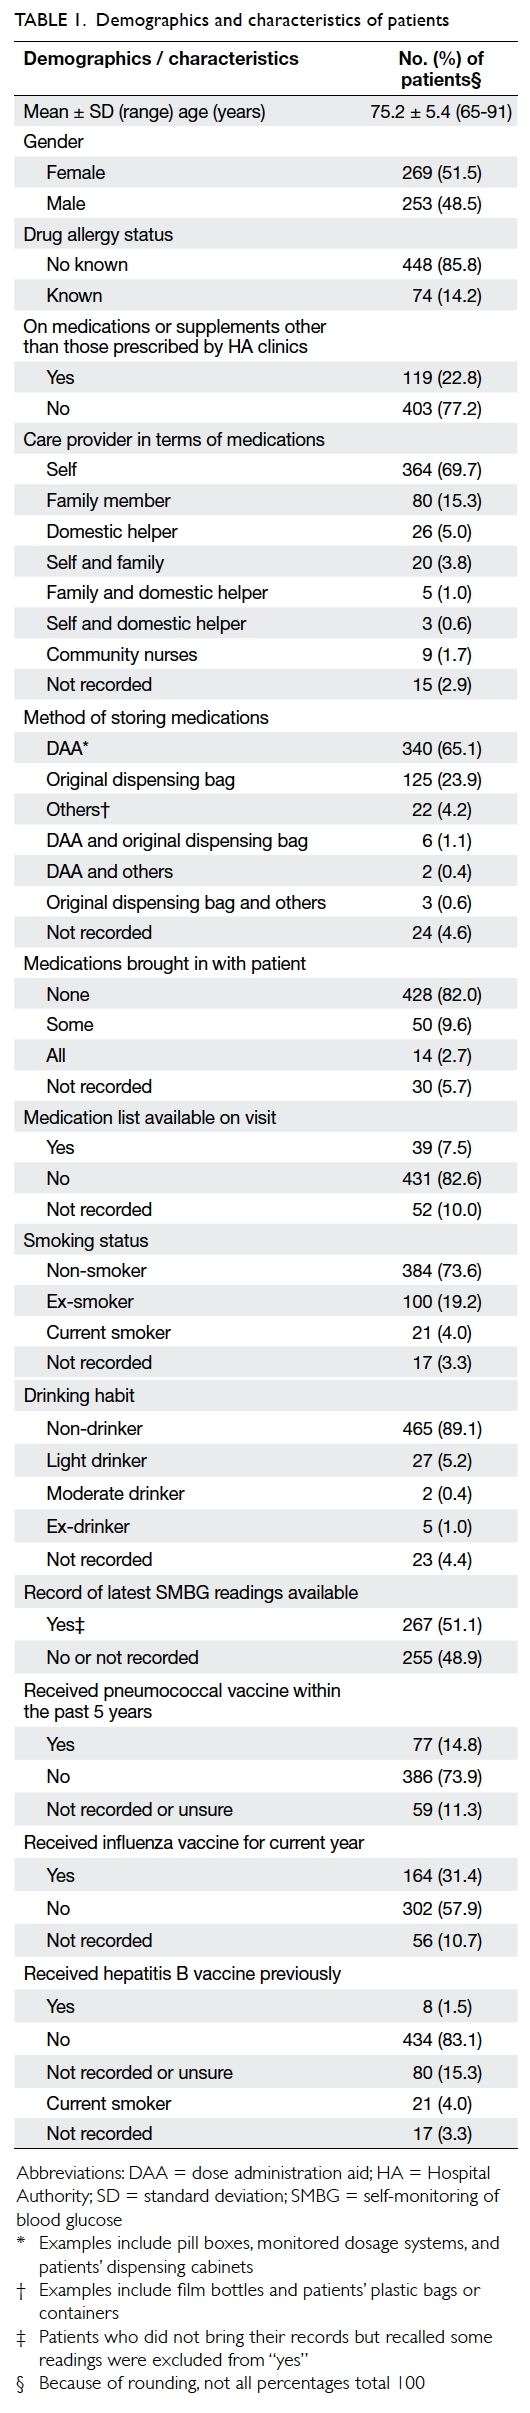
the mean age was 81.1 ± 10.5 years (Table 1). Overall,
187 patients used a conventional catheter only, 36
patients used a SAH catheter only, and 83 patients
used both a conventional and a SAH catheter (Fig 1).
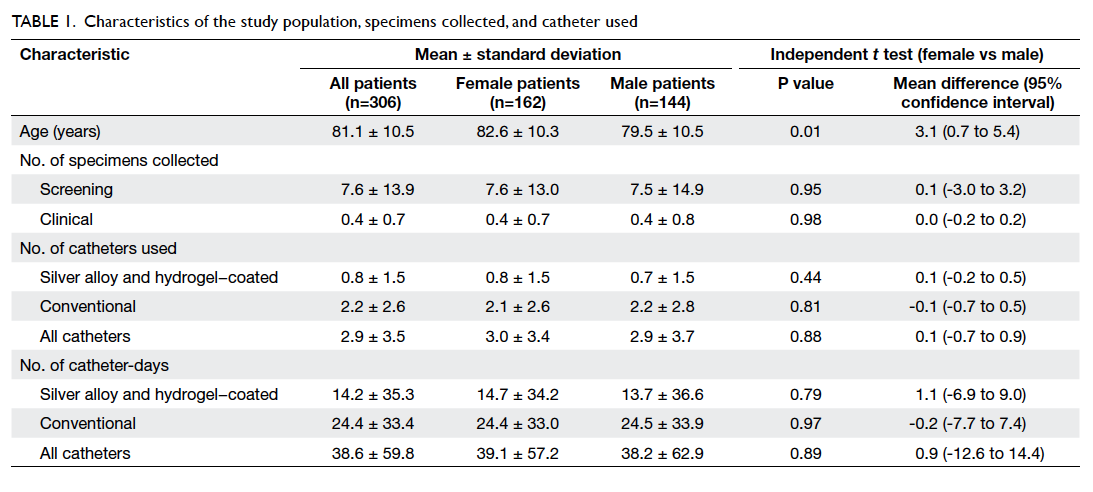
Table 1. Characteristics of the study population, specimens collected, and catheter used
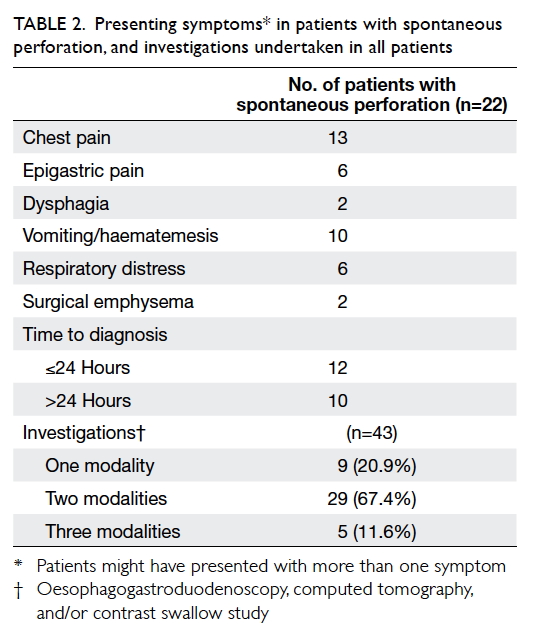
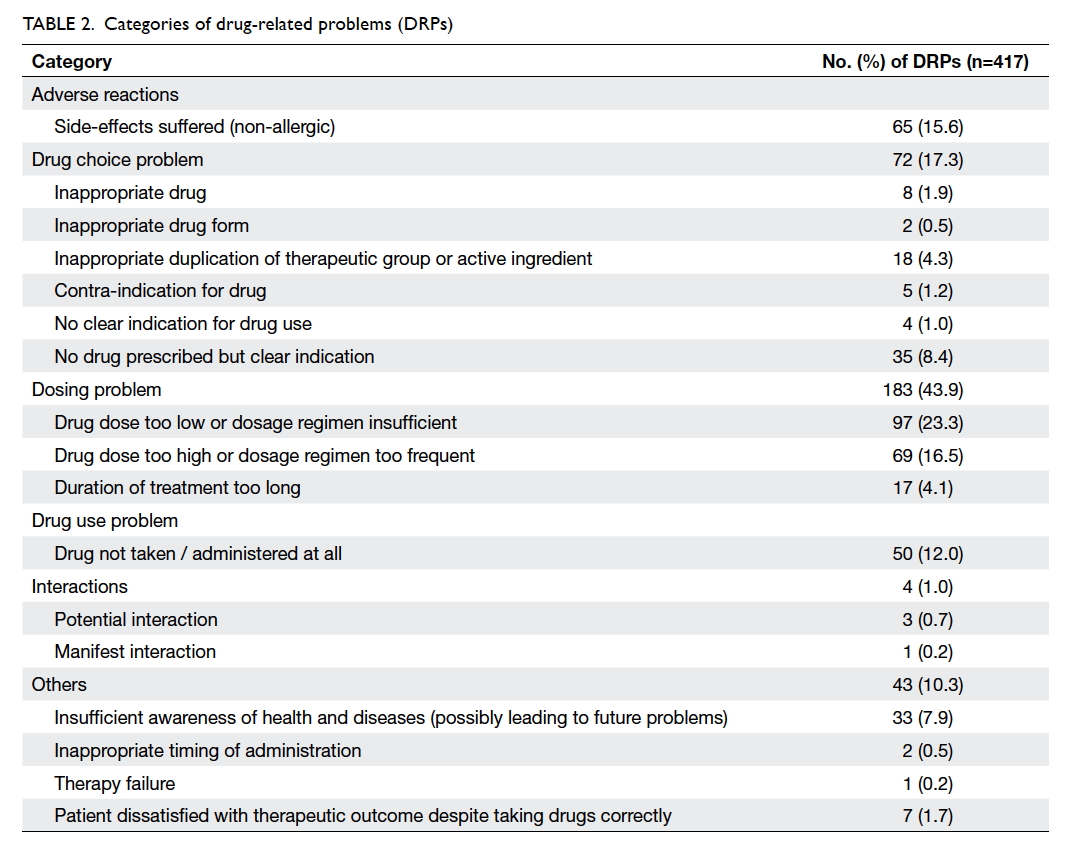
The total numbers of catheter-days were 4352
and 7474 in the SAH and conventional groups,
respectively. The numbers of CA-UTI episodes
were 28 and 70, respectively. Thus the incidences
of CA-UTI per 1000 catheter-days in the SAH and
conventional groups were 6.4 and 9.4, respectively
(P=0.095) with a rate ratio of 0.69 (95% confidence
interval [CI], 0.42-1.08). There was a 31% reduction in
CA-UTI incidence in the SAH group. Using Kaplan-Meier analysis and log-rank test, SAH catheter was
associated with a significantly lower rate of CA-UTI
(P=0.045; Fig 2). Regarding CA-ASB, the incidences
per 1000 catheter-days in the SAH and conventional
groups were 70.8 and 67.2, respectively (P=0.467)
with a rate ratio of 1.05 (95% CI, 0.91-1.22). Results
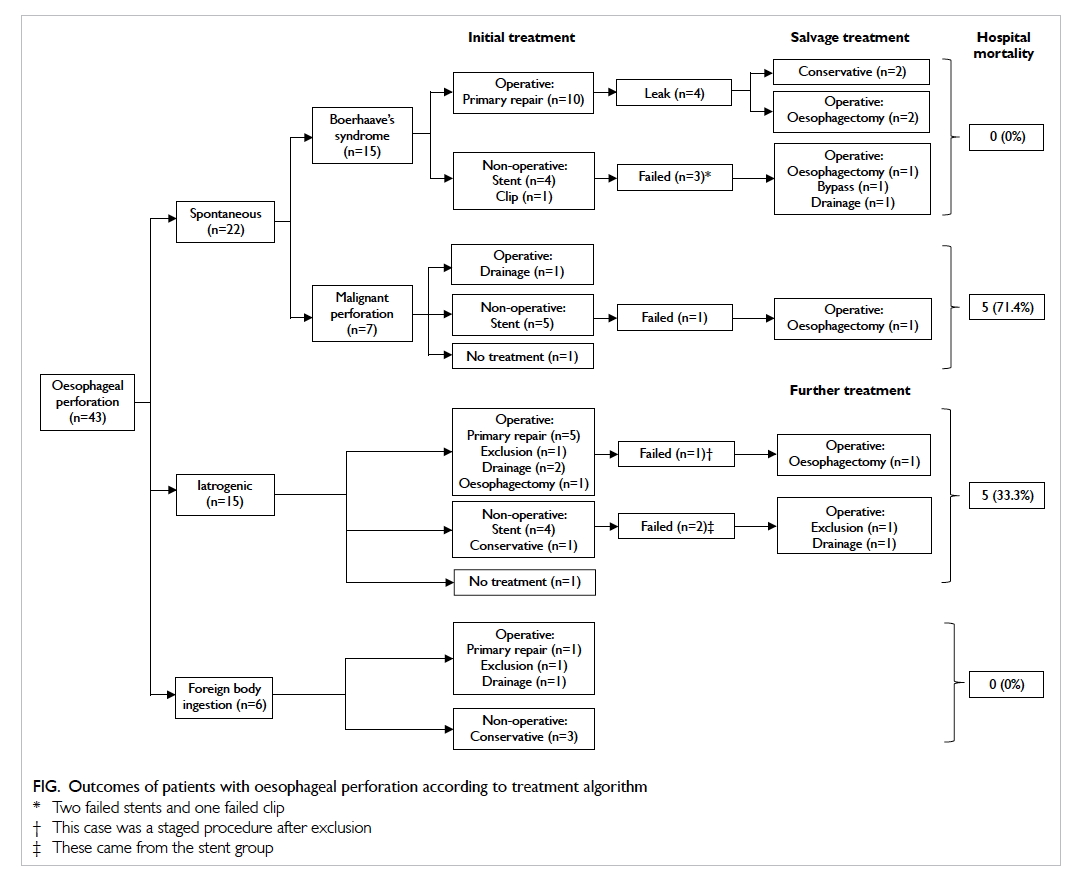
are summarised in Table 2. Blood cultures were
taken from patients who developed CA-UTI. In both
groups, none of the patients with CA-UTI developed
bacteraemia. Escherichia coli was the most commonly
involved urinary pathogen and accounted for 36.7%
of all cases, followed by Candida albicans (17.3%)
and Proteus mirabilis (14.3%) [Table 3]. The same
pathogens were observed in both groups.
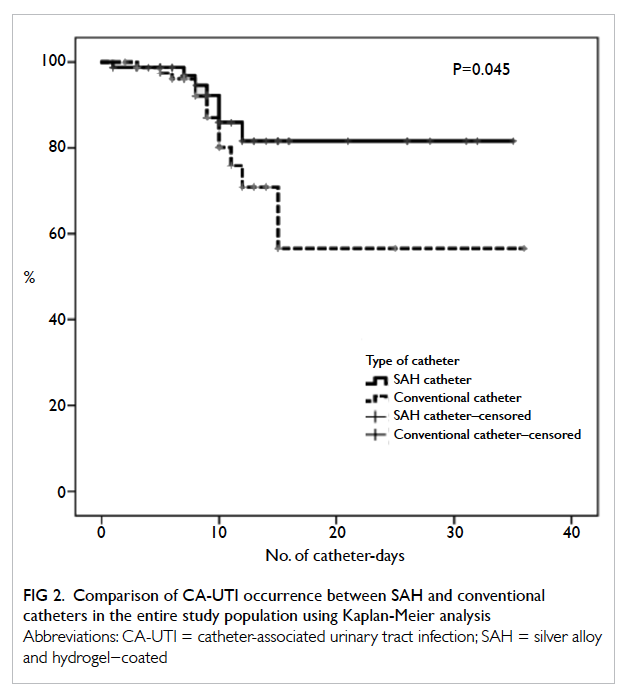
Figure 2. Comparison of CA-UTI occurrence between SAH and conventional catheters in the entire study population using Kaplan-Meier analysis
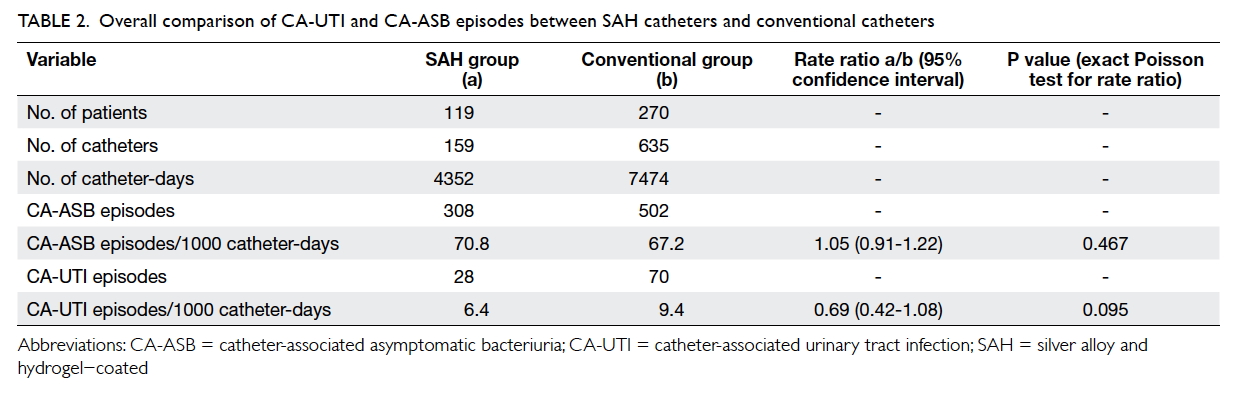
Table 2. Overall comparison of CA-UTI and CA-ASB episodes between SAH catheters and conventional catheters
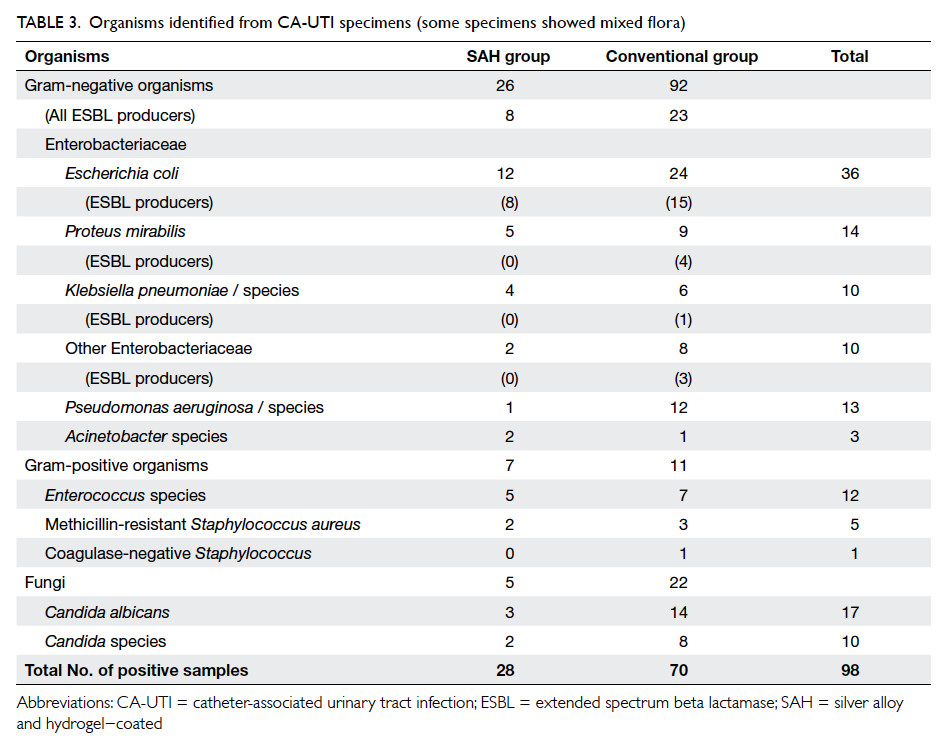
Table 3. Organisms identified from CA-UTI specimens (some specimens showed mixed flora)
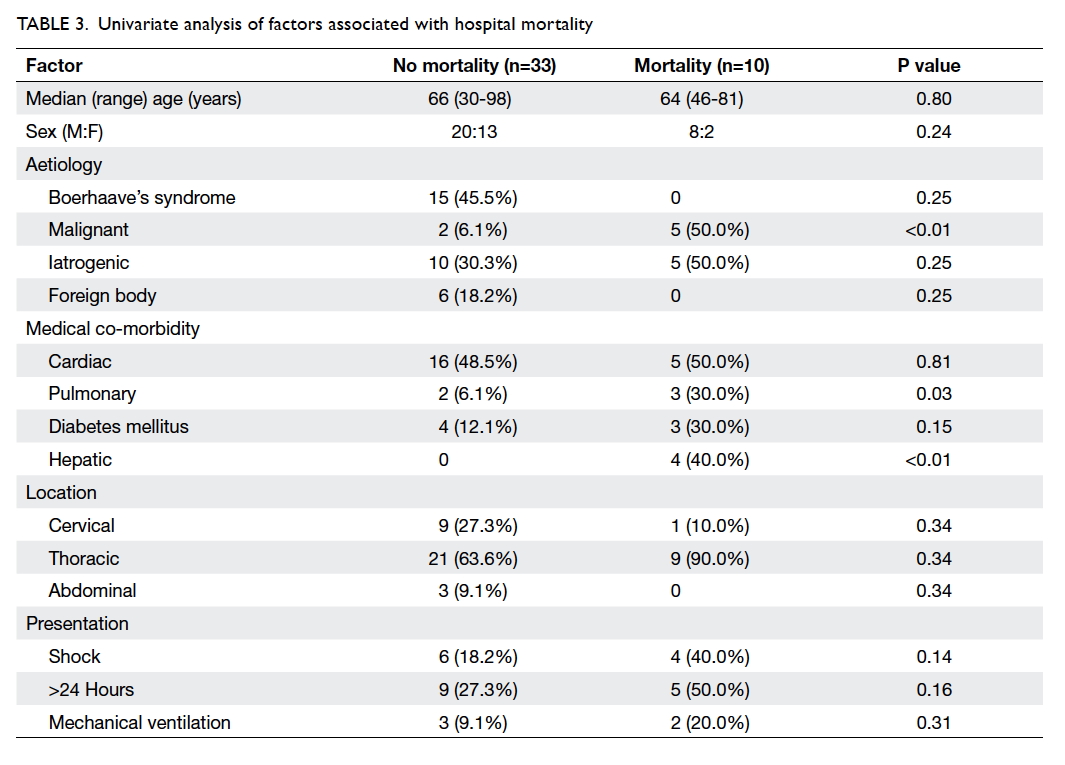
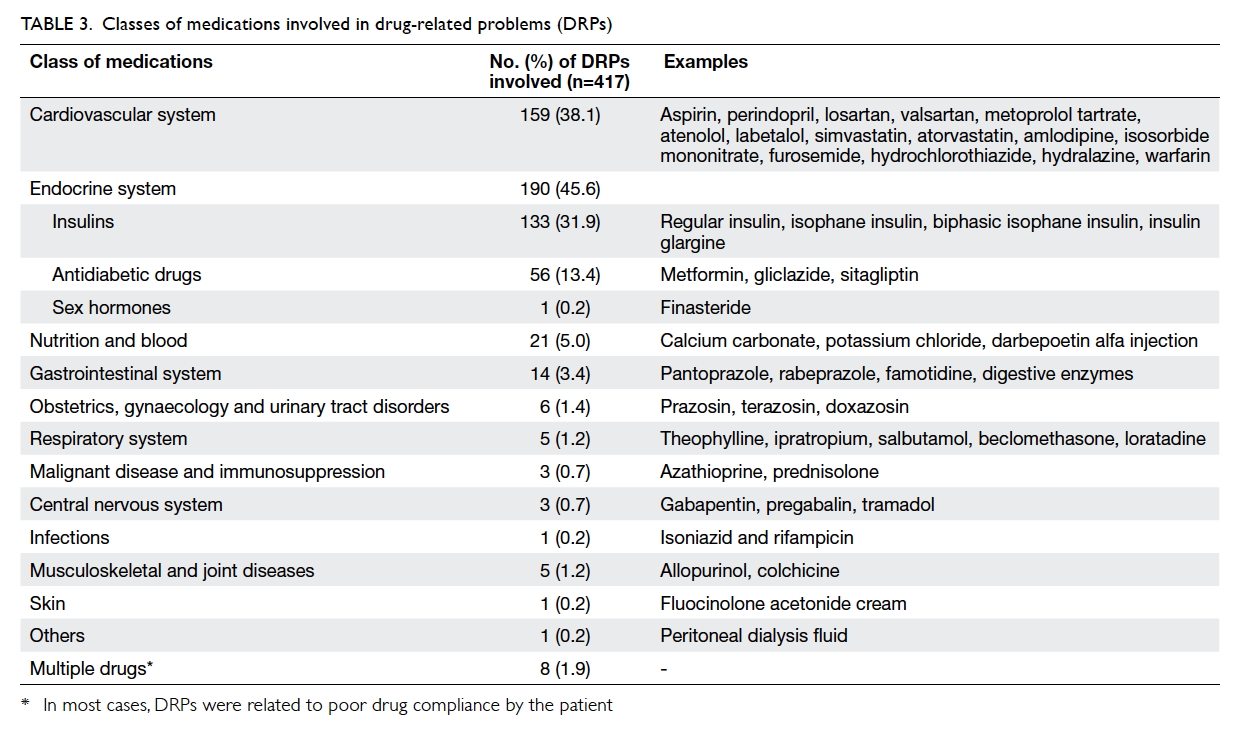
This study was not a randomised controlled
trial. Thus to eliminate patient selection bias, a
subgroup analysis was performed among those
patients who used both types of catheter (n=83).
These patients had more catheters used and more
catheter-days than those patients who used only one
type of catheter (Table 4a). This was due to study
design where longer-term users had a higher chance
of exposure to both types of urinary catheter. Among
them, the total numbers of catheter-days were 3210
and 3457 in the SAH and conventional groups,
respectively. The numbers of CA-UTI episodes were
17 and 35, respectively. This resulted in the incidences
of CA-UTI per 1000 catheter-days in the SAH and
conventional groups being 5.3 and 10.1, respectively
(P=0.027) with a rate ratio of 0.52 (95% CI, 0.27-0.96). There was a statistically significant reduction
of 48% in CA-UTI incidence in the SAH group (Table 4b). Because the catheters were exchanged when
an infection occurred, the CA-UTI reducing effect
resulted in less need to exchange a SAH catheter—the mean catheterisation time per person was 17.0
days for a SAH catheter compared with 10.8 days for
a conventional catheter and 13.6 days for patients
using both catheters (Table 4a).
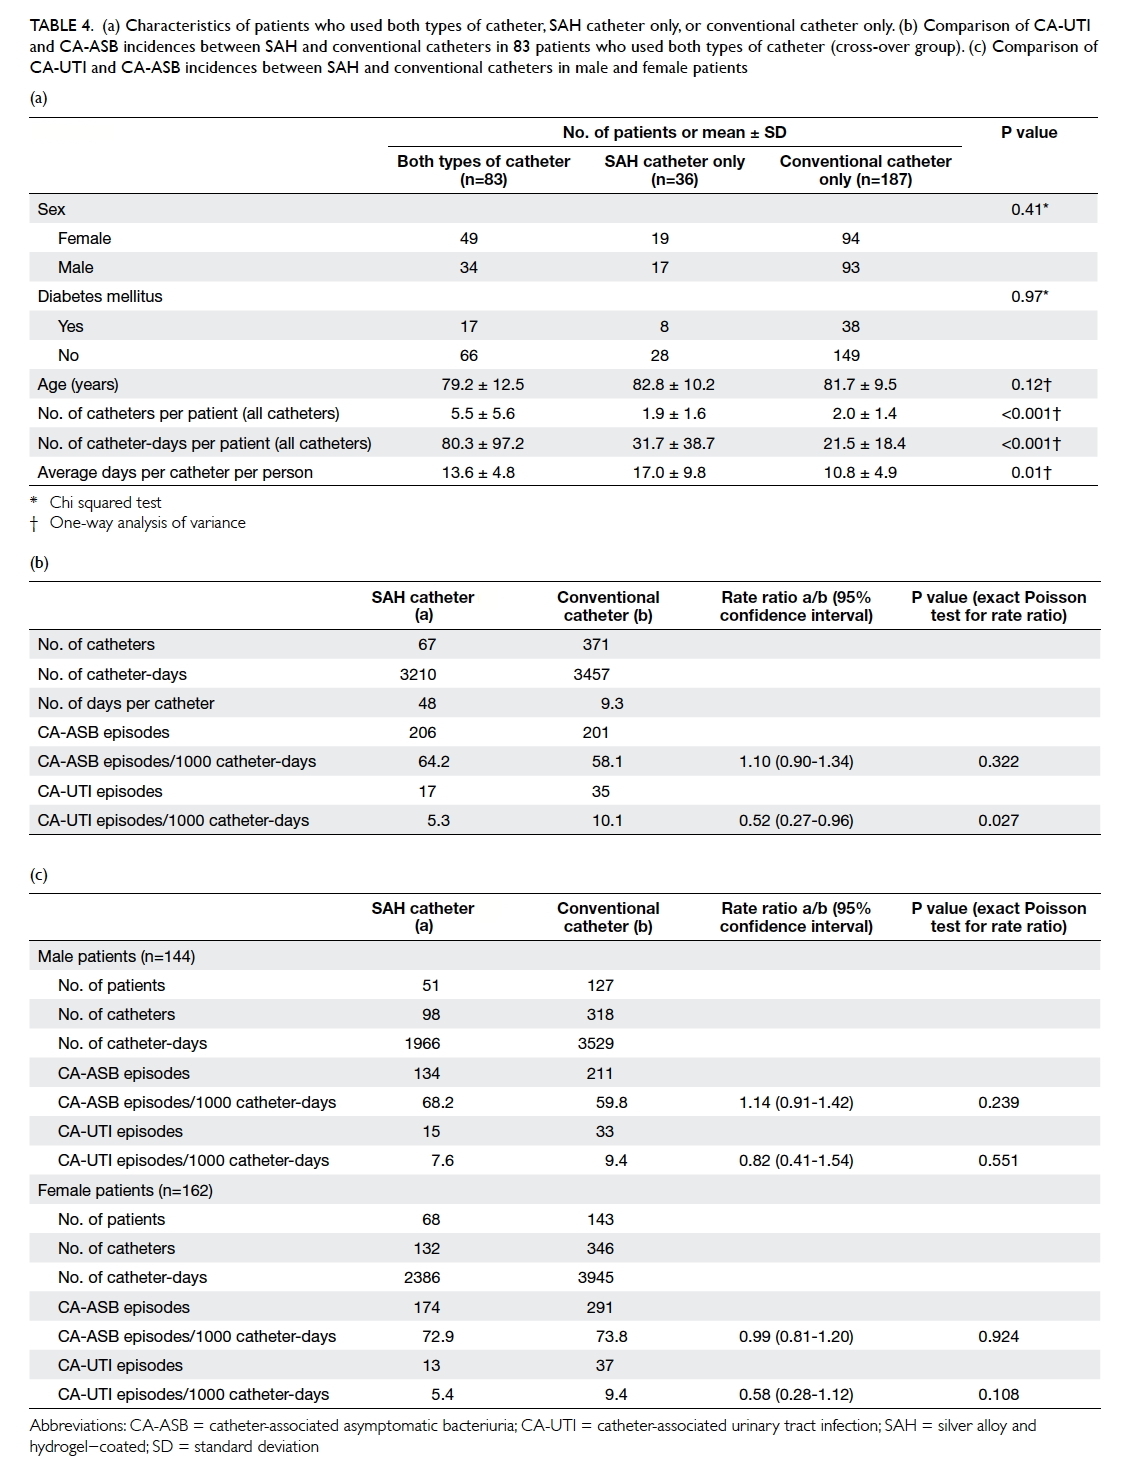
Table 4. (a) Characteristics of patients who used both types of catheter, SAH catheter only, or conventional catheter only. (b) Comparison of CA-UTI and CA-ASB incidences between SAH and conventional catheters in 83 patients who used both types of catheter (cross-over group). (c) Comparison of CA-UTI and CA-ASB incidences between SAH and conventional catheters in male and female patients
To examine the presence of outcome difference
in relation to gender in the entire study population,
we also performed a subgroup analysis based on
gender differences (Table 4c). In male patients (n=144), the number of CA-UTI episodes was 15 in
the SAH group (total catheter-days, 1966) and 33 in
the conventional group (total catheter-days, 3529).
The incidences of CA-UTI per 1000 catheter-days
in the SAH and conventional groups were 7.6 and
9.4, respectively (P=0.551) with a rate ratio of 0.82
(95% CI, 0.41-1.54). For female patients (n=162),
the number of CA-UTI episodes was 13 in the
SAH group (total catheter-days, 2386) and 37 in the
conventional group (total catheter-days, 3945). The
incidences of CA-UTI per 1000 catheter-days in
the SAH and conventional groups were 5.4 and 9.4,
respectively (P=0.108), with a rate ratio of 0.58 (95%
CI, 0.28-1.12).
Discussion
Urinary tract infection is one of the most commonly
encountered infections in daily clinical practice and
the majority of cases are catheter-related. Although
a number of clinical practices such as aseptic
technique for catheter insertion, closed drainage
systems, and shorter duration of catheterisation have
been introduced in an attempt to reduce the onset of
CA-UTI, the incidence remains high.3 7 Therefore,
research for strategies or new technologies to
prevent CA-UTI is still needed. Since the early
1990s, research has focused on different anti-infective
catheter-coating materials but results have
been generally inconclusive. Bactiguard-coated
Foley catheters, an essential noble metal (gold, silver,
and palladium) alloy and hydrogel–coated catheter,
have been introduced to slow bacterial colonisation.
In the early 2000s, a randomised cross-over
study by Karchmer et al8 demonstrated that the risk of
UTI could be decreased by 21% on wards and by 32%
among patients when a noble metal alloy catheter
was used instead of a conventional catheter. Since
then, more studies to compare anti-infective urinary
catheters with conventional urinary catheters have
been carried out. The noble metal alloy indwelling
catheter has been shown in multiple large clinical
trials and smaller case studies to reduce the incidence
of CA-UTI, when compared with conventional
catheters.9 10 11 12 13 14 15 These studies have examined endpoints
such as bacteriuria and symptomatic CA-UTI, or
surveillance-defined UTI.8 16 17 In a study by Pickard
et al,17 noble metal alloy catheters were found to be
ineffective in reducing the incidence of symptomatic
surveillance-defined UTI when used in short-term
(mean, 2 days) surgical patients and they did not
support the routine use of these catheters in this
patient group. Lack of effect is not surprising due to
the short catheterisation time and low-risk patient
group. In a more recent multicentre cohort study in
2014, Lederer et al4 examined the impact of noble
metal alloy catheters on symptomatic CA-UTI and
antibiotic use based on the NHSN surveillance and
concluded that a 58% relative reduction (P<0.0001)
in NHSN-defined CA-UTI rate was observed and
60% fewer antibiotics were used when compared
with conventional catheters.
In the present study, we were able to
demonstrate a 31% reduction in the incidence of
CA-UTI episodes per 1000 catheter-days in the
SAH group although it did not reach statistical
significance, likely due to too small study groups.
We believe that the incidence rate per catheter-days
is a more appropriate comparison to reflect the
risk of infection associated with different types of
catheter as it also takes into account the duration of
catheterisation, which is known to be an important
factor associated with the incidence of CA-UTI. This
is also reflected by the fact that the noble metal alloy
catheter can be left in situ for the longest period
of time. Although the cost of each SAH catheter
(approximately HK$100) is higher than that of a
conventional catheter (approximately HK$15), we
believe the benefit of longer duration and potential
reduction in CA-UTI justify its use.
With subgroup analysis, the effect of a noble
metal alloy catheter on reduction of CA-UTI was
more prominent in long-term users and female
patients. In patients who used both catheters
and who served as their own control, a significant
reduction (48%, P=0.027) was observed in the SAH
group. The same reduction was not observed in
those who used only one type of urinary catheter
whose number of catheters used and catheter-days
were significantly fewer (Table 4a and 4b). We
cannot give an exact explanation for this observation
but we believe the protective effect of Bactiguard
catheters is best seen in patients who require long-term
urinary catheterisation. Nonetheless, it must
be emphasised that the effect due to mixed use of
catheters is unknown. The reduction in CA-UTI
was also slightly more prominent in female patients
(rate ratio of CA-UTI episodes per 1000 catheter-days, 0.58; Table 4c). Whether these are genuine and
significant findings will warrant future randomised
controlled studies to confirm.
This study has several limitations. First, this
was a non-randomised study with a lack of blinding
of outcome observers. Second, some patients might
have used both catheters and the effects of each
catheter type might have confounded the results.
Third, as patients were recruited from a regional
rehabilitation hospital, their underlying different
medical conditions and risk factors might have
affected the outcomes. As patients admitted during
the two 6-month periods were incomparable,
confounding by underlying risk factors for CA-UTI
could not be excluded.
Conclusions
Our findings suggest that SAH-coated catheters may
be effective in reducing CA-UTI based on CDC’s
NHSN surveillance definition. The effect seems to be
more pronounced in high-risk patients such as long-term
users and female patients. Future randomised
controlled studies on this subject should be carried
out based on these pilot data.
Declaration
All authors have disclosed no conflicts of interest.
References
1. Kong MY. Systematic review of the effective approach
for limiting urinary catheter use and duration to reduce
nosocomial catheter-associated urinary tract infections in
hospitalized patients. Hong Kong: Faculty of Health and
Social Sciences, the Hong Kong Polytechnic University;
2010.
2. Centers for Disease Control. Public health focus:
surveillance, prevention, and control of nosocomial
infections. MMWR Morb Mortal Wkly Rep 1992;41:783-7.
3. Maki DG, Tambyah PA. Engineering out the risk for
infection with urinary catheters. Emerg Infect Dis
2001;7:342-7. Crossref
4. Lederer JW, Jarvis WR, Thomas L, Ritter J. Multicenter
cohort study to assess the impact of a silver-alloy and
hydrogel-coated urinary catheter on symptomatic
catheter-associated urinary tract infections. J Wound
Ostomy Continence Nurs 2014;41:473-80. Crossref
5. Division of Healthcare Quality Promotion, Centers for
Disease Control and Prevention. The National Healthcare
Safety Network manual. Atlanta, GA: Centers for Disease
Control and Prevention; 2009.
6. Hooton TM, Bradley SF, Cardenas DD, et al. Diagnosis,
prevention, and treatment of catheter-associated urinary
tract infection in adults: 2009 International Clinical
Practice Guidelines from the Infectious Diseases Society of
America. Clin Infect Dis 2010;50:625-63. Crossref
7. Salgado CD, Karchmer TB, Farr BM. Prevention of
catheter-associated urinary tract infection. In: Wenzel RP,
editor. Prevention and control of nosocomial infections.
4th ed. Philadelphia, PA: Lippincott Williams & Wilkins;
2003: 297-311.
8. Karchmer TB, Giannetta ET, Muto CA, Strain BA, Farr
BM. A randomized crossover study of silver-coated urinary
catheters in hospitalized patients. Arch Intern Med
2000;160:3294-8. Crossref
9. Gentry H, Cope S. Using silver to reduce catheter-associated
urinary tract infections. Nurs Stand 2005;19:51-4. Crossref
10. Newton T, Still JM, Law E. A comparison of the effect of
early insertion of standard latex and silver-impregnated
latex foley catheters on urinary tract infections in burn
patients. Infect Control Hosp Epidemiol 2002;23:217-8. Crossref
11. Gould CV, Umscheid CA, Agarwal RK, Kuntz G, Pegues
DA; Healthcare Infection Control Practices Advisory
Committee. Guideline for prevention of catheter-associated
urinary tract infections 2009. Infect Control
Hosp Epidemiol 2010;31:319-26. Crossref
12. Schumm K, Lam TB. Types of urethral catheters
for management of short-term voiding problems in
hospitalized adults: a short version Cochrane review.
Neurourol Urodyn 2008;27:738-46. Crossref
13. Seymour C. Audit of catheter-associated UTI using silver
alloy-coated Foley catheters. Br J Nurs 2006;15:598-603. Crossref
14. Rupp ME, Fitzgerald T, Marion N, et al. Effect of silver-coated
urinary catheters: efficacy, cost-effectiveness, and
antimicrobial resistance. Am J Infect Control 2004;32:445-50. Crossref
15. Verleyen P, De Ridder D, Van Poppel H, Baert L. Clinical
application of the Bardex IC Foley catheter. Eur Urol
1999;36:240-6. Crossref
16. Johnson JR, Kuskowski MA, Wilt TJ. Systematic review:
antimicrobial urinary catheters to prevent catheter-associated
urinary tract infection in hospitalized patients. Ann Intern Med 2006;144:116-26. Crossref
17. Pickard R, Lam T, MacLennan G, et al. Antimicrobial
catheters for reduction of symptomatic urinary tract
infection in adults requiring short-term catheterisation in
hospital: a multicentre randomised controlled trial. Lancet
2012;380:1927-35. Crossref