Effectiveness of a new standardised Urinary Continence Physiotherapy Programme for community-dwelling older women in Hong Kong
Hong Kong Med J 2015 Feb;21(1):30–7 | Epub 7 Nov 2014
DOI: 10.12809/hkmj134185
© Hong Kong Academy of Medicine. CC BY-NC-ND 4.0
ORIGINAL ARTICLE
Effectiveness of a new standardised Urinary
Continence Physiotherapy Programme for
community-dwelling older women in Hong Kong
BS Leong, MSc, BScPT1,2; Nicola W Mok, PhD1
1 Department of Rehabilitation Sciences, Hong Kong Polytechnic
University, Hunghom, Hong Kong
2 Elderly Health Service, Department of Health, Hong Kong
Corresponding author: Dr Nicola W Mok (nicola.mok@polyu.edu.hk)
 Full
paper in PDF
Full
paper in PDF
Abstract
Objective: To examine the effectiveness of a
standardised Urinary Continence Physiotherapy
Programme for older Chinese women with stress,
urge, or mixed urinary incontinence.
Design: A controlled trial.
Setting: Six elderly community health centres in
Hong Kong.
Participants: A total of 55 women aged over 65
years with mild-to-moderate urinary incontinence.
Interventions: Participants were randomly assigned
to the intervention group (n=27) where they received
eight sessions of Urinary Continence Physiotherapy
Programme for 12 weeks. This group received
education about urinary incontinence, pelvic floor
muscle training with manual palpation and verbal
feedback, and behavioural therapy. The control
group (n=28) was given advice and an educational
pamphlet on urinary incontinence.
Results:
There was significant improvement in
urinary symptoms in the intervention group,
especially in the first 5 weeks. Compared with the
control group, participants receiving the intervention
showed significant reduction in urinary incontinence
episodes per week with a mean difference of -6.4
(95% confidence interval, -8.9 to -3.9; t= –5.3;
P<0.001) and significant improvement of quality of
life with a mean difference of -3.93 (95% confidence
interval, -5.08 to -2.78; t= –6.9; P<0.001) measured
by Incontinence Impact Questionnaire Short Form
modified Chinese (Taiwan) version. The subjective
perception of improvement, measured by an 11-point visual analogue scale, was markedly better
in the intervention group (mean, 8.7; standard
deviation, 1.0; 95% confidence interval, 8.4-9.1) than in the control group (mean, 1.4; standard
deviation, 0.7; 95% confidence interval, 1.2-1.7;
t=33.9; P<0.001). The mean treatment satisfaction in
the intervention group was 9.5 (standard deviation,
0.8) as measured by an 11-point visual analogue
scale.
Conclusions: This study demonstrated that the
Urinary Continence Physiotherapy Programme was
effective in alleviating urinary symptoms among older Chinese women with mild-to-moderate
heterogeneous urinary incontinence.
New knowledge added by this
study
- This standardised Urinary Continence Physiotherapy Programme is effective in improving various types of urinary incontinence of mild-to-moderate severity.
- The superior exercise compliance and treatment outcome in this study are likely attributed to the palpation and verbal feedback provided by physiotherapists during pelvic floor muscle training.
- A standardised urinary continence programme consisting of education, supervised pelvic floor muscle training with palpation, and behavioural therapy is an effective first-line management for various types of urinary incontinence in a community setting.
Introduction
Urinary incontinence (UI), defined as “the
complaint of any involuntary leakage of urine”,1 is
a major clinical problem, and a significant cause of
disability and dependency in the aged population.
It is a condition with heterogeneous pathology and
commonly classified as stress urinary incontinence
(SUI), urge urinary incontinence (UUI), and mixed
urinary incontinence (MUI) depending on the
symptom behaviour. While the prevalence of UI in
older women, globally, is estimated to range from
15% to 30%,2 the reported prevalence rate of UI in
Hong Kong ranges from 20% to 52%.3 It has been
acknowledged that UI is associated with profound
adverse impact on the quality of life (QoL) of the
sufferers.3 4 The impact of UI is so substantial that
community-dwelling elderly with UI reported
inferior physical and mental health, worse self-perceived
health status, greater disability, and more
depressive symptoms.5 In addition, the extent of the
impact was shown to be associated with the severity
of UI. Therefore, it is important to investigate a safe
and effective treatment strategy in this population,
especially in a community setting.
Conservative management has been
recommended as the first-line management for UI.
It is acknowledged that a variety of conservative
management strategies which require patient’s active
participation shows promising results for patients
with UI. These include pelvic floor muscle training
(PFMT),6 7 vaginal cones,8 bladder training (BT),9 and
even combination of PFMT and general lumbopelvic
mobilisation exercises.10 A recent Cochrane review7
suggested that PFMT, the ‘knack’ manoeuvre (a
voluntary counterbracing type of contraction
during physical stress), and BT are effective
strategies in the management of UI in general. In
particular, a combination of PFMT and BT was
shown to have superior outcome than BT alone
for the management of UUI and MUI.9 However,
to date, there is insufficient conclusive evidence
on the best approach for PFMT.11 In addition, the
applicability and effectiveness of PFMT and BT for
treating UI have not been properly evaluated in the
elderly Chinese population, especially in randomised
controlled studies. The aim of this study was to
evaluate the effectiveness of a Urinary Continence
Physiotherapy Programme (UCPP), which is a
comprehensive programme involving education and
exercise (PFMT and BT) components for managing
SUI, UUI, and MUI in older Chinese women in a
community setting.
Methods
A total of 60 subjects were recruited for screening
by convenience sampling from six Elderly Health
Centres (EHCs), Department of Health, Hong Kong.
Inclusion criteria were Chinese females aged 65
years or older who had a clinical diagnosis of SUI,
UUI, or MUI (with reference to the definition from
International Continence Society1) of a mild-to-moderate
severity (based on the scoring system by
Lagro-Janssen et al12) which is made by the EHC
medical officers in-charge. Exclusion criteria were
active urinary tract infection, patients on diuretic
medication, presence of bladder pathology or
dysfunction due to genitourinary fistula, tumour,
pelvic irradiation, neurological or other chronic
conditions (eg diabetes mellitus, Parkinson’s disease),
previous anti-incontinence surgery, significant
cognitive impairment assessed by the Cantonese
version of Mini-Mental State Examination Score
(CMMSE13 with cutoffs of: ≤18 for illiterate
subjects, ≤20 for those who had had 1 to 2 years of
schooling, ≤22 for those who had had more than 2
years of schooling out of a maximum score of 30),
obesity (body mass index [BMI] of >30 kg/m2), and use
of concomitant treatments during the trial.
Randomisation was performed prior to the
study by an off-site investigator using a computerised
randomisation programme with allocation
concealment by sequentially numbered, opaque, and
sealed envelopes. After taking consent, grouping
of the individual participants was revealed to the
principal investigator by phone. Overall, 55 eligible
participants were assigned to the intervention
(n=27) or control (n=28) groups. The trial period
lasted for 12 weeks. The study was approved by the
Institutional Medical Research Ethics Committee
and was conducted in accordance with the
Declaration of Helsinki.14
Intervention protocol
One physiotherapist was responsible for delivering
assessment and treatment to all subjects during the
trial period of 12 weeks, and she was not blinded to
the intervention.
The intervention group received a 30-minute
individual training session at a pre-decided time
of the day, once weekly for the first 4 weeks; and
then once bi-weekly for the remaining 8 weeks. A
total of eight treatment sessions were given to each
recipient. There were three major components in
the UCPP: education (anatomy of the pelvic floor
muscle [PFM] and urinary tract, urinary continence
mechanism, and bladder care), PFMT with the aid
of vaginal palpation, and BT. Pelvic floor muscle
training included Kegel exercise programme
and neuromuscular re-education (the ‘knack’).15
Bladder training involved strategies to increase
the time interval between voids by a combination
of progressive void schedules, urge suppression,
distraction, self-monitoring, and reinforcement.
Four stages of Kegel’s PFMT programme
were adopted in this study, including (1) muscle
awareness, (2) strengthening, (3) endurance, and (4)
habit building and muscle utilisation.16 The exercise
regimen was designed to progressively strengthen
both type I and type II muscle fibres of the pelvic floor.
In the first 2 weeks (muscle awareness phase), one
set of 10 (week 1) and 15 (week 2) slow submaximal
contractions for 5 seconds each and five fast
maximal contractions with a 10-second relaxation
between contractions was performed in lying down
position. In the strengthening phase (weeks 3 to 4),
the muscle-strengthening element was reinforced
by gradually increasing the number of submaximal
contractions to 25 per session with an increment
of five repetitions per week in gravity-dependent
position including sitting and standing. The number
of fast maximal contractions (5) remained the same
as in the awareness phase. In the endurance phase
(weeks 5 to 8), the training was more focused on
improving the performance of slow and sustained
contractions of PFMs by increasing the contraction
time to 10 seconds with submaximal contraction
while keeping the exercise position and number of
both submaximal and maximal contractions as in
week 4. In the habit-building and muscle utilisation
phase (weeks 9 to 12), the learnt neuromuscular
re-education technique (the ‘knack’) and urge
suppression strategies were reinforced. In this period,
one set of 30 slow submaximal contractions for 10
seconds each and 10 fast maximal contractions with
a 10-second relaxation between contractions was
practised. Participants were asked to perform three
sets of the above-mentioned exercise at specific
periods as part of the home programme.
The control group was given advice and received an educational
pamphlet with information about management of UI
at baseline. Participants were given an appointment
for a follow-up visit in 12 weeks.
Outcome measures
A number of indicators were employed to assess
different aspects of outcomes. First, the number
of UI episodes in the previous 7 days (UI7) was
examined using a weekly bladder diary log sheet,
which was also the primary outcome measure of this
study. Information for UI7 was collected at baseline
and then weekly until the end of the programme
(12 weeks). Second, a validated condition-specific
QoL assessment tool—Incontinence Impact
Questionnaire Short Form (IIQ-7) Chinese (Taiwan)
version17—was used to study the impact of UI on
QoL and its change with the intervention after
minor modifications were made to align with the
local culture. Content validation was made by a
panel of doctors who reviewed the instrument
and determined if the questions satisfied the
content domain. Seven items were included in
the questionnaire to examine if the subjects were
suffering from urine leakage under those specific
situations. The questionnaire was administered by
the same physiotherapist and the subjects were asked
to choose the most appropriate response to those 7
items on a 4-point ordinal scale, with 0 meaning
“not at all affected”, 1 “slightly affected”, 2 “moderately
affected”, and 3 “greatly affected”. The maximum score
of 21 indicated a great impact of UI on QoL. Third,
subjective perception of improvement was assessed
with a 10-cm visual analogue scale (VAS) rated from
0 to 10, with 0 suggesting “no improvement” and 10
“complete relief” at the end of the intervention period.
Fourth, another VAS was used to assess subjects’
satisfaction to treatment (on a 0 to 10 rating), with
0 being “totally dissatisfied” and 10 “totally satisfied”.
The IIQ-7 was collected at baseline and at the end
of the programme. Compliance with treatment in
the intervention group was evaluated from two
perspectives: attendance and compliance with home
exercises. Attendance was reviewed by calculating
the proportion of sessions that were attended by
an individual. Compliance with home exercises was
also reviewed by calculating the reported frequency
of exercises being executed. Any drawbacks and
adverse effects during the intervention period were
also monitored.
Statistical analysis
The sample size calculation based on the power
estimation and results of a similar study,18 with a power of 0.8 and α = 0.05 and an attrition rate of 30%, revealed that a recruitment sample of 60
participants (30 participants in each group) was
required. Statistical analysis was performed with the
Statistical Package for the Social Sciences (Windows
version 13.0; SPSS Inc, Chicago [IL], US). Any
missing data were treated with “the last observation
carried forward” approach. Independent t tests (for
parametric data) or Mann-Whitney test (for nonparametric
or non-normally distributed data) and
Chi squared tests (for nominal/ordinal data) were
used to compare the demographic data and outcome
variables between the intervention and control
groups at baseline. Pairwise comparisons with the
P value adjusted using Bonferroni correction was
used to examine for the differences in UI7 between
week 1 and the subsequent time points during the
intervention period (eg between week 1 and 2, week
1 and 3, etc). The results were presented as mean
(standard deviation [SD]).
Results
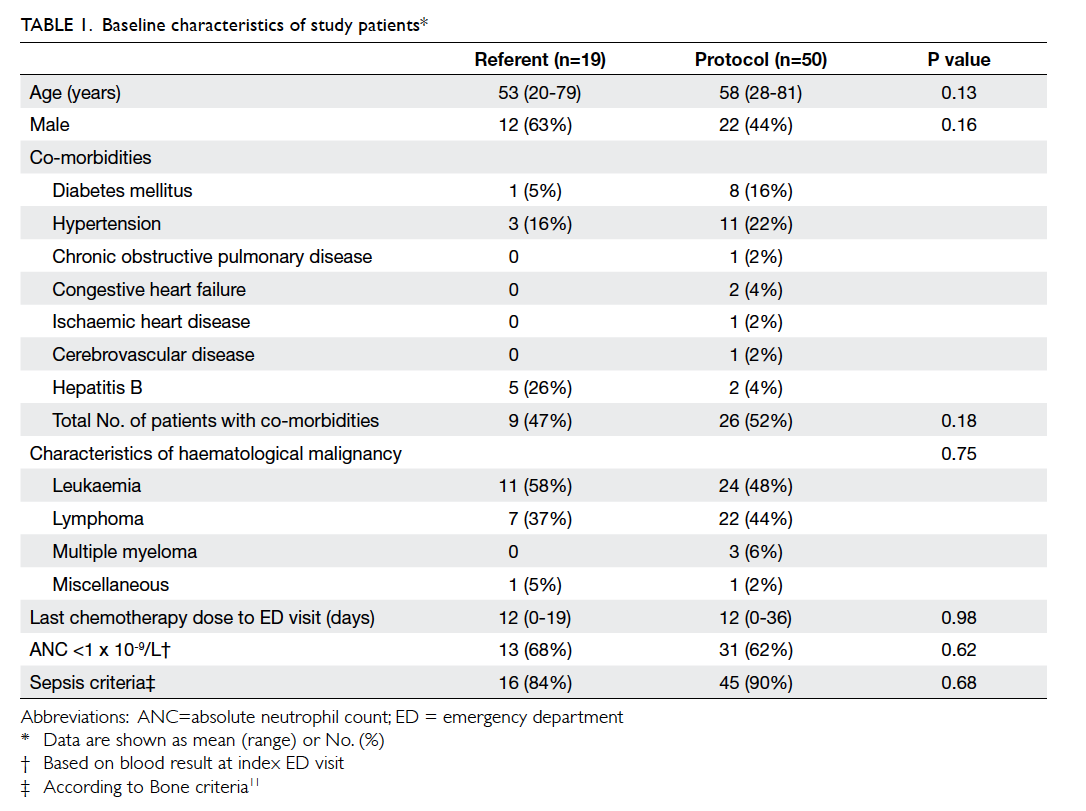
The demographics and baseline measurements for the participants are shown in Table 1. Of the 60
participants recruited for screening, three did not turn up for assessment, one declined to participate
in the study, and one was excluded due to impaired mental status (Fig 1). The majority of the participants were in their 70s with a mean (± SD) age of 74.3
± 4.6 years. There was no significant difference between the groups in terms of age, BMI, parity,
education level, mental status (CMMSE), and the characteristics of UI at baseline.
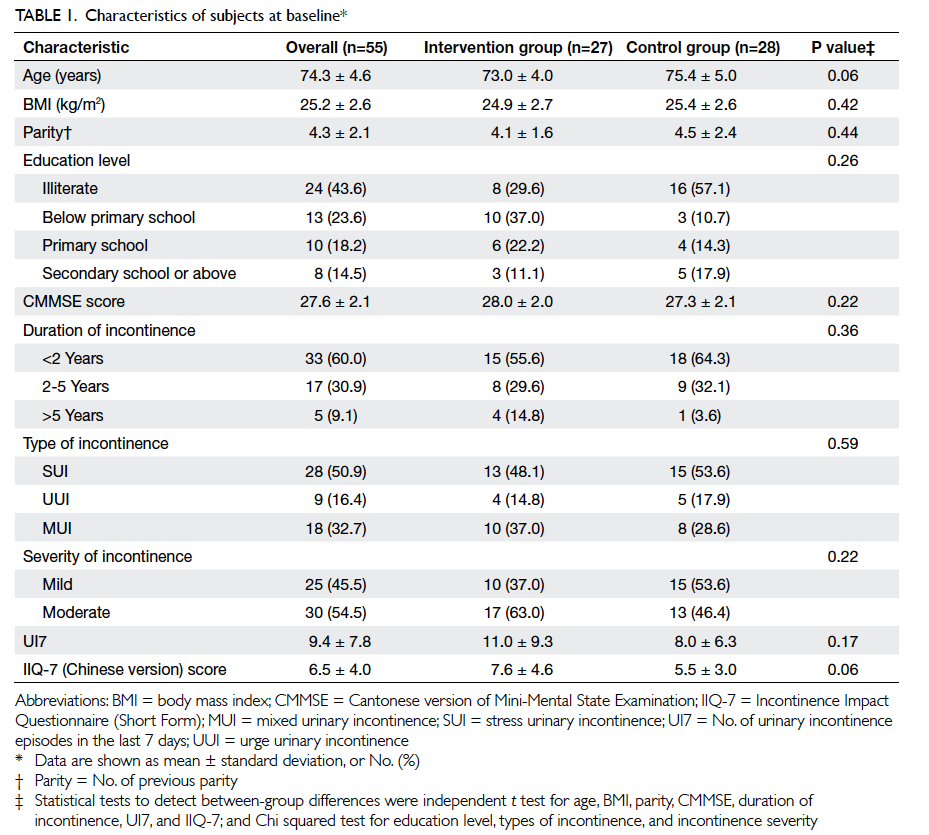
Table 1. Characteristics of subjects at baseline
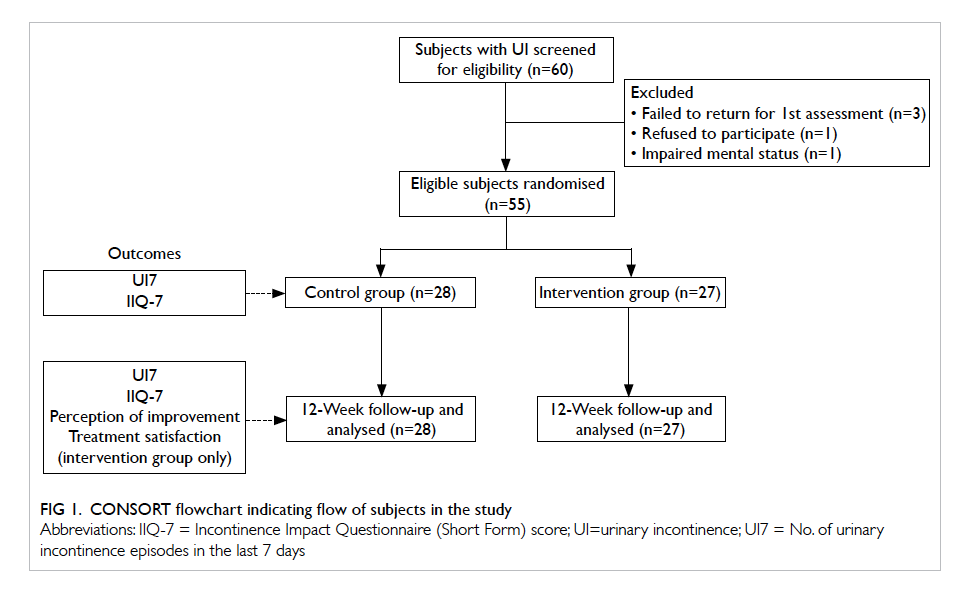
Figure 1. CONSORT flowchart indicating flow of subjects in the study
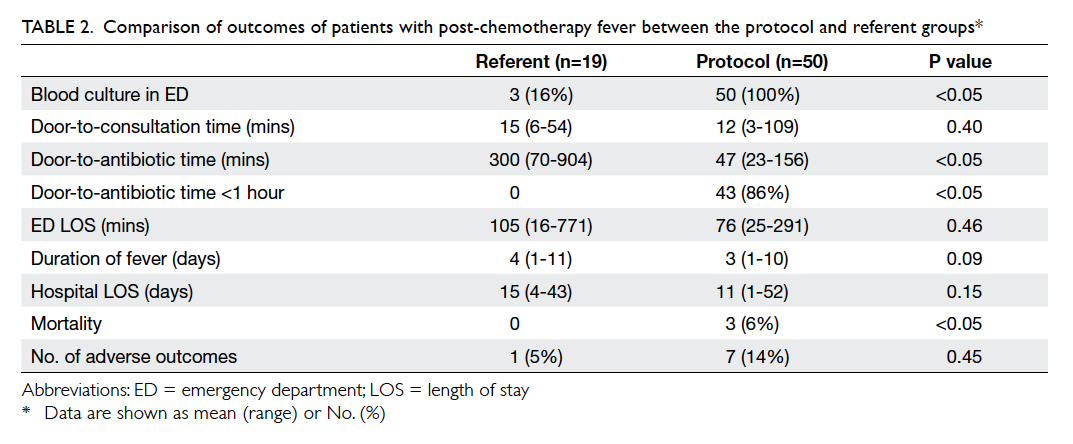
Number of urinary incontinence episodes in 7 days
There was a significant interaction between time and groups in UI7 (F(1,53) = 33.14; P<0.001). A significant
reduction in UI7 was noted only in the intervention group. There was significant difference between the
control and intervention groups (t = –5.3; P<0.001) at 12 weeks with a mean difference of -6.4 (95% confidence interval [CI], -8.9 to -3.9). The mean numbers of UI7 for intervention and control groups were 1.0 ± 1.9 (95% CI, 0.3-1.7) and 7.4 ± 6.2
(95% CI, 5.0-9.8), respectively, at 12 weeks (Table 2). When comparing the percentage reduction ([pre-treatment frequency – post-treatment frequency] / [pre-treatment frequency] x 100%) in UI7, the intervention group demonstrated a mean of more than 90% reduction versus 7.2% in the control group.
A similar trend of improvement was shown in subjects with SUI, UUI, and MUI; however, statistical analysis was not performed due to insufficient power (Fig 2). Post-hoc pairwise comparisons (a total of 11) suggested a significant improvement from week 1 to week 5 and onwards (P<0.001) in the intervention group.
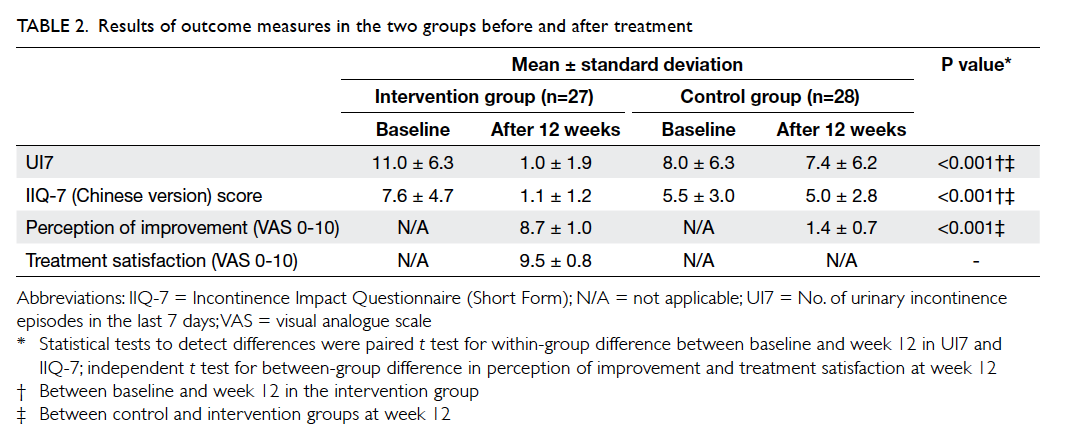
Table 2. Results of outcome measures in the two groups before and after treatment
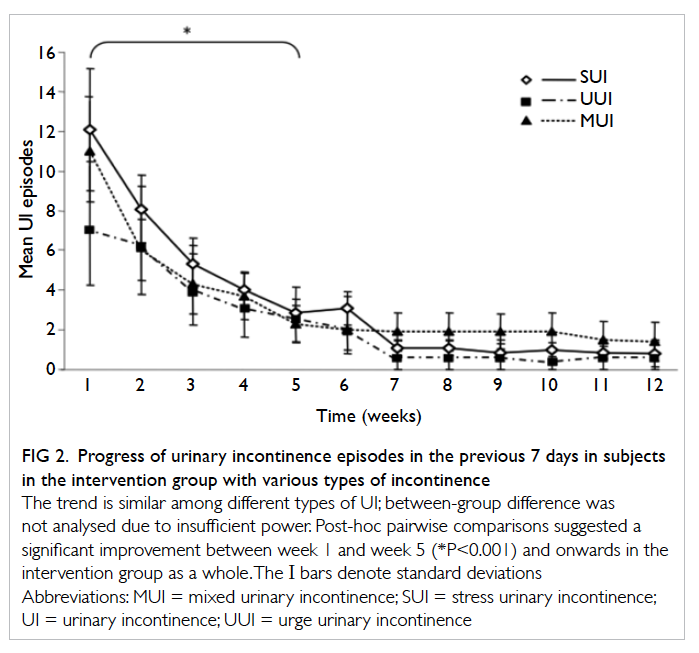
Figure 2. Progress of urinary incontinence episodes in the previous 7 days in subjects in the intervention group with various types of incontinence
Incontinence Impact Questionnaire Short
Form modified Chinese (Taiwan) version
A significant interaction between time and groups
was noted (F(1,53) = 54.56; P<0.001). As IIQ-7 was
non-normally distributed, Mann-Whitney test was
used and revealed a significant reduction of IIQ-7 (ie
improvement in QoL) only in the intervention group
(P<0.001), with a mean difference of -3.9 (95% CI,
-5.1 to -2.8) at 12 weeks (Table 2).
Perception of improvement, treatment
satisfaction, attendance, exercise compliance,
and attrition rate
The results of the subjective perception of
improvement and level of satisfaction with treatment
after 12 weeks are shown in Table 2. The majority
of the participants in the intervention group were
satisfied with the interventions and perceived a
subjective improvement. The mean attendance and
exercise compliance rates in the intervention group
were 97.7% ± 5.0% and 99.4% ± 1.9%, respectively.
The attrition rate was zero in both groups during the
whole study period. No adverse effect or discomfort
was reported during the intervention period.
Discussion
In line with results from previous studies, this study
further confirms that PFMT is an effective and
safe treatment for women suffering from various
types of UI. However, we observed a mean of >90%
reduction in UI episodes which is noticeably higher
than that reported in previous similar studies (32%
to 73% reduction).18 19 Although recommendation
of PFMT for women with UI is strongly supported by previous research findings,7 the best approach of
PFMT programme continues to remain unclear.11
One possible explanation for the superior outcome
in this study might be the combination of a few
effective features in this programme, including
programme duration of 12 weeks with gradual
exercise progression, combination of PFMT and
BT, manual vaginal palpation, and one-on-one
supervised training session. First, the design of this
UCPP incorporated some important concepts of
exercise therapy. The training period of this study
was 12 weeks, which could optimise the effect of
the neural adaptation (recruitment of efficient
motor units and frequency of excitation) and muscle
hypertrophy according to the recommendations
made by the American College of Sports Medicine.20
In addition, a recent systematic review7 also revealed
that implementation of PFMT programme for at
least 3 months (ie around 12 weeks) is more likely to
result in greater treatment effect versus that lasting
for <12 weeks. This programme also adopted the
concepts raised by Kegel16 in which the progression
of the exercise regimen is designed according
to different stages, namely muscle awareness,
strengthening, endurance, habit building, and
muscle utilisation. Previous studies suggested
a negative correlation between increased PFM
strength and UI symptoms.21 22 The improvement
of UI7 at the end of the UCPP might be a direct
result of the muscle training programme, although
PFM strength was not measured in this study.
Theoretically, skeletal muscle strengthening should
be facilitated by using additional resistance20 and,
therefore, it is questionable whether muscle strength
could be increased by UCPP using only maximal
voluntary contractions. However, a previous study
has indicated muscle strength improvement with
daily practice of voluntary PFM contraction without
resistance,20 and absence of extra improvement in
UI patient groups with intravaginal resistance as
compared with the group without resistance.23
Second, a combination of PFMT and BT
was used in this UCPP. Although PFMT has been
recommended as first-line management, even for
women with UUI and MUI,7 there is some evidence
suggesting superior outcome with combined PFMT
and BT in this population.9 The result of this study
confirmed these suggestions as a similar pattern of
improvement was observed across the three groups
(UUI, SUI, and MUI), although statistical analysis of
the difference between subgroups was not performed
due to the small sample size.
Third, vaginal palpation was used to facilitate
and ensure correct PFM contraction. It was reported
that approximately 30% of women are unable to
perform isolated pelvic floor contractions with only
written or verbal instructions.21 We consider the
extra proprioceptive cue and specific verbal feedback
are an integral part of the PFMT, and consider these
to play a crucial role, especially in the initial (muscle
awareness) stage. Ensuring feedback may also
increase exercise adherence and compliance, apart
from improving the treatment outcomes.
Fourth, the exercise sessions were conducted on
a one-on-one basis for 30 minutes each. It has been
reported that the amount of contact with health care
professionals is positively correlated with reported
cure and improvement (eg perception of change and
incontinence-specific QoL) in patients with UI.11
It is argued that women receiving more attention
may overestimate their improvement to please the
treatment provider (ie experimenter effect),11 and it
is strongly suggested to include more ‘objective’ data
such as leakage episode outcomes in all PFMT trials.
The result of this study revealed improvement in UI7
as well as other subjective measures (IIQ-7, perception
of improvement, and treatment satisfaction), which
could be considered as additional evidence base.11
The subjects’ compliance with the treatment
programme was excellent, as reflected by the high
compliance rate with exercise regimens, high
attendance rate, and zero dropouts; the dropout
rates reported in previous studies were relatively
high, ranging from 12% to 41%.6 18 24 A possible
explanation for such good compliance might be the
significant improvement in the early stage of the
protocol, which in turn increased the participants’
motivation for and confidence in adhering with
the PFMT programme. Regular meetings (weekly
or bi-weekly) with the same physiotherapist, who
offered continuity of care, could be another possible
explanation for the favourable compliance.
Study limitations
The main limitations in this study were: (1) potential
selection bias due to use of convenience sampling,
(2) absence of assessor blinding, (3) possibility of
over-reporting, and (4) the use of the modified IIQ-7
Chinese (Taiwan) version. It has been acknowledged
that convenient sampling might not be
representative of the whole population suffering from
UI. On the other hand, our subject group might have
similar care-seeking behaviour as the client group in
clinical practice. Although statistically insignificant,
the data showed a small difference in some aspects
of the demographic characteristics. In general, the
control group tended to be slightly older (75.4 years
vs 73.0 years), more likely to be illiterate, and have
milder severity, and shorter duration of UI versus
the intervention group. As these slight differences in
the demographics might induce confounding, their
effects warrant further investigation. Nevertheless,
interpretation of the results of this study deserves
some caution. In this study, five participants
recruited for screening did not join the programme
due to various reasons (one denied, three failed
to turn up, and one due to impaired mental status). Although the specific reason for the
absence of three participants was not investigated,
the possibility of self-selection bias should be
considered. In addition, all involved parties (the
assessor, treatment provider, and the participants)
were not blinded to the intervention, as opposed to
the ideal experimental setup. However, it is widely
acknowledged that given the nature of the treatment
programme, it is difficult and often impossible to
blind the treatment provider and participants during
treatment.11 Due to resource limitation, it was not
possible to include an independent, blinded assessor
for outcome assessment. We were well aware of the
possible ‘experimenter effect’, and therefore used
UI7 as our primary outcome measure which is
considered a more objective measure to minimise
the possible effect of over-reporting of subjective
improvement,11 although its ‘objectivity’ remains
controversial. In addition, a significant proportion of
participants (approximately 44%) required assistance
for completing the outcome questionnaires due to
illiteracy. This could possibly lead to over-reporting
of improvement. Furthermore, the possibility of
over-reporting of compliance by participants using
self-reported weekly exercise diary should not be
overlooked. There is, however, no better measure
available to monitor the performance of this type of
exercise accurately. A recent randomised controlled
trial25 reported that severity of SUI symptoms at
baseline and extent of PFM strength improvement,
rather than exercise adherence, were correlated
with symptom reduction for women with SUI.
The result suggested a complex interaction between
subject’s health condition, exercise compliance
and treatment effectiveness, which warrant further
investigation. Therefore, we intended not to account
the improvement observed in our intervention group
to the high self-reported compliance rate. Finally,
a modified Chinese (Taiwan) version of IIQ-7 was
used in this study. We are aware of the fact that this
version has not been properly validated. However,
we do not believe this affects our results as the
modification was minor and the version was highly
comparable with the Hong Kong version which was
validated subsequent to the current study.
This study examined the immediate
effectiveness of the verbally instructed UCPP just
after cessation of supervised training. No follow-up
data were collected. It is recommended that the long-term
effectiveness of UCPP be explored, especially in
the light of fairly extensive literature which reported
poor long-term adherence and relapse at 3 to 5 years
following pelvic floor rehabilitation programme.26
Conclusions
This study demonstrated that a structured 12-week
programme of PFMT with gradual exercise
progression, BT with urgency suppression, and
enhanced education is likely to improve episodes of
urinary leakage and QoL in older Chinese women
with various kinds of UI in a community setting.
References
1. Abrams P, Cardozo L, Fall M, et al. The standardisation of
terminology of lower urinary tract function: report from
the Standardisation Sub-committee of the International
Continence Society. Neurourol Urodyn 2002;21:167-78. CrossRef
2. Klausner AP, Vapnek JM. Urinary incontinence in the
geriatric population. Mt Sinai J Med 2003;70:54-61.
3. Pang MW, Leung HY, Chan LW, Yip SK. The impact of
urinary incontinence on quality of life among women in
Hong Kong. Hong Kong Med J 2005;11:158-63.
4. Cheung RY, Chan S, Yiu AK, Lee LL, Chung TK. Quality
of life in women with urinary incontinence is impaired and
comparable to women with chronic diseases. Hong Kong
Med J 2012;18:214-20.
5. Aguilar-Navarro S, Navarrete-Reyes AP, Grados-Chavarria
BH, Garcia-Lara JM, Amieva H, Avila-Funes JA. The
severity of urinary incontinence decreases health-related
quality of life among community-dwelling elderly. J
Gerontol A Biol Sci Med Sci 2012;67:1266-71. CrossRef
6. Fan HL, Chan SS, Law TS, Cheung RY, Chung TK. Pelvic
floor muscle training improves quality of life of women
with urinary incontinence: a prospective study. Aust N Z J
Obstet Gynaecol 2013;53:298-304. CrossRef
7. Dumoulin C, Hay-Smith J. Pelvic floor muscle training
versus no treatment, or inactive control treatments, for
urinary incontinence in women. Cochrane Database Syst
Rev 2010;(1):CD005654.
8. Pereira VS, de Melo MV, Correia GN, Driusso P. Long-term
effects of pelvic floor muscle training with vaginal cone
in post-menopausal women with urinary incontinence:
a randomized controlled trial. Neurourol Urodyn
2013;32:48-52. CrossRef
9. Wallace SA, Roe B, Williams K, Palmer M. Bladder training
for urinary incontinence in adults. Cochrane Database Syst
Rev 2004;(1):CD001308.
10. Kim H, Yoshida H, Suzuki T. The effects of multidimensional
exercise treatment on community-dwelling elderly
Japanese women with stress, urge, and mixed urinary
incontinence: a randomized controlled trial. Int J Nurs
Stud 2011;48:1165-72. CrossRef
11. Hay-Smith EJ, Herderschee R, Dumoulin C, Herbison GP.
Comparisons of approaches to pelvic floor muscle training
for urinary incontinence in women. Cochrane Database
Syst Rev 2011;(12):CD009508.
12. Lagro-Janssen TL, Debruyne FM, Smits AJ, van Weel C.
Controlled trial of pelvic floor exercises in the treatment
of urinary stress incontinence in general practice. Br J Gen
Pract 1991;41:445-9.
13. Chiu HF, Lee HC, Chung WS, Kwong PK. Reliability and
validity of the Cantonese version of Mini-Mental State
Examination: a preliminary study. J Hong Kong Coll Psych
1994;4:25-8.
14. World Medical Association. World Medical Association
Declaration of Helsinki: ethical principles for medical
research involving human subjects. JAMA 2013;310:2191-4. CrossRef
15. Miller JM, Sampselle C, Ashton-Miller J, Hong GR,
DeLancey JO. Clarification and confirmation of the Knack
maneuver: the effect of volitional pelvic floor muscle
contraction to preempt expected stress incontinence. Int
Urogynecol J Pelvic Floor Dysfunct 2008;19:773-82. CrossRef
16. Kegel AH. Physiologic therapy for urinary stress
incontinence. J Am Med Assoc 1951;146:915-7. CrossRef
17. Tsai CH. The effectiveness of a pelvic floor muscle
rehabilitation program in managing urinary tract
incontinence among Taiwanese middle age and older
women [dissertation]. Pittsburgh: University of Pittsburgh;
2001.
18. Castro RA, Arruda RM, Zanetti MR, Santos PD, Sartori
MG, Girao MJ. Single-blind, randomized, controlled trial of
pelvic floor muscle training, electrical stimulation, vaginal
cones, and no active treatment in the management of stress
urinary incontinence. Clinics (Sao Paulo) 2008;63:465-72. CrossRef
19. Zahariou A, Karamouti M, Georgantzis D, Papaioannou P.
Are there any UPP changes in women with stress urinary
incontinence after pelvic floor muscle exercises? Urol Int
2008;80:270-4. CrossRef
20. Garber CE, Blissmer B, Deschenes MR, et al. American
College of Sports Medicine position stand. Quantity
and quality of exercise for developing and maintaining
cardiorespiratory, musculoskeletal, and neuromotor fitness
in apparently healthy adults: guidance for prescribing
exercise. Med Sci Sports Exerc 2011;43:1334-59. CrossRef
21. Bø K. Pelvic floor muscle strength and response to pelvic
floor muscle training for stress urinary incontinence.
Neurourol Urodyn 2003;22:654-8. CrossRef
22. Dannecker C, Wolf V, Raab R, Hepp H, Anthuber C. EMG-biofeedback
assisted pelvic floor muscle training is an
effective therapy of stress urinary or mixed incontinence: a
7-year experience with 390 patients. Arch Gynecol Obstet
2005;273:93-7. CrossRef
23. Herbison GP, Dean N. Weighted vaginal cones for
urinary incontinence. Cochrane Database Syst Rev
2013;(7):CD002114.
24. Hay-Smith EJ, Bø Berghmans LC, Hendriks HJ, de Bie RA,
van Waalwijk van Doorn ES. Pelvic floor muscle training
for urinary incontinence in women. Cochrane Database
Syst Rev 2001;(1):CD001407.
25. Hung HC, Chih SY, Lin HH, Tsauo JY. Exercise adherence
to pelvic floor muscle strengthening is not a significant
predictor of symptom reduction for women with urinary
incontinence. Arch Phys Med Rehabil 2012;93:1795-800. CrossRef
26. Bø K, Hilde G. Does it work in the long term?—A systematic
review on pelvic floor muscle training for female stress
urinary incontinence. Neurourol Urodyn 2013;32:215-23. CrossRef
Find HKMJ in MEDLINE: