Hong Kong Med J 2014;20:222–8 | Number 3, June 2014 | Epub 30 Jan 2014
DOI: 10.12809/hkmj134035
© Hong Kong Academy of Medicine. CC BY-NC-ND 4.0
ORIGINAL ARTICLE
Type 2 diabetes management in Hong Kong ethnic
minorities: what primary care physicians need to know
Catherine XR Chen, MRCP (UK), FHKAM
(Family Medicine); KH Chan, FRACGP, FHKAM (Family Medicine)
Department of Family Medicine and GOPC,
Queen Elizabeth Hospital, 30 Gascoigne Road, Kowloon, Hong Kong
Corresponding author: Dr Catherine XR
Chen (uccxr758@ha.org.hk)

Abstract
Objectives: To identify
the demographics and compare diabetes control in ethnic minority
group diabetes patients with Chinese diabetes patients who are
managed in primary care settings and to explore strategies to
improve their care.
Design: Retrospective
case series.
Setting: General
Outpatient Clinic of a Hong Kong Hospital Authority hospital.
Patients: Chinese type 2 diabetes patients and ethnic
minority groups who had been regularly followed
up with annual assessments carried out between 1
March 2012 to 28 February 2013 were recruited. Their
serum levels of fasting glucose, creatinine, estimated
glomerular filtration rate, haemoglobin A1c levels,
lipid profile, blood pressure, and co-morbidities were
retrieved from the Clinical Management System. Student’s t test and analysis of
variance were used to evaluate continuous variables and the Chi
squared test for categorical data. All statistical tests were
two-sided, and a P value of <0.05 was considered significant.
Results: Among 4346 type
2 diabetes patients fulfilling the inclusion criteria, 3966
(91.3%) patients were Chinese and 380 (8.7%) were from the
ethnic minority groups. Compared with Chinese diabetes patients,
the latter were much younger and more obese (both P<0.001).
Their glycaemic control was poorer than age- and sex-matched
Chinese diabetes patients (P=0.006). Control of systolic blood
pressure was similar in the two groups, but the mean diastolic
blood pressure was higher in the ethnic minority groups than in
the controls (78 ± 11 mm Hg vs 73 ± 11 mm Hg; P<0.001). With
regard to lipid control, their total cholesterol, low-density
lipoprotein, and triglyceride levels were similar, but
high-density lipoprotein levels were much lower in the ethnic
minority groups than their Chinese counterparts (1.19 ± 0.33
mmol/L vs 1.28 ± 0.36 mmol/L; P=0.001). Among the five major
ethnic minority groups with diabetes, Pakistani patients had
particularly poor glycaemic control and the Nepalese had the
poorest diastolic blood pressure control.
Conclusions: Ethnic
minority groups are an integral part of the Hong Kong
population. Compared with Chinese diabetes patients, those from
the ethnic minorities were much younger and more obese.
Deficiencies exist in the comprehensive management of diabetes
in these ethnic minorities, particularly with respect to
glycaemic control. Culturally tailored health care interventions
are therefore warranted to promote patient education and
clinical effectiveness and to improve their long-term health
status.
New knowledge added by this
study
- Compared with Chinese diabetes patients, ethnic minority group (EMG) diabetes patients from South Asia were much younger but more obese and had higher co-morbidity from hypertension.
- In EMG diabetes patients, glycaemic control was poorer than their age- and sex-matched Chinese counterparts (mean ± standard deviation, haemoglobin A1c 7.8 ± 1.7% vs 7.5 ± 1.4%; P=0.006). Systolic blood pressure control was similar in the two groups, but the mean diastolic blood pressure was higher in EMG cohort (78 ± 11 vs 73 ± 11 mm Hg; P<0.001). High-density lipoprotein levels were much lower in EMG diabetes patients than in the Chinese controls (1.19 ± 0.33 vs 1.28 ± 0.36 mmol/L; P=0.001).
- Among the five major EMGs of diabetes patients, Pakistani patients had particularly poor glycaemic control and the Nepalese had the poorest diastolic blood pressure control.
- Deficiencies exist in the comprehensive management of diabetes among South Asian diabetes patients in Hong Kong. Genetic factors, obesity, insulin resistance, and poor compliance to medical advice and treatment due to multiple socio-economic factors have been postulated to contribute to this occurrence.
- Local doctors should pay particular attention to their requirements and offer flexible and integrated care that reflects their physical, psychological, social, and cultural needs.
Introduction
Type 2 diabetes mellitus (T2DM) is one of
the most common chronic conditions encountered in primary care,
and affects up to 10% of Hong Kong (HK) population.1 Its complications include kidney disease,
blindness, lower limb amputation, and coronary heart disease; all
of which lead to increased morbidity and mortality.2
Ethnic minorities constitute an important
component of the HK population. According to census in 2011, about
95% of the local inhabitants are ethnic Chinese; the remainder
(ethnic minorities) are mainly from Asia (India, Philippines,
Nepal, Pakistan, and Indonesia).3
Previous studies have shown that diabetes affects certain ethnic
minority groups (EMGs) differently.4
South Asians are at higher risk for T2DM by up to 4 to 6 fold
compared with other ethnic groups, probably due to a combination
of genetic and environmental factors.5
6 In addition, South Asians
have a much higher prevalence of T2DM with cardiovascular disease
that occurs at an earlier age and is associated with higher
morbidity and mortality.7
Differences in health care systems, limited access to health
services, and social deprivation can further compound the risk of
developing diabetes and its complications.
Improving the quality of chronic disease
management is an essential component of health policy in the
community. Locally, a significant proportion of T2DM patients
including those from EMGs are managed in primary care and followed
up at government general out-patient clinics (GOPCs) of the Hong
Kong Hospital Authority (HKHA). The clinic where the authors work
is one of the largest GOPCs of the HKHA, and more than 50% of its
attendees have chronic diseases including diabetes. In addition,
it is located in central Kowloon, where most of the South Asian
minorities including Indians, Nepalese, and Pakistanis reside.
Till now, local data on the diabetic
control among EMG diabetes patients are lacking. To address this
knowledge gap, we aimed to identify and compare the demographics
of diabetes and its control in ethnic minority and Chinese
patients managed in primary care and to explore possible
strategies to improve care. We believe this study will provide
important background information to address important issues
pertinent to chronic disease management within various HK ethnic
groups.
Methods
This was a retrospective case series study
carried out in the Yau Ma Tei Jockey Club GOPC of the HKHA.
According to a pilot study carried out in early 2012, the five
major ethnic minorities undergoing regular follow-up in this
clinic were from India, Nepal, the Philippines, Pakistan, and
Indonesia. Regular follow-up was defined as returning to our
clinic for chronic disease management on a regular basis, ie, every
1 to 4 months. Very few Caucasians or other Asian ethnic groups
such as the Japanese and Koreans had regular follow-up at this
clinic and were therefore excluded from the analysis.
Subjects
Patients with T2DM coded by International
Classification of Primary Care (ICPC) T90, who had been regularly
followed up at Yau Ma Tei Jockey Club Clinic between 1 March 2012
and 28 February 2013 and had an annual blood and urine checkup at
least once during this period, were recruited. The diagnosis of
diabetes was based on the “Definition and description of diabetes
mellitus” from American Diabetes Association in 2010.8 Wrongly diagnosed diabetes patients, type 1
diabetes patients, diabetes patients who were regularly followed
up in the specialist out-patient departments (SOPDs), diabetes
patients who had no annual checkup within this period, and those
who were neither Chinese nor belonged to the above five EMGs were
excluded.
Determination of variables
The recruited patients’ age, gender,
ethnicity, smoking status, body mass index (BMI), latest blood
pressure, fasting blood sugar (FBS), haemoglobin A1c (HbA1c) and creatinine levels, urine albumin/creatinine ratio, and lipid profile were
retrieved from the Clinical Management System (CMS) of the HKHA.
The most recent blood and urine test was used for analysis if more
than one test had been performed during the study period. The BMI
was calculated as body weight/body height2(kg/m2).The
patient was considered a smoker if he/she currently smoked or was
in the first 6 months of stopping.
We used the abbreviated Modification of
Diet in Renal Disease9 to
give an estimated glomerular filtration rate (eGFR) expressed in
mL/min/1.73 m2, and chronic kidney disease was defined
as having an eGFR of <60 mL/min/1.73 m2:
eGFR=186 × [SCR/88.4]–1.154 × [age]–0.203 × [0.742 if female]
where SCR was the serum creatinine level expressed as µmol/L
eGFR=186 × [SCR/88.4]–1.154 × [age]–0.203 × [0.742 if female]
where SCR was the serum creatinine level expressed as µmol/L
The medical history of stroke, ischaemic
heart disease (IHD), and concomitant hypertension (HT) were
retrieved based on ICPC codes in the CMS. Stroke cases were
retrieved using ICPC codes K89 (transient ischaemic attack), K90
(cerebrovascular accident), and K91 (cerebrovascular disease).
Cases of HT were retrieved using ICPC codes K86 (uncomplicated HT)
and K87 (complicated HT). Patients with IHD were retrieved using
the codes K74 (IHD with angina), K75 (acute myocardial
infarction), and K76 (IHD without angina). Repeat systolic blood
pressures (SBPs) of ≥130 mm Hg or diastolic blood pressures
(DBPs) of ≥80 mm Hg confirmed a diagnosis of HT in diabetes
patients.10
Statistical analyses
All data were entered and analysed using
computer software (Statistical Package for the Social Sciences;
Windows version 16.0; SPSS Inc, Chicago [IL], US).
Student’s t test and analysis of variance were used to
analyse continuous variables and Chi squared tests for categorical
data. Tukey and Games-Howell tests were used for pairwise
comparisons within the five minority groups, if applicable. All
statistical tests were two-sided, and a P value of <0.05 was
considered significant.
Results
A list of 5536 T2DM patients followed up in
this clinic from 1 March 2012 to 28 February 2013 was generated
from the CMS. Among them, 1190 (21.5%) were excluded due to the
already described exclusion criteria (11 wrongly diagnosed as
diabetic, 1 had type 1 diabetes, 395 were regularly followed up in
the SOPDs, 2 were Caucasians, and 781 diabetes patients
had no blood and urine check-up during the recruitment period).
Thus, findings from the remaining 4346 (78.5%) patients fulfilling
our inclusion criteria were analysed. Among these patients, 3966
(91.3%) were Chinese and 380 (8.7%) were from the EMGs. Table 1 summarises the demographic
characteristics of these patients in both the Chinese and EMGs. In
summary, they were comparable in terms of gender ratio and smoking
status (both P>0.05). However, patients from the EMGs were
significantly younger (mean ± standard deviation [SD], 55.4 ± 11.7
years vs 66.1 ± 11.5 years; P<0.001) and their BMIs were much
higher (mean ± SD, 28.5 ± 4.6 kg/m2 vs 25.8 ± 4.3 kg/m2;
P<0.001) than those of the Chinese diabetes patients.
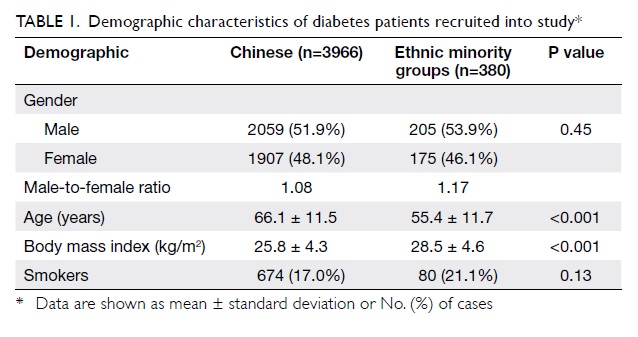
Table 1. Demographic characteristics of diabetes patients recruited into study*
To reduce confounding due to age, 380 age-
and sex-matched diabetes patients were randomly selected from the
Chinese diabetes cohort. Table 2 summarises the glycaemic, blood
pressure and lipid profile control, as well as kidney function in
these diabetic Chinese and EMGs. The latter patients were found to
have a greater proportion with HT than the Chinese diabetic
controls (P=0.03), whereas their co-morbidity rates for stroke,
IHD, and chronic kidney disease were similar. Glycaemic control
was poorer in EMG diabetes patients than their age- and
sex-matched Chinese counterparts (HbA1c, 7.8 ± 1.7% vs 7.5 ± 1.4%;
P=0.006). Consistently, their FBS levels were also much higher
than those of the controls (P=0.02). With regard to blood pressure
control, SBP was similar in the two groups, but the mean DBP was
higher in the EMG cohort (78 ± 11 vs 73 ± 11 mm Hg; P<0.001).
When lipid control was compared, total cholesterol, low-density
lipoprotein (LDL), and triglyceride levels were found to be
similar in the two groups. High-density lipoprotein levels (HDLs),
however, were much lower in the EMG diabetes patients (1.19 ± 0.33
mmol/L vs 1.28 ± 0.36 mmol/L; P=0.001).
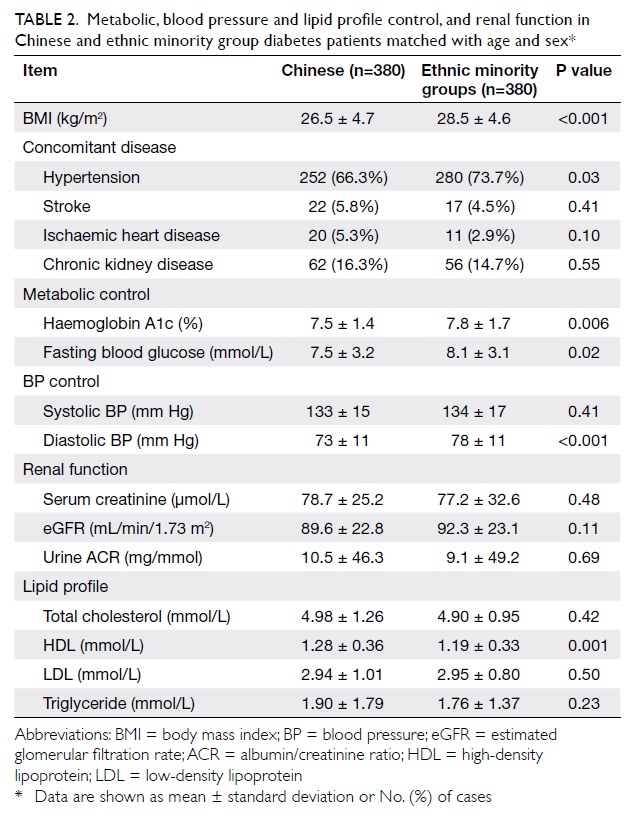
Table 2. Metabolic, blood pressure and lipid profile control, and renal function in Chinese and ethnic minority group diabetes patients matched with age and sex*
Regarding the demographic characteristics
of EMG diabetes patients (Table 3), most were Nepalese (n=169),
followed by Indian (n=103), Filipino (n=51), Pakistani (n=47), and
Indonesian (n=10). The male-to-female (M/F) ratio was much higher
in the Pakistani, Indian, and Nepalese groups (P<0.001).
However, the mean age of the Nepalese and Pakistani patients was
much younger than that of the Indian and Indonesian groups
(P=0.004). More Nepalese and Pakistani diabetes patients were
chronic smokers than those from the other ethnic minorities
(P<0.001).
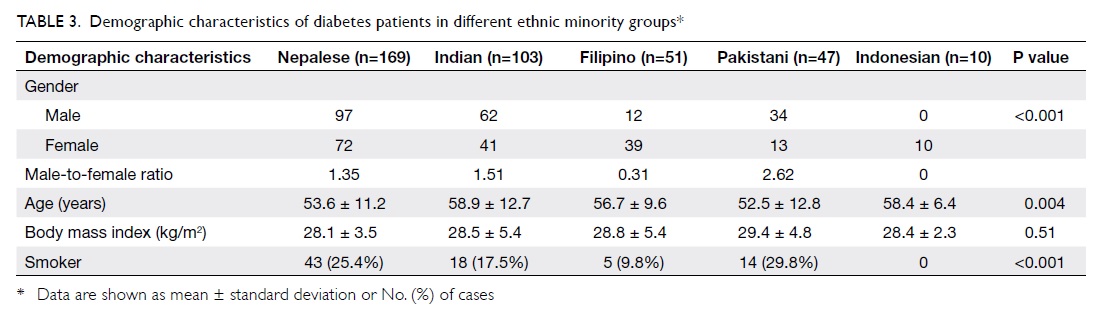
Table 3. Demographic characteristics of diabetes patients in different ethnic minority groups*
Table 4 shows glycaemic, blood pressure, and
lipid profile control in diabetes patients within the individual
EMGs. Owing to their dissimilar age and gender composition,
comparisons between different minority groups were inevitably
confounded. Nevertheless, the data indicated that glycaemic
control was particularly poor in Pakistani patients (mean ± SD
HbA1c levels being 8.4 ± 1.6%), and less so in the Nepalese and
Indian groups (7.8 ± 1.9% and 7.8 ± 1.7%, respectively). In
contrast, the metabolic control of Indonesian diabetes patients
was generally satisfactory (mean HbA1c level being 6.8 ± 0.6%).
The mean SBP was similar among all EMGs, but the mean DBP control
was suboptimal in the Nepalese group (84 ± 11 mm Hg) and within
target in the other minority groups. When lipid control was
studied, the total cholesterol, LDL, and triglyceride levels were
similar, but Pakistani patients had a much lower mean HDL level
(1.04 ± 0.27 mmol/L).

Table 4. Chronic disease control in ethnic minority group diabetes patients*
Discussion
This study was the first clinical analysis
of T2DM patients in local EMGs. It compared demographic
characteristics of both Chinese and EMG diabetes patients managed
in primary care. Notably, it revealed discrepancies between the
groups in terms of glycaemic, blood pressure, and lipid profile
control.
Notably, in HK, the basic demographic
features of Chinese diabetes patients and those from EMGs were
quite different. The latter were younger and more obese; such
findings were in line with those in the HK census in 2011 which
showed that 61.3% of EMGs were aged 25 to 44 years and that the
median age for all EMG patients was much lower than that of the
entire HK population.3 In
addition, the main reason for staying in HK for nearly all EMG
subjects was to work, and when asked about their occupation most
of the recruited EMG diabetes patients (n=334, or 87.9% of them)
stated that they undertook manual labour. Thus, most were in their
40s and 50s and therefore their mean age was understandably
younger than that of their Chinese counterparts (identified within
a gradually ageing population). Furthermore, diabetes patients
from South Asian ethnicities were more obese and had a much higher
BMI than their Chinese controls. It is well known that the
prevalence of obesity varies substantially between ethnic groups
and is estimated to differ according to the precise measurements
used (eg BMI, waist-to-hip ratio, and waist circumference).
Although no data in the literature have directly compared the BMI
of Chinese diabetes patients with that of those from South Asia,
studies from UK have revealed that the mean waist-hip girth ratios
and trunk skin folds were larger in South Asians than in European
and Chinese groups.11
Since age is a very important confounder
that prevented direct comparison between the two groups, age- and
sex-matched diabetes patients from the Chinese and ethnic
minorities were studied further. Even so, glycaemic control was
poorer in EMG patients than the matched Chinese controls (mean ±
SD, HbA1c 7.8 ± 1.7% vs 7.5 ± 1.4%; P=0.006). Whereas SBP control
was similar, the mean DBP was higher in the EMGs (P<0.001). In
addition, the mean HDL levels were much lower in EMGs than in the
matched Chinese controls (P=0.001). Possible reasons for such a
difference between could be multi-factorial. First, several
studies have shown that genetic factors may play a determinant
role.12 13 Diabetes patients from the South Asia appear
more likely to have insulin resistance and a higher prevalence of
obesity and metabolic syndrome, all of which are chronic
conditions that challenge glucose metabolism.5 Second, patients from EMGs are often at a
socio-economic disadvantage and difficult to reach via mainstream
channels, and so they face inequalities in accessing medical care.3 For example, EMG diabetes
patients might not have their diabetes diagnosed if they were
socially disadvantaged and might be less inclined to seek medical
care. Moreover, underdiagnosed individuals may be more likely to
have poor diabetic control and experience early mortality. Third,
the first language of South Asian groups is usually neither
English nor Chinese, and therefore they may not understand the
medical advice properly. Lastly, their cultures, religious
beliefs, and lifestyles may influence their behaviour (including
levels of physical activity and food choices), all of which affect
health status and management. Coordinated efforts are therefore
needed to overcome these limitations and embark on integrated
diabetes monitoring and surveillance programmes in such EMGs.
We also need to be aware that a large
proportion of diabetes patients followed up at public GOPCs are
from lower-income groups and the geriatric populations. Younger
Chinese T2DM patients might be more inclined to seek help from
Specialist Clinics and private doctors. Thus, these findings might
not be directly applicable to private or other specialist
settings. Nevertheless, the present findings suggest important
groundwork for further local and international studies.
The demographic characteristics of diabetes
patients within EMGs indicated that their gender ratios also
varied dramatically. Among Filipino patients, the M/F ratio was
0.31 and all Indonesian patients were female. By contrast, most
Pakistani, Indian, and Nepalese diabetes patients were male (M/F
ratios being 2.62, 1.51, and 1.35, respectively). These findings
were consistent with a thematic report on ethnic minorities in the
2011 HK population consensus, which showed considerable variations
in the gender composition of different ethnic groups in the
community3; the M/F ratios
of Indonesians and Filipinos were extremely low but the ratios
were converse among Pakistanis and Nepalese. This was because
large proportions of Filipinos and Indonesians in HK were foreign
domestic helpers, of whom 99% were female.3 On the contrary, most Nepalese and Pakistanis
worked in elementary occupations such as at construction sites or
as security guards, and most were males. This difference in gender
composition also contributed to a greater proportion of Nepalese
and Pakistanis being chronic smokers as compared with the other
Asian minorities. As the different age and sex distributions among
EMGs was an important confounder of clinical outcomes, no direct
comparison on diabetes control between different subgroups was
feasible. Nevertheless, we found that Pakistani diabetes patients
had particularly higher HbA1c levels and lower HDL concentrations.
Indeed, studies have shown that the epidemiology and determinants
of diabetes in Pakistan reveal a peculiar combination of risk
factors.13 Strong genetic
and environment factors interplay along with in-utero programming,
in the context of low birth weights and gestational diabetes
contributing to a high prevalence and poor control of T2DM in
Pakistanis.14 On the other
hand, Nepalese diabetes patients had suboptimal DBP control. This
finding is in line with World Health Organization reports that
Nepal has a high burden of HT and that the blood pressure control
rates have been poor due to the inadequate awareness and lack of
proper treatment.15 16 Local doctors should therefore pay particular
attention to the needs of different ethnic groups and offer a
flexible care package that reflects their physical, psychological,
social, and cultural needs and at the same time upholds their
autonomy, dignity, privacy, and personal choice.
Diabetes is a significant problem among
both the Chinese and EMGs in HK. It is important that government
officials, clinicians, and allied health workers understand the
evidence and implement strategies to address shortcomings
actively. Our local practice has emphasised empowering people with
diabetes to support their own care management by proper diet
control and active lifestyle strategies. In addition, concerted
efforts are needed to raise awareness of diabetes and disseminate
prevention messages to high-risk groups in collaboration with
their community opinion leaders. Nowadays, information,
interpretation, and advocacy services have been provided in HKHA
clinics, which is definitely a positive step towards improving
understanding of the disease among ethnic minority patients.
Meanwhile, our services should assimilate aspects of ethnicity and
culture, and implement culturally specific interventions to
improve diabetes control in HK EMGs.
Implications to the primary care
Family physicians are at the forefront of
T2DM management, and aim to achieve optimal metabolic control to
prevent macro- and micro-vascular complications. This study
provides important background information on the demographic
characteristics of diabetes patients from certain EMGs as compared
to Chinese diabetes patients. Since certain South Asian groups
tend to have poorer glycaemic control, culturally tailored health
care interventions are required to improve their general health
and chronic disease management.
Study limitations
One limitation was that only diabetes
patients who were regularly followed up in a single clinic and had
annual blood and urine checkups were studied. Second, the ethnic
composition in other clinics and elsewhere in HK might differ
considerably. Third, patients who were followed up at this clinic
but never attended for annual assessment (n=781, 14.1%), whatever
the reason, were excluded and must have given rise to a selection
bias. However, we have compared the major epidemiological
characteristics including age and gender of such patients and
found that there were no obvious differences between them and the
studied patients (P=0.45 and P=0.60, respectively). Fourth, all
variables were measured at least once during the 1-year study
period, and if more than one blood test was performed, the most
recent result was used for analysis. Therefore, variability of
measurements might have confounded the findings. Fifth, the
relatively small sample size of certain EMG subgroups and their
age and gender distribution discrepancies prevented direct
comparison of their metabolic control. Nevertheless, the present
results may lay the groundwork for similar studies in the future
both locally and internationally. Lastly, concomitant chronic
diseases (HT, IHD, and stroke) were retrieved via the ICPC code in
the CMS, and so inadequate ICPC coding may have underestimated
co-morbidity rates in both Chinese and EMG diabetes patients.
Conclusions
Ethnic minority groups are an integral part
of the HK population. Compared with Chinese diabetes patients, EMG
diabetes patients were much younger and more obese. Deficiencies
existed in their understanding of diabetes management,
particularly glycaemic control. Culturally tailored health care
interventions are therefore necessary to promote patient education
and clinical effectiveness for these patient groups and improve
their long-term health.
Acknowledgements
We extend our gratitude to Dr King Chan for
his continuous inspiration and support during this study. We also
thank Ms Elise Chan, EA III of Department of Family Medicine and
GOPC, for her patience during data entry and Mr Carl Chak,
statistical officer of Queen Elisabeth Hospital, for his expertise
and support in data analysis.
References
1. Chan JC, Malik V, Jia W, et al.
Diabetes in Asia: epidemiology, risk factors, and pathophysiology.
JAMA 2009;301:2129-40. CrossRef
2. Leung GM, Lam KS. Diabetic
complications and their implications on health care in Asia. Hong
Kong Med J 2000;6:61-8.
3. Hong Kong 2011 population census
thematic report: ethnic minorities. Available from:
http://www.statistics.gov.hk/pub/B11200622012XXXXB0100.pdf.
Accessed Dec 2012.
4. Abate N, Chandalia M. The impact
of ethnicity on type 2 diabetes. J Diabetes Complications
2003;17:39-58. CrossRef
5. McKeigue PM, Shah B, Marmot MG.
Relation of central obesity and insulin resistance with high
diabetes prevalence and cardiovascular risk in South Asians.
Lancet 1991;337:382-6. CrossRef
6. Khan NA, Wang H, Anand S, et al.
Ethnicity and sex affect diabetes incidence and outcomes. Diabetes
Care 2011;34:96-101. CrossRef
7. Gholap N, Davies M, Patel K,
Sattar N, Khunti K. Type 2 diabetes and cardiovascular disease in
South Asians. Prim Care Diabetes 2011;5:45-56. CrossRef
8. American Diabetes Association.
Diagnosis and classification of diabetes mellitus. Diabetes Care
2010;33(Suppl 1):S62-9. CrossRef
9. Levey AS, Bosch JP, Lewis JB,
Greene T, Rogers N, Roth D. A more accurate method to estimate
glomerular filtration rate from serum creatinine: a new prediction
equation. Modification of Diet in Renal Disease Study Group. Ann
Intern Med 1999;130:461-70. CrossRef
10. Chobanian AV, Bakris GL, Black
HR, et al. Seventh report of the Joint National Committee on
Prevention, Detection, Evaluation, and Treatment of High Blood
Pressure. Hypertension 2003;42:1206-52. CrossRef
11. Gatineau M, Mathrani S.
Obesity and ethnicity. Available from:
http://www.noo.org.uk/uploads/doc/vid_9444_Obesity_and_ethnicity_270111.pdf.
Accessed Jan 2011.
12. Gupta M, Singh N, Verma S.
South Asians and cardiovascular risk: what clinicians should know.
Circulation 2006;113:e924-9. CrossRef
13. Rees SD, Britten AC, Bellary
S, et al. The promoter polymorphism -232C/G of the PCK1
gene is associated with type 2 diabetes in a UK-resident South
Asian population. BMC Med Genet 2009;10:83. CrossRef
14. Samad S, Fatima J, Asma M.
Prevalence of diabetes in Pakistan. Diabetes Res Clin Pract
2007;76:219-22. CrossRef
15. WHO STEPS Surveillance: Non
Communicable Disease Risk Factors Survey. Kathmandu: Ministry of
Health and Population, Government of Nepal, Society for Local
Integrated Development Nepal (SOLID Nepal) and WHO; 2008.
16. Sharma D, Bkc M, Rajbhandari
S, et al. Study of prevalence, awareness, and control of
hypertension in a suburban area of Kathmandu, Nepal. Indian Heart
J 2006;58:34-7.