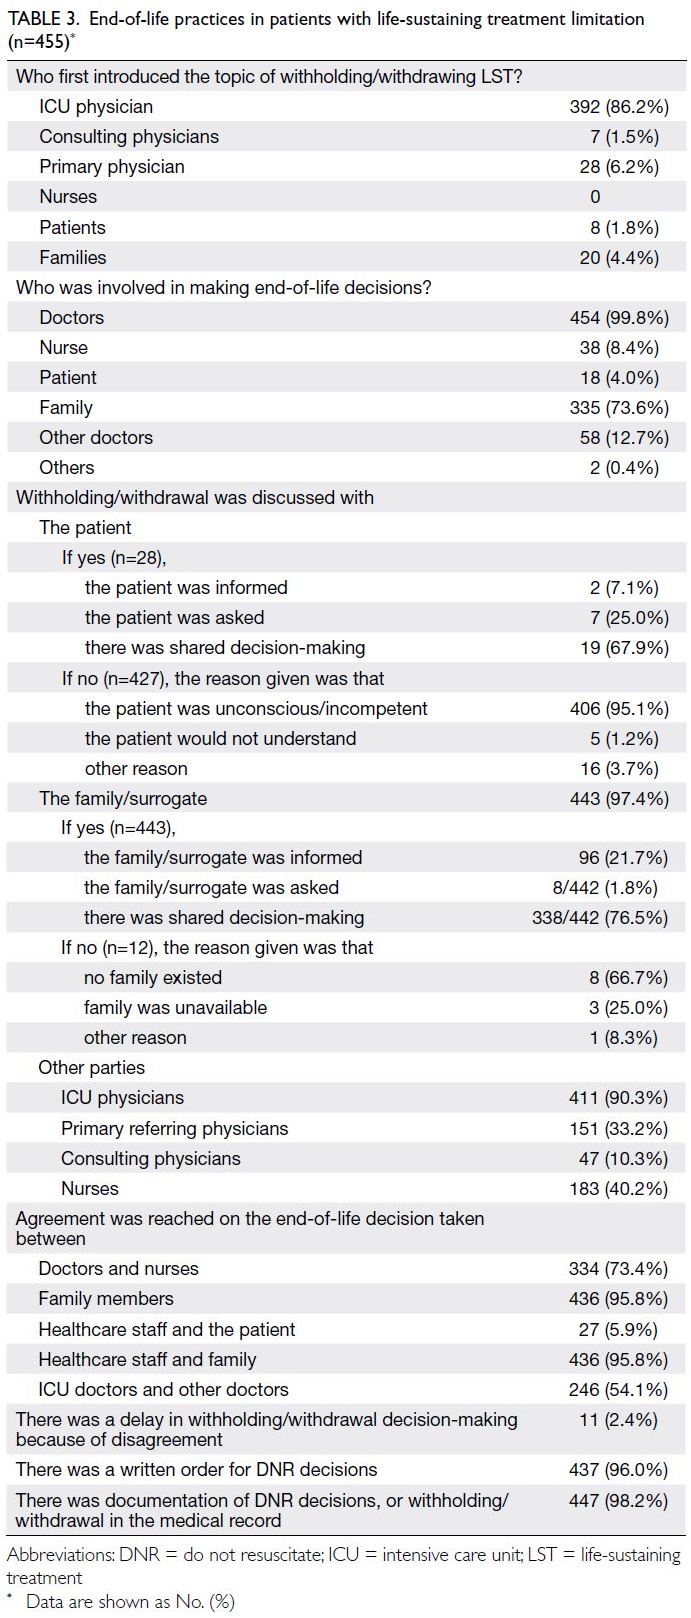
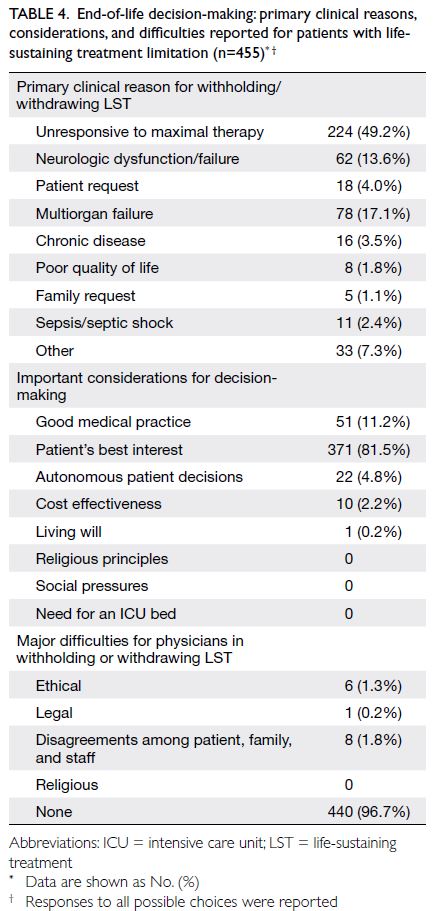
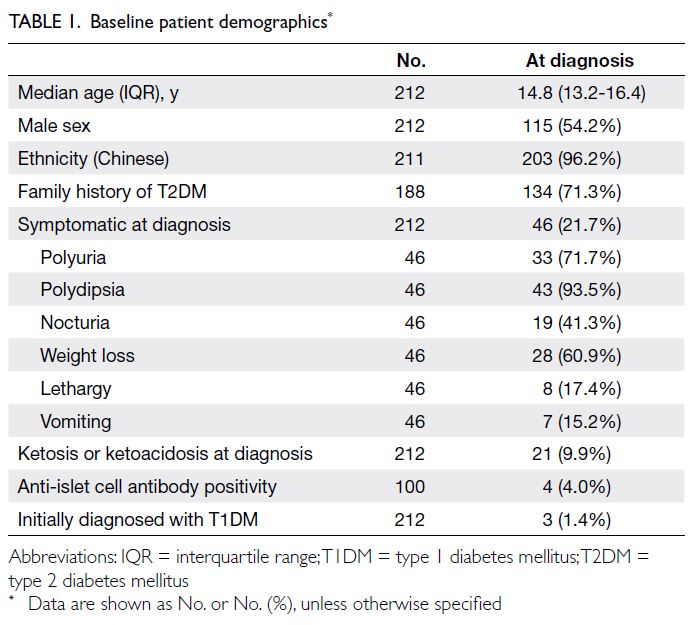
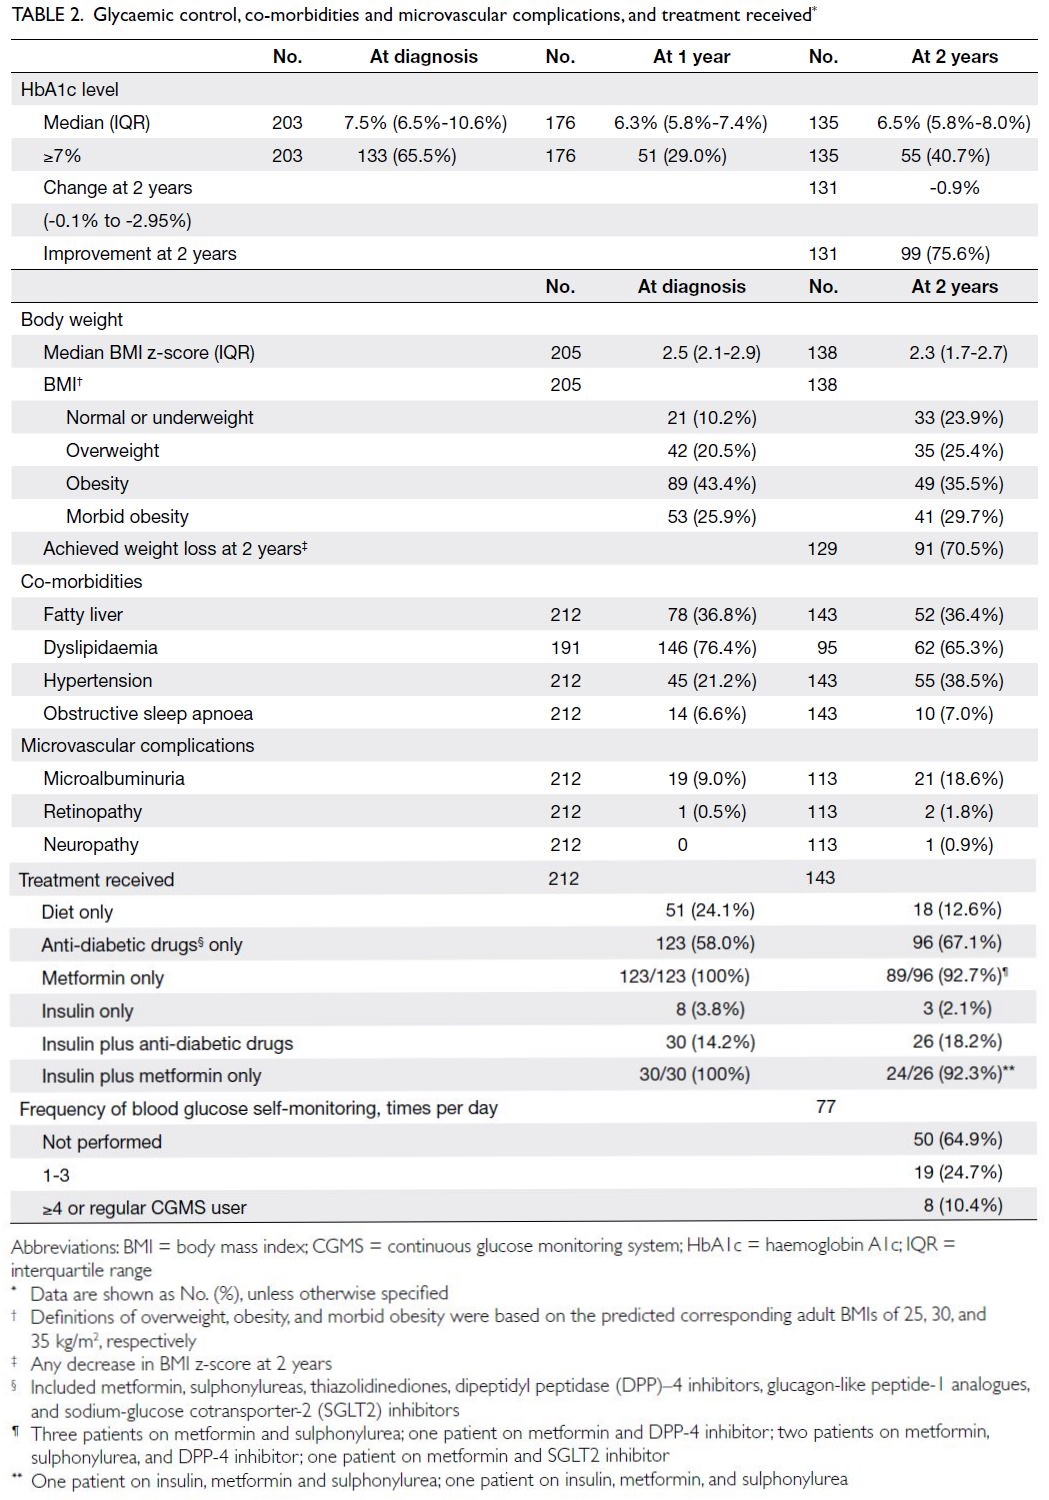
Paracetamol-induced hepatotoxicity after normal therapeutic doses in the Hong Kong Chinese population
Hong Kong Med J 2024 Oct;30(5):355–61 | Epub 10 Oct 2024
© Hong Kong Academy of Medicine. CC BY-NC-ND 4.0
ORIGINAL ARTICLE CME
Paracetamol-induced hepatotoxicity after normal therapeutic doses in the Hong Kong Chinese population
WH Tsang, MB, ChB, FHKAM (Emergency Medicine)1; CK Chan, FHKAM (Emergency Medicine), FHKCEM (Clinical Toxicology)2; ML Tse, FHKAM (Emergency Medicine), FHKCEM (Clinical Toxicology)2
1 Accident and Emergency Department, United Christian Hospital, Hong Kong SAR, China
2 Hong Kong Poison Information Centre, Hospital Authority, Hong Kong SAR, China
Corresponding author: Dr WH Tsang (tsanwh1@ha.org.hk)
 Full paper in PDF
Abstract
Introduction: Paracetamol is generally safe at
normal therapeutic doses of ≤4 g/day in adults.
However, paracetamol-induced hepatotoxicity after
normal therapeutic doses use has been reported. We
investigated the epidemiology of this adverse drug
reaction in the Hong Kong Chinese population.
Methods: This territory-wide retrospective
observational study included adult patients with
suspected paracetamol-induced hepatotoxicity
after normal therapeutic doses use from January
2011 to June 2022. We evaluated the demographic
characteristics; paracetamol dose, duration, and
reason for use; preexisting hepatotoxicity risk
factors; laboratory findings; and their relationship
with clinical outcomes.
Results: We identified 76 patients (median age:
74 years, 23 males) with suspected paracetamol-induced
hepatotoxicity after normal therapeutic
doses use. There were 14 cases with significant
clinical outcomes (five deaths and nine cases of acute
hepatic failure), with an incidence of 1.2 cases per
year. For patients with significant clinical outcomes,
they were significantly older (age >80 years), had
a lower body weight (<50 kg), exposed to longer
durations (>2 days) and higher daily doses (>3 g), and with higher proportion of malnutrition.
Conclusion: Paracetamol-induced hepatotoxicity
can occur at normal therapeutic doses in the Hong
Kong Chinese population. The identified risk factors
are consistent with international guidelines regarding
susceptible patients. Considering the widespread
local use of paracetamol and low incidence of severe
hepatotoxicity, the current dosage recommendations
are considered safe for the general population. For
susceptible patients, a reduced maximum dose of
≤3 g/day is recommended, with liver function and
serum paracetamol monitoring in place.
New knowledge added by this study
- Paracetamol can induce hepatotoxicity at normal therapeutic doses in high-risk groups.
- Dosage reduction to ≤3 g/day may reduce the incidence of serious liver injury.
- Physicians should consider a maximum dosage reduction from 4 g/day to 3 g/day in high-risk groups.
- High-risk groups included older age, lower body weight, malnutrition, exposure to longer duration of drug use, and higher daily dose.
Introduction
Paracetamol is a non-opioid analgesic recommended
as a first-line treatment for mild to moderate pain
and fever.1 It is one of the most widely used over-the-counter medications worldwide. In Hong
Kong, >600 registered pharmaceuticals contain
paracetamol.2 Adverse drug reactions in healthy
individuals are rare within the therapeutic dose
range. According to the British National Formulary,
the recommended daily dose of paracetamol is
4 g/day in divided doses for adults with body
weight ≥50 kg.3 Special precautions are needed for individuals with a high risk of hepatotoxicity,
including those with body weight <50 kg,
chronic alcoholism, chronic dehydration, chronic
malnutrition, hepatocellular insufficiency, and/or
concomitant use of P450 liver enzyme inducers
(eg, antituberculosis drugs, antiepileptic drugs, and
herbs/dietary supplements such as St John’s wort).
Paracetamol is metabolised through various
pathways in the liver. In healthy individuals taking
normal therapeutic doses, >90% of paracetamol
undergoes glucuronidation and sulphation, followed
by renal excretion.4 Only 5% to 10% is oxidised by cytochrome P450 to the toxic metabolite N-acetyl-p-benzoquinone imine, which is subsequently
neutralised by glutathione and undergoes renal
excretion. However, in cases of paracetamol overdose
or glutathione depletion, excessive production and
accumulation of N-acetyl-p-benzoquinone imine
in hepatocytes can result in acute liver injury.
N-acetylcysteine, the primary antidote in such
situations, acts by replenishing hepatic glutathione.5
Theoretically, paracetamol hepatotoxicity can occur
after normal therapeutic dose use in patients with
critically depleted glutathione levels.
There have been few reports of paracetamolinduced
hepatotoxicity after normal therapeutic
doses use.6 7 8 Most of these cases had at least one of
the aforementioned risk factors. In 2022, the United
Kingdom’s Healthcare Safety Investigation Branch
published a report recommending a prescription
alert for individuals with body weight <50 kg who
are prescribed paracetamol.9 The Queensland
Government’s Department of Health of Australia
also revised its paracetamol use guidelines,
recommending ≤3 g/day for adults with risk
factors such as advanced age or low body weight.10
When risk factors are present and treatment
continues beyond 48 hours, liver function test and
international normalised ratio (INR) monitoring is
recommended.10 The United States Food and Drug
Administration states that it is safe to consume
≤4 g of paracetamol within 24 hours,11 whereas the Irish Health Products Regulatory Authority
recommends ≤2 g of paracetamol for patients with
mild to moderate hepatic insufficiency or chronic
alcoholism.12
Isolated cases of paracetamol-induced
hepatotoxicity causing death or acute hepatic
failure after normal therapeutic doses use have been
reported to the Hong Kong Poison Information
Centre (HKPIC). However, no local reports have
been published concerning the incidence of this rare
adverse drug reaction in the Hong Kong population.
This study aimed to describe the epidemiology and
incidence of paracetamol-induced hepatotoxicity in
the Hong Kong Chinese population.
Methods
Study design
This territory-wide retrospective observational study
included adult patients with suspected paracetamol-induced
hepatotoxicity after normal therapeutic
doses use reported to the HKPIC from 1 January
2011 to 30 June 2022 (11.5 years in total).
Study setting and data sources
The HKPIC was the only poison control centre in
Hong Kong during the study period. This centre
provides round-the-clock phone consultations
regarding poisoning cases to local healthcare
professionals and receives voluntary reports of
poisoning from all public emergency departments.13 14
The HKPIC maintains an electronic database, the
Poison Information and Clinical Management
System (PICMS), that contains information about
all consultations and reports received. Clinical data
from consultations and reports are entered into
the PICMS by staff trained in clinical toxicology.14
The data source for this study consisted of data
retrieved from the PICMS. When PICMS data were
incomplete, supplementary data were retrieved
from the Hospital Authority’s electronic Patient
Record system, which contains all medical records
(ie, clinical data, laboratory results, and outcomes)
of patients treated in public hospitals in Hong Kong.
Study population
All cases of paracetamol poisoning recorded in the
PICMS during the study period were identified.
Exclusion criteria were applied to ensure the
inclusion of only adult patients with suspected
paracetamol-induced hepatotoxicity after normal
therapeutic doses use. These exclusion criteria
were age <18 years, intentional self-harm with
paracetamol, daily paracetamol consumption >4 g,
unknown paracetamol dose, co-ingestion with other
hepatotoxic drugs, or hepatotoxicity unrelated to
paracetamol.
Data collection
For the included cases, the following data were
collected: demographic characteristics including
age, sex, and ethnicity; duration of paracetamol use,
daily paracetamol dose, and reasons for paracetamol
use; risk factors including history of preexisting
liver disease, chronic alcoholism, use of P450 liver
enzyme-inducing medications, and malnutrition;
poisoning data including peak serum paracetamol
concentration, peak alanine transaminase (ALT)
level, peak INR, and receipt of N-acetylcysteine; and
clinical outcomes including death, acute liver failure,
mildly deranged liver function, and minimal effect.
Definitions
The diagnosis of paracetamol-induced hepatotoxicity
was established on the basis of compatible clinical
and biochemical features, excluding other causes
of deranged liver function (eg, acute viral hepatitis,
autoimmune causes, and other drug- or herb-induced
hepatitis). All cases were reviewed by at least one
clinical toxicologist working in the HKPIC. Clinical
outcomes were defined as follows: ‘death’ was defined
as poisoning-related death, as judged by a clinical
toxicologist, within 30 days after hospitalisation;
‘acute hepatic failure’ was defined as severe acute
liver injury with an ALT level >1000 IU/L, associated
with encephalopathy and impaired synthetic function
within 26 weeks15; ‘mildly deranged liver function’
was defined as a peak ALT level >2 times the upper
limit of normal, without encephalopathy or impaired
synthetic function; and ‘minimal effect’ was defined as
a peak ALT level <2 times the upper limit of normal,
along with normal mental status. ‘Significant clinical
outcome’ cases were those with a clinical outcome
of death or acute hepatic failure. Malnutrition was
defined as documented insufficient energy intake for
>1 week.16
Statistical analysis
Data were analysed using SPSS software (Windows version 29.0; IBM Corp, Armonk [NY], United
States). Continuous data were expressed as medians
(interquartile ranges); the Mann-Whitney U test
was used to compare the death and acute hepatic
failure groups with the minimal effect group.
Categorical variables were expressed as frequencies
and percentages; they were compared using the Chi
squared test or Fisher’s exact test, as appropriate. All
statistical tests were two-sided, and P values <0.05
were considered statistically significant. Due to the
small sample size and low incidence of significant
clinical outcomes, multivariable logistic regression
was not performed.
Results
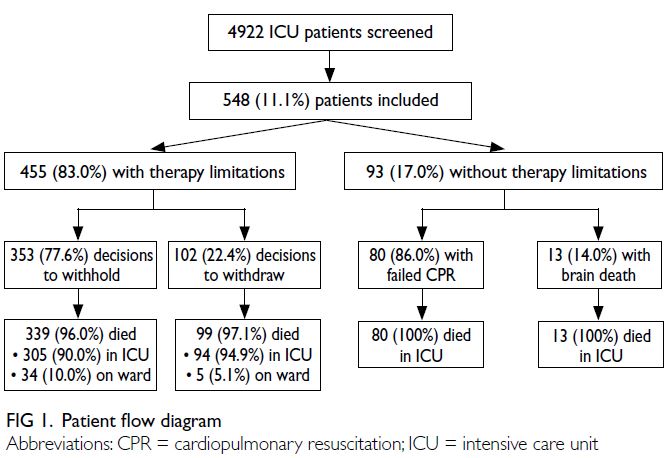
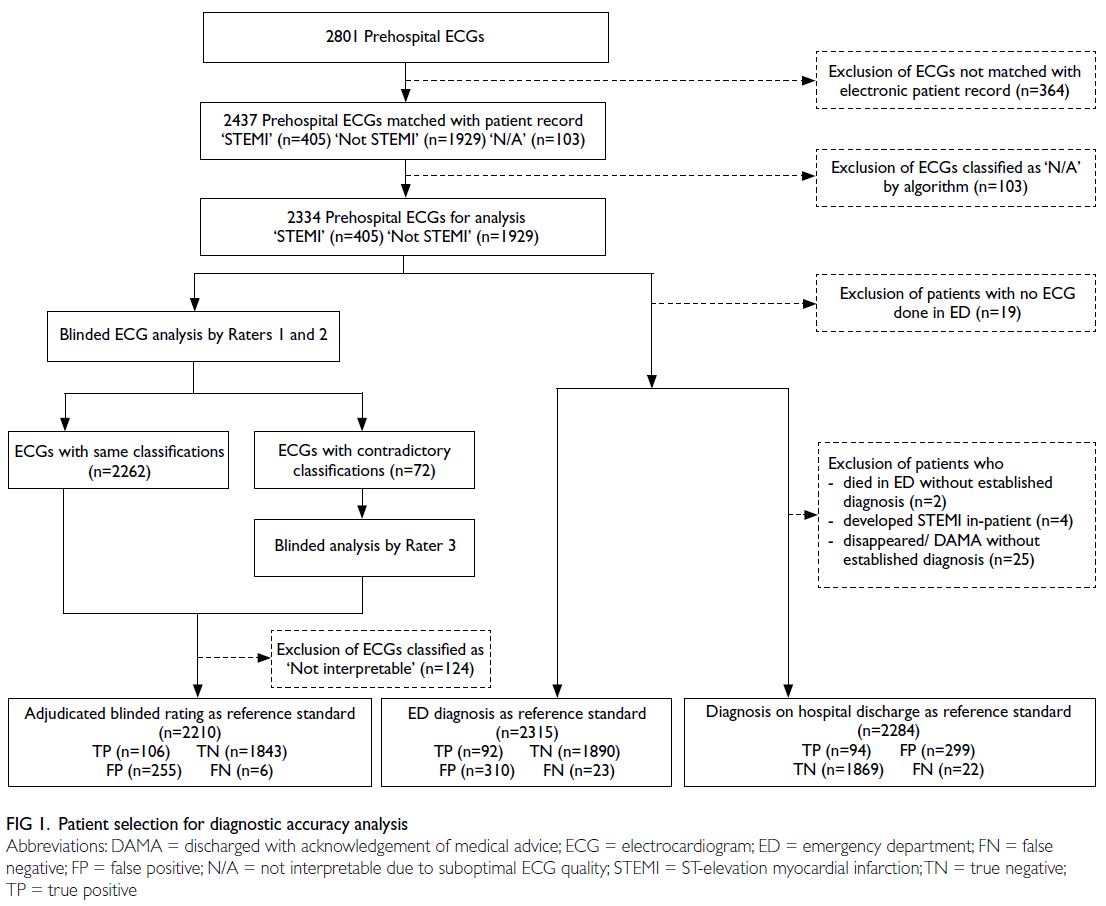
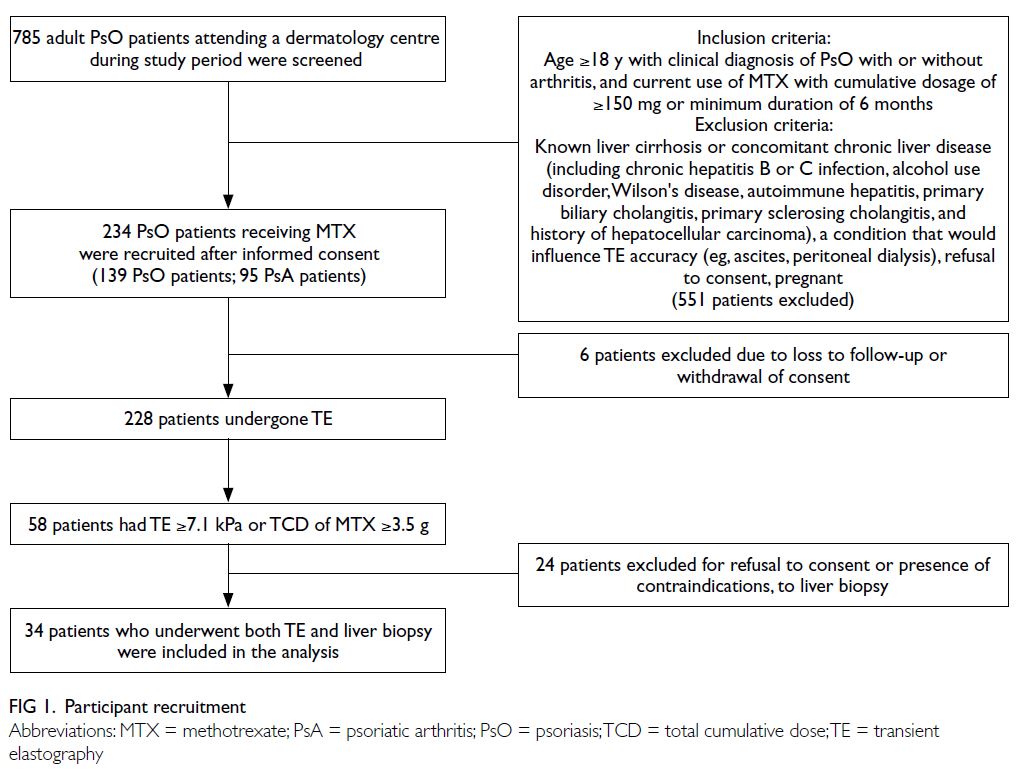
Within the study period, 3873 cases of paracetamol poisoning were identified. Reasons for exclusion
were intentional paracetamol poisoning, age <18
years, other causes of deranged liver function, daily
paracetamol dose >4 g, and unknown paracetamol
dose (Fig). In total, 76 patients were included in the
analysis; these patients were grouped according to
clinical outcomes. During the study period, five
patients died, nine patients developed acute hepatic
failure, one patient developed mildly deranged
liver function without coagulopathy or altered
mental status, and 61 patients showed minimal
effect; no patients underwent liver transplantation.
The incidence of significant clinical outcomes
(including death and acute hepatic failure) was 1.2
cases per year. Baseline demographic and clinical
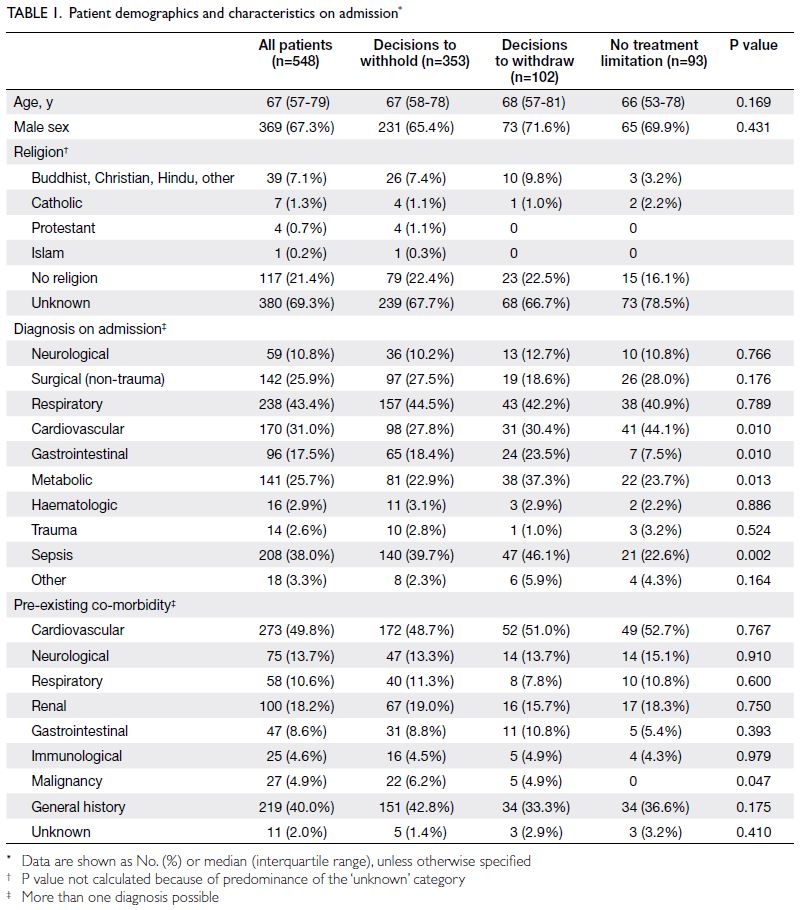
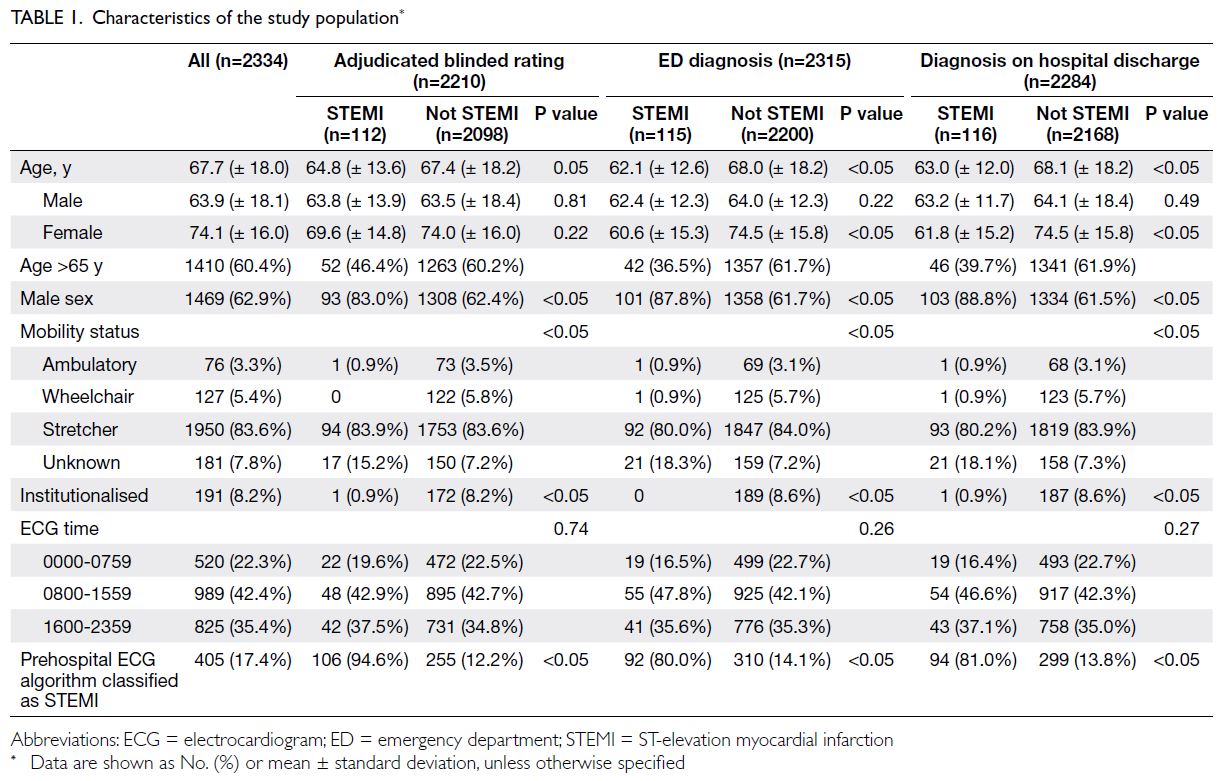
characteristics are summarised in Table 1.
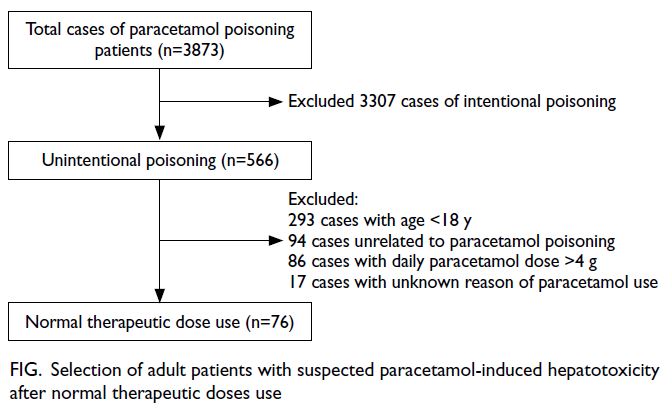
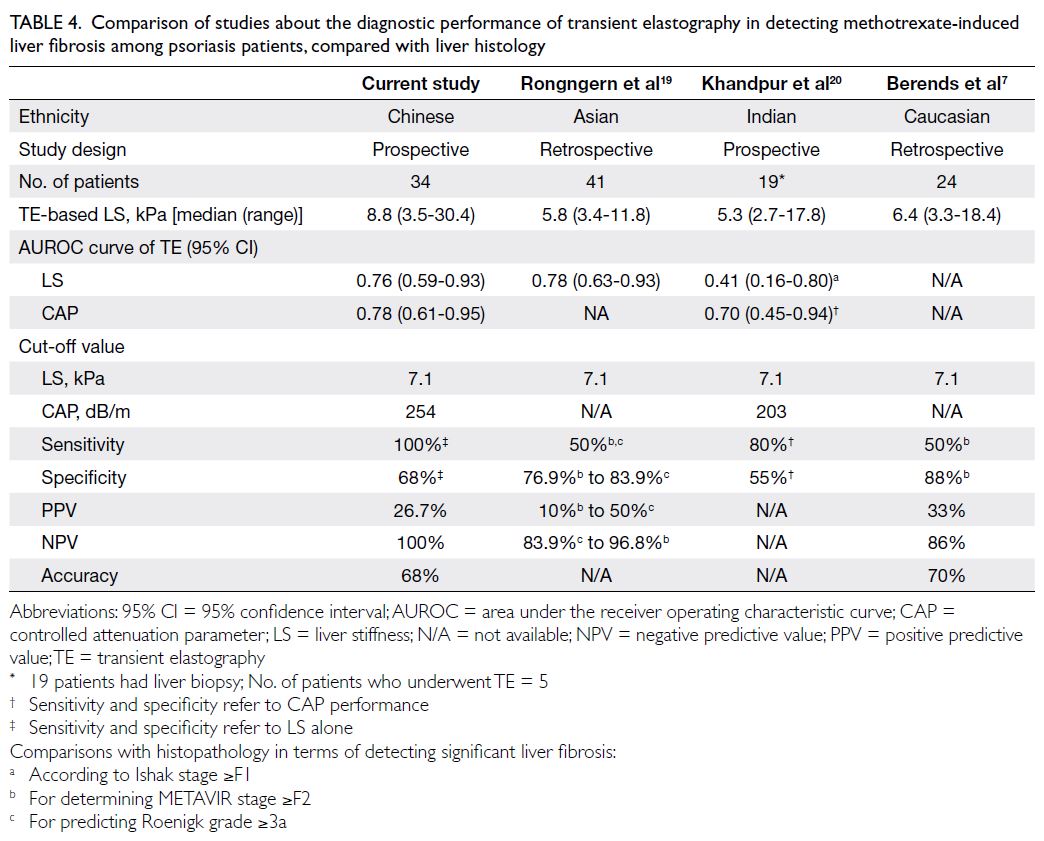
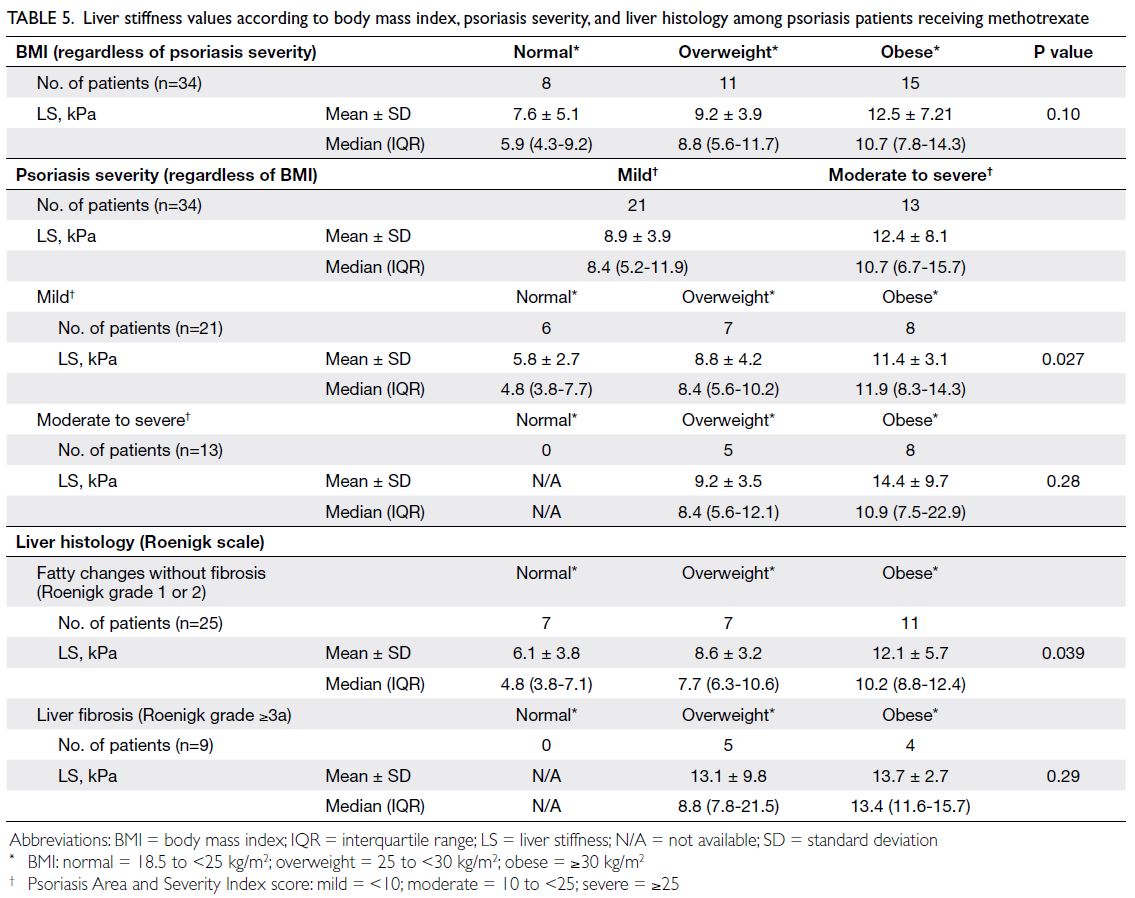
Figure. Selection of adult patients with suspected paracetamol-induced hepatotoxicity after normal therapeutic doses use
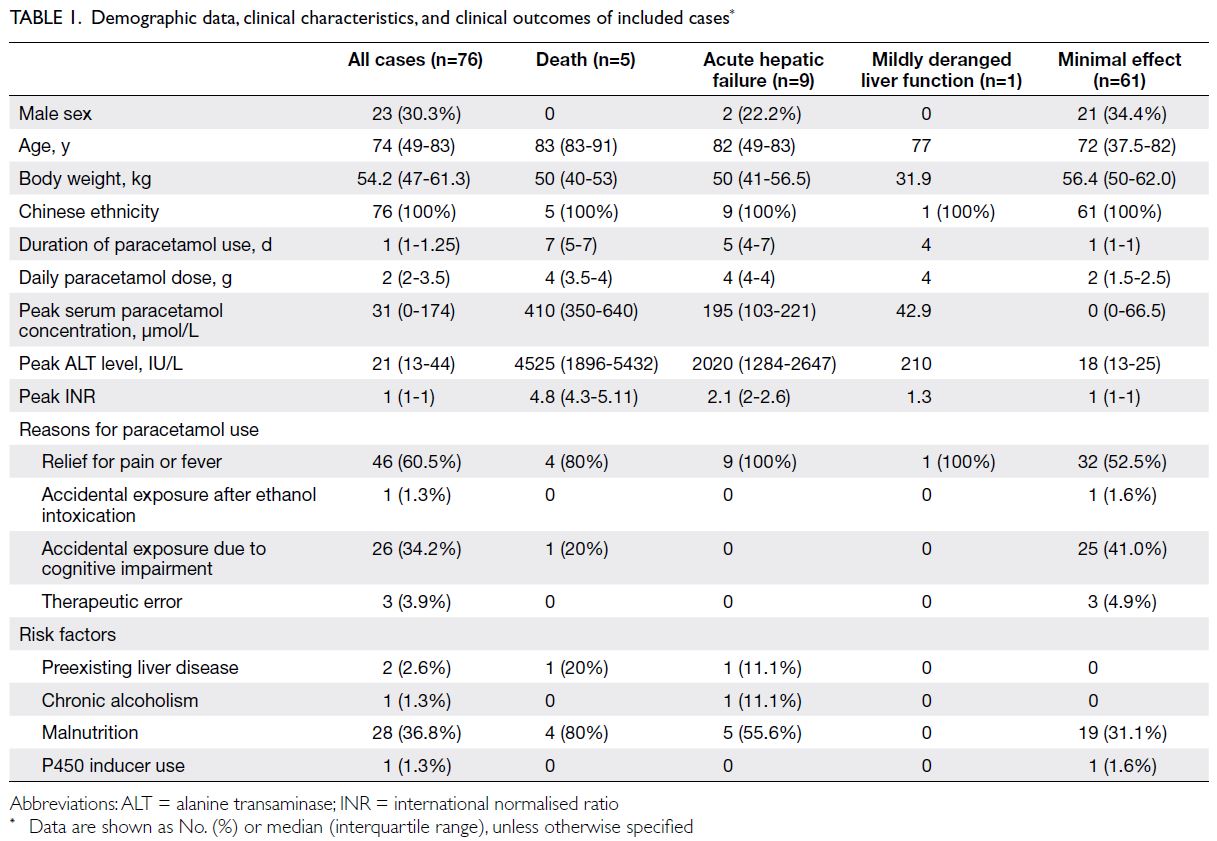
Table 1. Demographic data, clinical characteristics, and clinical outcomes of included cases
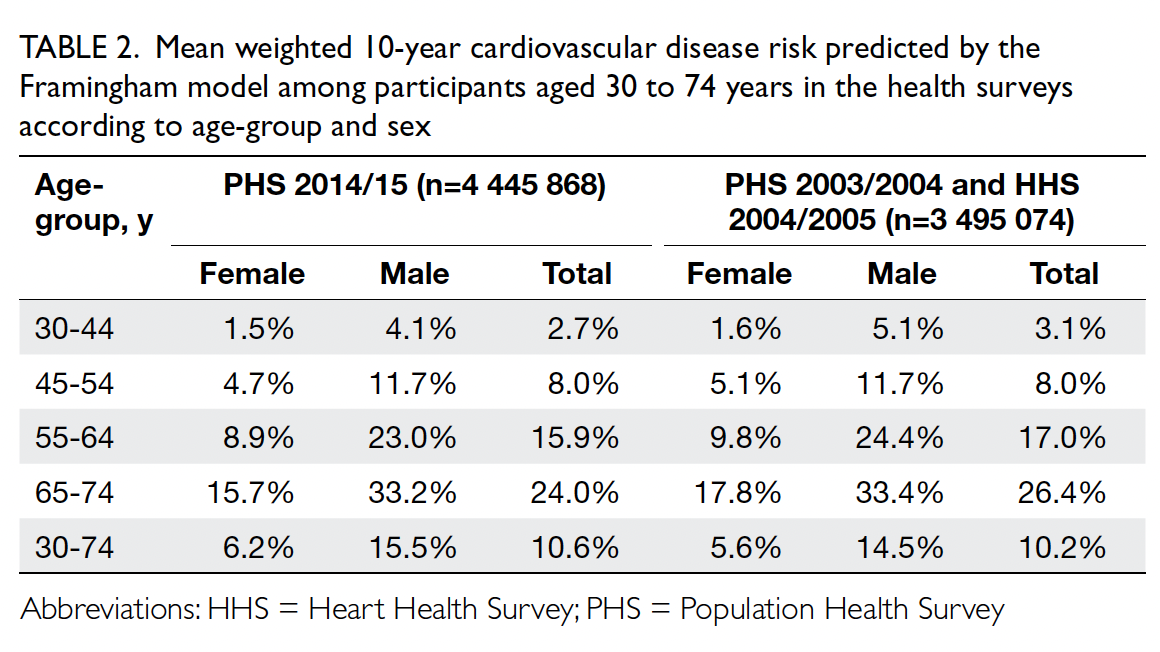
Most patients were women (69.7%). The
median age was 74 years and the median body weight
was 54.2 kg. All patients were of Chinese ethnicity.
Compared with the minimal effect group, patients
in the death group were older (median age: 83 vs 72
years; P=0.003), had a longer duration of paracetamol
use [median duration: 7 vs 1 day(s); P=0.001], and
had a higher daily paracetamol dose (median dose:
4 vs 2 g; P=0.004). Their body weights tended to
be lower, but this difference was not statistically
significant (median: 50 vs 56.4 kg; P=0.11). Moreover,
a higher percentage of patients in the death group
suffered from malnutrition (80% vs 31.1%; P=0.04),
and their peak serum paracetamol concentrations
were higher (median peak concentration: 410 vs
0 μmol/L; P<0.001), exceeding the normal range of
<130 μmol/L despite the use of normal therapeutic
doses (Table 1).
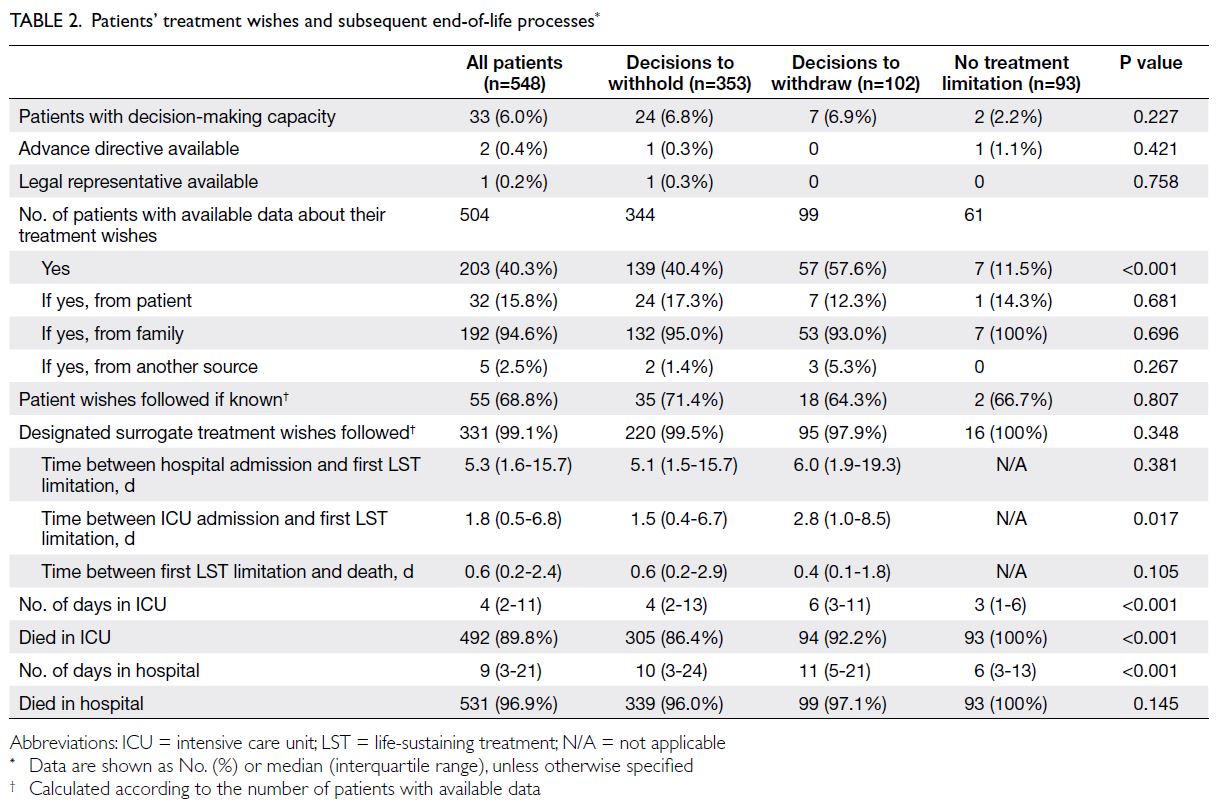
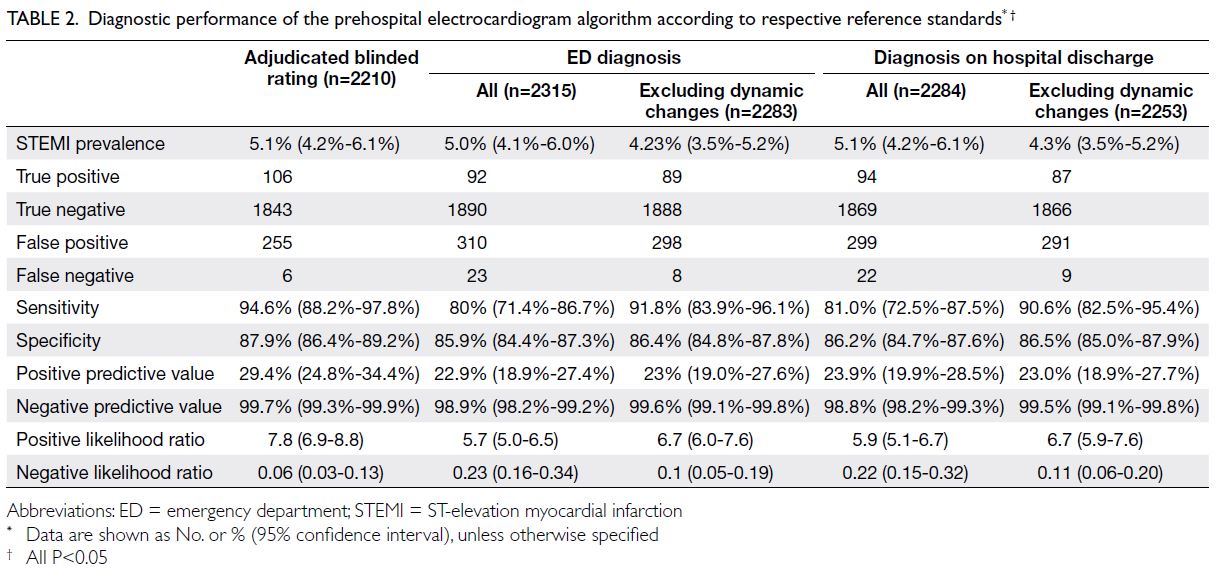
Patients with significant clinical outcomes
were evaluated by combining the death and
acute hepatic failure groups. Five risk factors for
significant clinical outcomes were identified, namely, age >80 years (odds ratio [OR]=7.2, 95% confidence
interval [CI]=2.0-26.2), body weight <50 kg (OR=3.8,
95% CI=1.0-12.1), duration of paracetamol use
>2 days (OR=16.9, 95% CI=2.1-136.9), daily
paracetamol dose >3 g (OR=7.2, 95% CI=2.0-26.2),
and malnutrition (OR=4.07, 95% CI=1.2-13.8). A
summary of the risk factors is provided in Table 2.
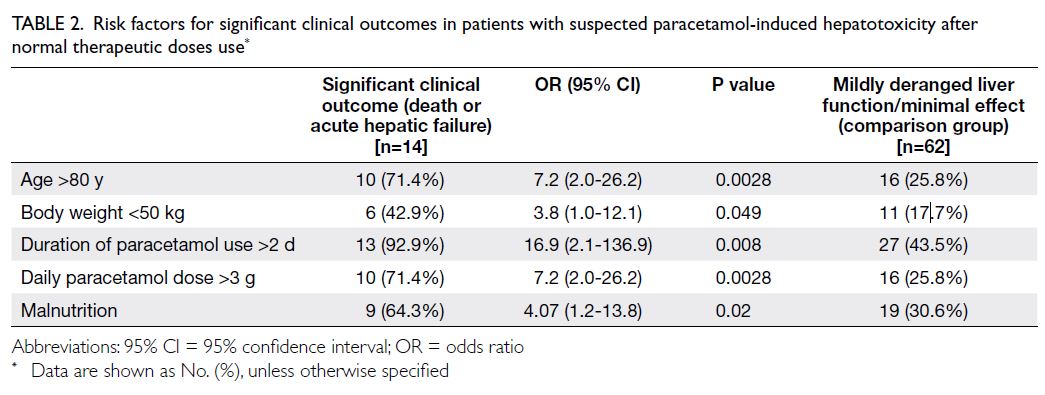
Table 2. Risk factors for significant clinical outcomes in patients with suspected paracetamol-induced hepatotoxicity after normal therapeutic doses use
Discussion
The maximum recommended daily dose of
paracetamol for healthy adults is 4 g/day in
divided doses.17 As one of the most widely used
analgesics worldwide for decades, this dosage
recommendation is considered safe and generally
has not been questioned by most healthcare
professionals. Physicians have been taught to
use the convenient dosing of 1-g paracetamol
four times daily as a first-line analgesic in adults.
Historically, paracetamol-induced hepatotoxicity
was solely regarded as a consequence of overdose.
Paracetamol-induced hepatotoxicity after normal
therapeutic doses use was considered a therapeutic
misadventure of doubtful existence.7 However, case reports of this adverse drug reaction were
published.6 7 8 The situation becoming clear after a
single-blind randomised controlled trial by Watkins
et al18 revealed elevated ALT levels in 40% of healthy
individuals who had received 4 g/day of paracetamol
for 2 weeks. Subsequent studies confirmed this
observation and showed that continuous use of
paracetamol by individuals with high ALT levels
did not result in hepatotoxicity.19 20 Their ALT levels
returned to baseline after continuous paracetamol
use, suggesting hepatic adaptation.21 Nevertheless,
the mechanisms underlying hepatic adaptation are
not fully understood, and paracetamol-induced
hepatotoxicity after normal therapeutic doses use
may represent a rare adverse drug reaction due to
failed hepatic adaptation. In a prospective study in
Spain,22 the incidence of this adverse drug reaction
was estimated to be 10 per million paracetamol
users-year (95% CI=4.3-19.4). Prior to the present
study, there has been little information on how often
paracetamol-induced hepatotoxicity occurs in the
Hong Kong Chinese population.
Our study confirmed the existence of this rare
adverse drug reaction, with an incidence of 1.2 cases of significant clinical outcomes per year in the Hong
Kong population (approximately 7 million people).
Because the vast majority of the local population is
served by public hospitals included in our poisoning
surveillance protocol, we believed that this figure
accurately reflects the rare occurrence of this adverse
drug reaction. Concerning patient characteristics
predictive of significant clinical outcomes, we found
that age >80 years, body weight <50 kg, duration of
paracetamol use >2 days, daily paracetamol dose
>3 g, and malnutrition were associated with a
higher risk of paracetamol-induced hepatotoxicity
leading to death or acute hepatic failure. The median
daily dose was 4 g of paracetamol, consistent with
the convenient maximum therapeutic dosing (eg,
1 g four times daily) for adults. Additionally, the
median duration of paracetamol use was 5 to 7
days, indicating that life-threatening paracetamol-induced
hepatotoxicity can develop and rapidly
progress within a few days in susceptible individuals
receiving convenient paracetamol dosing. The
supratherapeutic serum paracetamol concentrations
detected in these cases provide evidence of impaired
hepatic paracetamol metabolism, leading to gradual
accumulation of paracetamol within the body. The
subsequent pathophysiology of hepatotoxicity
is considered identical to that of paracetamol
overdose. Therefore, the use of the antidote Nacetylcysteine
is recommended in all identifiable
cases of paracetamol-induced hepatotoxicity after
normal therapeutic doses use.
One argument against the existence of this
adverse drug reaction has been the accuracy of
documentation concerning paracetamol dosage.7
Because the clinical presentation of paracetamol-induced
hepatotoxicity is indistinguishable from
that of paracetamol overdose, it has been suggested
that the hepatotoxicity cases actually represent
undeclared or undiagnosed instances of paracetamol
overdose, which are more common in clinical
practice. The present findings exclude this possibility.
All five patients who died had exhibited normal liver function upon or prior to hospital admission; they
were prescribed therapeutic doses of paracetamol for
various indications during their inpatient stay. The
possibility of intentional or accidental paracetamol
overdose was excluded in each case.
The association between older age and
paracetamol-induced hepatotoxicity has been
addressed in previous studies. In 2021, a prospective
study by Louvet et al23 showed that older age was
an important risk factor associated with acute
liver injury after therapeutic doses of paracetamol.
Paracetamol pharmacokinetics in older adults
reportedly differ from those in younger adults.
Although absorption from the gastrointestinal tract
is not significantly reduced, paracetamol clearance is
46.8% lower in frail older individuals than in healthy
older individuals.24 In another observational study,25
the effects of ageing and frailty on serum paracetamol
and ALT levels were assessed in hospitalised patients
after continuous exposure to therapeutic doses for
5 days. The results showed that serum paracetamol
concentrations were higher in older frail patients.25
Limitations
This study had some limitations. First, its
retrospective nature required reliance on the accuracy
and completeness of medical records. Incomplete
information in medical records, particularly missing
data concerning the daily dose and duration of
paracetamol exposure, could substantially affected
the results. Second, because all consultations were
voluntarily reported, underreporting may contribute
to reporting bias. Third, the sample size was relatively
small, hindering analysis of confounders via logistic
regression. Finally, the effects of some potential risk
factors (eg, chronic alcoholism and concomitant use
of P450 inducer) could not be quantified due to their
low reported incidence and the small sample size.
Conclusion
Paracetamol-induced hepatotoxicity can occur at normal therapeutic doses in the Hong Kong
Chinese population. Our study identified risk
factors associated with significant clinical outcomes.
Considering the widespread use of paracetamol
in Hong Kong, the incidence of paracetamol-induced
hepatotoxicity is low; current dosage
recommendations are considered safe for the vast
majority of the general population. Nevertheless, a
maximum daily dose of ≤3 g is recommended for
susceptible patients. Paracetamol dosage, especially
if consumed at 4 g/day for >48 hours, should be
reviewed; liver function and INR monitoring should
be considered in susceptible patients.10
Author contributions
Concept or design: All authors.
Acquisition of data: WH Tsang.
Analysis or interpretation of data: WH Tsang, CK Chan.
Drafting of the manuscript: WH Tsang.
Critical revision of the manuscript for important intellectual
content: WH Tsang, CK Chan.
All authors had full access to the data, contributed to the study, approved the final version for publication, and take responsibility for its accuracy and integrity.
Conflicts of interest
All authors have disclosed no conflicts of interest.
Funding/support
This research received no specific grant from any funding agency in the public, commercial, or not-for-profit sectors.
Ethics approval
This research was approved by the Kowloon Central / Kowloon East Cluster Research Ethics Committee of Hospital Authority, Hong Kong (Ref No.: KC/KE-23-0041/ER-4). The
requirement for informed patient consent was waived by the
Committee due to the retrospective nature of the research
and the use of anonymised data in the research.
References
1. Finnerup NB. Nonnarcotic methods of pain management.
N Engl J Med 2019;380:2440-8. Crossref
2. Drug Office, Department of Health, Hong Kong SAR
Government. List of Registered Over-the-counter
Pharmaceutical Products Containing Paracetamol. May
2023. Available from: https://www.drugoffice.gov.hk/eps/
do/en/doc/List_of_registered_pharmaceutical_products_
containing_paracetamol.pdf. Accessed 17 Sep 2023.
3. Joint Formulary Committee. Paracetamol. In: British
National Formulary. 78th ed. London: BNF Publications; 2019.
4. Burns MJ, Friedman SL, Larson AM. Acetaminophen
(paracetamol) poisoning in adults: pathophysiology,
presentation, and evaluation. August 2024. Available from:
https://www.uptodate.com/contents/acetaminophen-paracetamol-poisoning-in-adults-pathophysiology-presentation-and-evaluation. Accessed 16 Sep 2024.
5. Prescott LF, Illingworth RN, Critchley JA, Stewart MJ, Adam RD, Proudfoot AT. Intravenous N-acetylcysteine: the
treatment of choice for paracetamol poisoning. Br Med J 1979;2:1097-100. Crossref
6. Kurtovic J, Riordan SM. Paracetamol-induced hepatotoxicity at recommended dosage. J Intern Med 2003;253:240-3. Crossref
7. Prescott LF. Therapeutic misadventure with paracetamol:
fact or fiction? Am J Ther 2000;7:99-114. Crossref
8. Dom AM, Royzer R, Olson-Chen C. Malnourishment-associated
acetaminophen toxicity in pregnancy. Obstet
Gynecol 2021;137:877-80. Crossref
9. Health Services Safety Investigations Body. Investigation
report: unintentional paracetamol overdose in adult
inpatients with low bodyweight. February 2022. Available
from: https://www.hsib.org.uk/investigations-and-reports/unintentional-overdose-of-paracetamol-in-adults-with-low-bodyweight/unintentional-paracetamol-overdose-in-adult-inpatients-with-low-bodyweight/. Accessed 17 Sep 2023.
10. State of Queensland (Queensland Health), Queensland
Government, Australia. Guideline for Safe Paracetamol
Use. January 2023. Available from: https://www.health.qld.gov.au/__data/assets/pdf_file/0016/1211443/guideline-safe-paracetamol-use.pdf. Accessed 17 Sep 2023.
11. US Food and Drug Administration. FDA Drug Safety
Communication: prescription acetaminophen products
to be limited to 325 mg per dosage unit; boxed warning
will highlight potential for severe liver failure. Available
from: https://www.fda.gov/drugs/drug-safety-and-availability/fda-drug-safety-communication-prescription-acetaminophen-products-be-limited-325-mg-dosage-unit. Accessed 1 Oct 2024.
12. Health Products Regulatory Authority. Summary of
product characteristics. Available from: https://www.hpra.ie/img/uploaded/swedocuments/Licence_PA22749-005-001_22072022162254.pdf. Accessed 1 Oct 2024.
13. Hong Kong Poison Control Centre, Hospital Authority.
Hong Kong Poison Information Centre. 2024. Available
from: https://www.pcc.org.hk/en-US/units/hk-poison-information-centre/. Accessed 2 Oct 2024.
14. Chow TY, Chan CK, Ng SH, Tse ML. Hong Kong Poison
Information Centre: annual report 2020. Hong Kong J
Emerg Med 2023;30:117-30. Crossref
15. Goldberg E, Chopra S, Rubin JN. Acute liver failure in
adults: etiology, clinical manifestations, and diagnosis.
December 2020. Available from: https://www.medilib.ir/uptodate/show/3574. Accessed 16 Sep 2024.
16. Bellanti F, Lo Buglio A, Quiete S, Vendemiale G.
Malnutrition in hospitalized old patients: screening and
diagnosis, clinical outcomes, and management. Nutrients
2022;14:910. Crossref
17. Drug Office, Department of Health, Hong Kong SAR
Government. Tips for using medicines containing
paracetamol. December 2023. Available from: https://www.drugoffice.gov.hk/eps/do/en/consumer/news_informations/knowledge_on_medicines/paracetamol.html. Accessed 16 Sep 2024.
18. Watkins PB, Kaplowitz N, Slattery JT, et al.
Aminotransferase elevations in healthy adults receiving 4
grams of acetaminophen daily: a randomized controlled
trial. JAMA 2006;296:87-93. Crossref
19. Heard K. Asymptomatic alanine aminotransferase
elevations with therapeutic doses of acetaminophen. Clin Toxicol (Phila) 2011;49:90-3. Crossref
20. Heard K, Green JL, Anderson V, Bucher-Bartelson B,
Dart RC. A randomized, placebo-controlled trial to
determine the course of aminotransferase elevation
during prolonged acetaminophen administration. BMC
Pharmacol Toxicol 2014;15:39. Crossref
21. Sonn BJ, Heard KJ, Heard SM, et al. Metabolomic markers
predictive of hepatic adaptation to therapeutic dosing of
acetaminophen. Clin Toxicol (Phila) 2022;60:221-30. Crossref
22. Sabaté M, Ibáñez L, Pérez E, et al. Paracetamol in therapeutic
dosages and acute liver injury: causality assessment in a prospective case series. BMC Gastroenterol 2011;11:80. Crossref
23. Louvet A, Ntandja Wandji LC, Lemaître E, et al. Acute
liver injury with therapeutic doses of acetaminophen: a
prospective study. Hepatology 2021;73:1945-5. Crossref
24. Mian P, Allegaert K, Spriet I, Tibboel D, Petrovic M.
Paracetamol in older people: towards evidence-based
dosing? Drugs Aging 2018;35:603-24. Crossref
25. Mitchell SJ, Hilmer SN, Murnion BP, Matthews S.
Hepatotoxicity of therapeutic short-course paracetamol
in hospital inpatients: impact of ageing and frailty. J Clin
Pharm Ther 2011;36:327-35. Crossref