Success rate of induction of labour in twin pregnancies relative to singleton pregnancies in a predominantly Chinese population
Hong Kong Med J 2025 Feb;31(1):24–31 | Epub 12 Feb 2025
© Hong Kong Academy of Medicine. CC BY-NC-ND 4.0
ORIGINAL ARTICLE CME
Success rate of induction of labour in twin pregnancies relative to singleton pregnancies in a predominantly Chinese population
CK Wong, MB, ChB, FHKAM (Obstetrics and Gynaecology); Catherine MW Hung, MB, ChB, FHKAM (Obstetrics and Gynaecology); Vivian KS Ng, MB, ChB, FHKAM (Obstetrics and Gynaecology); WK Yung, MB, BS, FHKAM (Obstetrics and Gynaecology); WC Leung, MD, FHKAM (Obstetrics and Gynaecology); WL Lau, MB, BS, FHKAM (Obstetrics and Gynaecology)
Department of Obstetrics and Gynaecology, Kwong Wah Hospital, Hong Kong SAR, China
Corresponding author: Dr CK Wong (wck936@ha.org.hk)
 Full paper in PDF
Abstract
Introduction: This study assessed the efficacy of
induction of labour in twin pregnancies relative
to singleton pregnancies within a predominantly
Chinese patient population.
Methods: This retrospective case-matched cohort
study included patients with twin pregnancies who
underwent induction of labour at our institution in
Hong Kong between 2012 and 2020. Patients with
twin pregnancies were matched one-to-one with
singleton pregnancies based on parity, maternal
age, and the indication for induction of labour. The
primary outcome was the mode of delivery. Secondary
outcomes included the time from oxytocin infusion
to delivery, indications for caesarean or instrumental
delivery, and maternal and neonatal outcomes.
Results: In total, 160 women with twin pregnancies
met the inclusion criteria and were matched with
160 singleton pregnancies. Caesarean section
was performed in 42 patients (26.3%) with twin
pregnancies and 27 patients (16.9%) with singleton
pregnancies undergoing induction of labour.
Patients with twin pregnancies had a significantly
higher risk of caesarean section relative to those
with singleton pregnancies (odds ratio=2.14, 95%
confidence interval=1.14-4.04; P=0.024). Internal podalic version was required in 13.6% of cases for
the vaginal delivery of the second twin. There was no
significant difference between the groups in the time
from oxytocin administration to vaginal delivery
(P=0.143).
Conclusion: Despite a higher induction failure
rate, about three quarters of twin pregnancy
patients achieved successful vaginal deliveries.
Our findings inform decision making for patients
and obstetricians, emphasising the importance of
training for internal podalic version to aid second
twin delivery and reduce caesarean rates in twin
pregnancies.
New knowledge added by this study
- Approximately three-quarters of patients with twin pregnancies who underwent induction of labour achieved successful vaginal deliveries.
- The failure rate of induction of labour was higher in twin pregnancies than in singleton pregnancies.
- The probability of requiring a caesarean section for the second twin when the first twin is delivered vaginally is only 0.8% if experts in twin vaginal delivery are available. Internal podalic version was necessary in 13.6% of cases for the vaginal delivery of the second twin.
- Patients with twin pregnancies undergoing induction of labour should be counselled regarding the increased risk of unsuccessful labour induction relative to singleton pregnancies.
- Proficient obstetricians skilled in internal podalic version should be readily available during the delivery of the second twin to improve the success rate of vaginal delivery for the second twin.
- Greater emphasis should be placed on implementing training opportunities, simulation models, and practices for junior obstetricians to enhance proficiency in internal podalic version. These measures can facilitate second twin delivery and reduce the need for caesarean sections in second twin births.
Introduction
The global twin birth rate has increased by one-third
since the 1980s, rising from 9.1 to 12 per
1000 deliveries, resulting in approximately 1.6
million twin pairs born annually.1 One major factor contributing to this trend is the growing
use of assisted reproductive techniques in recent
decades.1 Relative to singleton pregnancies, twin
pregnancies are associated with higher incidences
of maternal and fetal complications, which may require earlier delivery.2 3 Even in uncomplicated
cases, the National Institute for Health and Care
Excellence (NICE) guidelines recommend delivery
at 37 weeks for dichorionic twin pregnancies and
36 weeks for monochorionic twin pregnancies.4
Consequently, earlier delivery is frequently required
in twin pregnancies. The Twin Birth Study,5 a large
multicentre randomised controlled trial published
in 2013, demonstrated the safety of both vaginal and
caesarean birth in twin pregnancies where the first
twin presented in cephalic position at 32 weeks of
gestation or later. These findings have supported an
increase in vaginal deliveries for twin pregnancies
through induction of labour.
The success rate, benefits, and complications
associated with induction of labour in singleton
pregnancies have been extensively studied.6 7
However, only a limited number of studies have
compared the success rate of induction of labour in
twin pregnancies relative to singleton pregnancies.8 9 10 11
According to Loscul et al8 and Okby et al,9 induction
of labour in twin pregnancies increases the likelihood
of caesarean section. In contrast, Fausett et al10 and
Taylor et al11 reported that the risk of caesarean delivery in twin pregnancies is comparable to the
risk in singleton pregnancies undergoing induction
of labour. These conflicting findings may arise from
variations in induction methods, ethnicity-related
factors, selection biases, and differences in study
designs.
To provide appropriate counselling to patients, obstetricians must understand the likelihood of
vaginal delivery after induction of labour. Reliance
on data from singleton deliveries to estimate this
likelihood for twin pregnancies may be inappropriate
due to inherent differences between twin and
singleton pregnancies.12 Considering the current
lack of robust evidence regarding induction of labour
in twin pregnancies, this study aimed to evaluate
the rate of caesarean section (including classical or
lower segment caesarean sections) and associated
outcomes in twin pregnancies undergoing induction
of labour, compared with singleton pregnancies.
Methods
Study design
Our institution, a regional public hospital in Hong
Kong, provides obstetric services for 3000 to 5000
deliveries annually. All cases of twin pregnancies are
recorded in a specialised twin pregnancy clinic registry
and managed by a dedicated team of obstetricians
and midwives in the Twin Pregnancy Clinic. The
medical professionals overseeing this clinic have
specialised expertise in maternal fetal medicine.13
In accordance with departmental protocol, patients
attend regular follow-up appointments and
undergo ultrasound examinations. When a patient
approaches term or requires earlier delivery, the
attending obstetrician discusses the mode of delivery
with the patient. For uncomplicated dichorionic-diamniotic
and monochorionic-diamniotic twin
pregnancies, vaginal delivery is encouraged if the
first twin presents in cephalic position.
The same induction of labour protocol is
applied to both twin and singleton pregnancies.
Patients are admitted to the hospital and a cervical
examination is conducted to assess the modified
Bishop score. If the cervix is unfavourable with a
modified Bishop score (Calder score) <6, cervical
priming is performed using either dinoprostone
tablets or a cervical ripening balloon (Cook Medical,
Bloomington [IN], United States). If the cervix
is favourable with a modified Bishop score ≥6,
the patient is transferred to the labour ward for
artificial rupture of membranes and administration
of synthetic oxytocin. The induction of labour
protocol used in this study aligns with NICE
recommendations, except that the modified Bishop
score was used instead of the Bishop score to assess
cervical readiness for induction.14 15
Medical records of patients with twin
pregnancies who underwent induction of labour
and delivered at our institution between January
2012 and December 2020 were retrospectively
identified using the International Classification of
Diseases codes through the Clinical Data Analysis
and Reporting System of Hospital Authority.
The identified medical records were individually
reviewed. Study participants were required to meet all of the following inclusion criteria: gestational
age ≥24 weeks, intact membranes, and planned
induction of labour. Exclusion criteria included
premature rupture of membranes, labour in the
latent or active phase, threatened preterm labour
resulting in spontaneous labour, and intrauterine
fetal death.
Each twin pregnancy patient who underwent
induction of labour was matched with a singleton
pregnancy patient at a 1:1 ratio in the same hospital
during the same study period. Matching was based
on specific criteria, including parity (nulliparous or
multiparous),16 maternal age (advanced maternal
age of ≥35 years, or not),16 17 and the indication for
induction of labour.18 These criteria were selected to
minimise confounding factors that could affect the
success rate of induction of labour. To further reduce
the impact of variations in medical practice during
the study period, the singleton pregnancy patient
with the delivery date closest to that of the twin
pregnancy patient was selected.
For both twin and singleton pregnancies,
demographic data, past obstetric history, parity,
modified Bishop score, method of cervical priming,
indication for induction of labour, and use of epidural
analgesia were recorded. The primary outcome was
the mode of delivery. Secondary outcomes included
the time from oxytocin infusion to vaginal delivery or
caesarean section, indications for caesarean section
or instrumental delivery, and maternal and neonatal
outcomes. Postpartum haemorrhage was defined
as blood loss of ≥500 mL, regardless of the mode of
delivery. Patients who underwent caesarean section
for the second twin after vaginal delivery of the first
twin were considered to have undergone caesarean
section.
Statistical analyses
To calculate the required sample size, it was assumed
that the incidences of caesarean section were 25%
in the control group and 40% in the study group.
The proportion of discordant pairs was assumed
to be 0.45. A two-sided significance level of 0.05
was selected, and the study aimed to achieve a 1:1
comparison between the groups. Calculations in
G*Power software (version 3.1.9.6; Erdfelder, Faul,
& Buchner, Germany) indicated that a total sample
size of 160 pairs would provide 80% power for the
analysis.
Categorical variables are reported as numerator
and denominator values (%), whereas continuous
variables are presented as mean±standard deviation.
McNemar’s test was used to analyse the primary
outcome for twin pregnancies and their matched
controls. Data for the matched pairs are presented
in a 2×2 table, showing concordant and discordant
study pairs. Odds ratios (ORs) were calculated as the
ratio of discordant pairs, and the test statistic was derived from McNemar’s test. For the remaining
outcomes, paired t tests, Wilcoxon signed rank
test and analyses of variance were used to analyse
continuous variables, whereas McNemar’s tests
or Fisher’s exact tests were utilised for categorical
variables when comparing the case and control
groups. For non-matched data, the Chi squared test
was applied for categorical data, and unpaired t tests
were used for normally distributed continuous data.
Statistical analyses of data using McNemar’s
test were performed with Epi Info (version 7.2.5.0;
Centers for Disease Control and Prevention, Atlanta
[GA], US). All other analyses were conducted with
SPSS (Windows version 27.0; IBM Corp, Armonk
[NY], US). Two-sided P values <0.05 were considered
statistically significant.
Results
During the study period, 760 women with twin
pregnancies were recorded out of 42 280 maternity
cases. Of these, 160 women met the inclusion criteria
for this study. The incidence of twin pregnancies
was 1.8% and the rate of induction of labour in twin
pregnancies was 21.1%.
The study group consisted of women with twin
pregnancies who underwent induction of labour,
whereas the control group comprised women with
singleton pregnancies who delivered at the same
hospital during the same period. The two groups
were matched in terms of age, parity and indication
for induction of labour, and were well balanced with
respect to these matching factors. Patients with
twin pregnancies had a significantly lower body
mass index (21.1 kg/m2 vs 22.2 kg/m2; P=0.008) and
a significantly higher modified Bishop score (6.2
vs 5.4; P<0.001) relative to the control group. The
mean gestational age at delivery was significantly
earlier in twin pregnancies than in the control group
(37.1 weeks vs 40.2 weeks; P<0.001). Other baseline
characteristics, including ethnicity, prior caesarean
section, and use of epidural anaesthesia, did not
significantly differ between the two groups (Table 1).
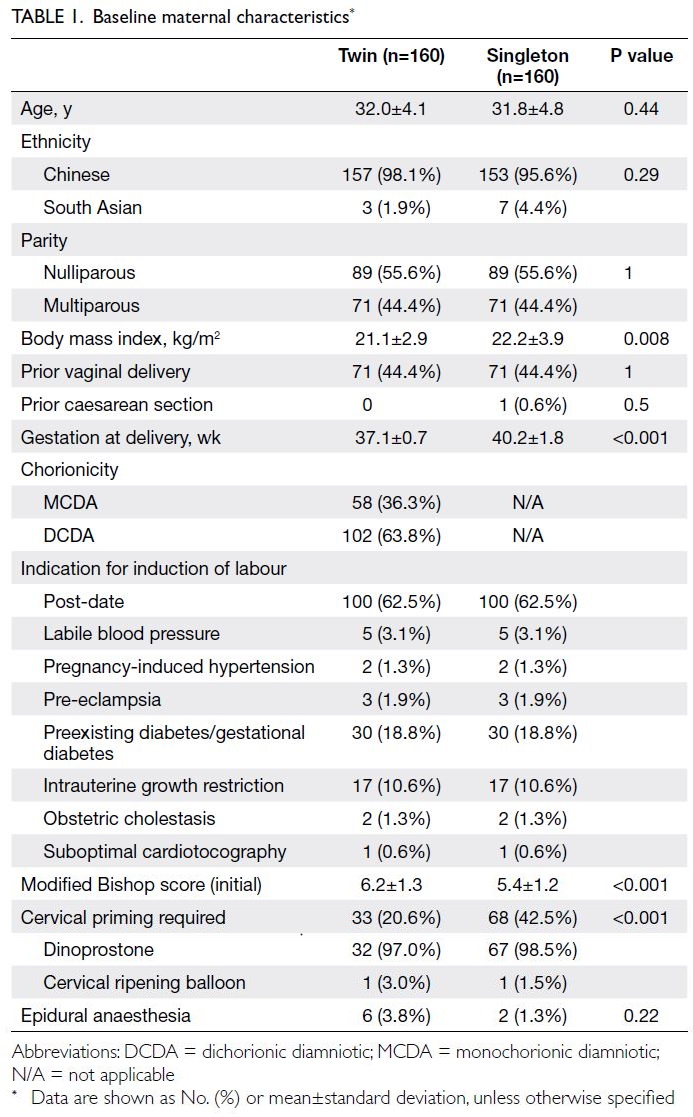
Table 1. Baseline maternal characteristics
Success rate of induction of labour
Out of 160 pairs, 44 were discordant (ie, one member
of the pair had a caesarean section and the other
had a vaginal delivery), and 116 were concordant
(ie, both members of the pair had either a caesarean
section or a vaginal delivery) [Fig]. Patients with
twin pregnancies who underwent induction of
labour had a significantly higher risk of caesarean
section relative to those with singleton pregnancies
(OR=2.14, 95% confidence interval [CI]=1.14-4.04;
P=0.024).
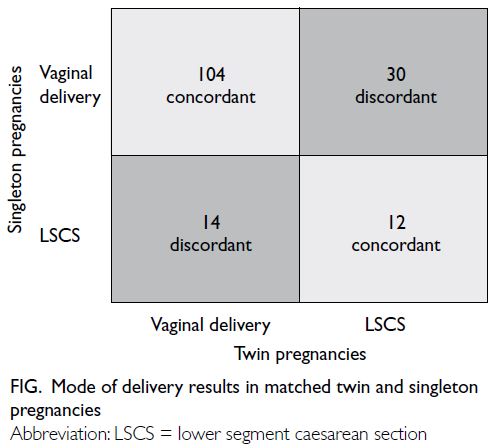
Figure. Mode of delivery results in matched twin and singleton pregnancies
Among the patients with twin pregnancies,
there were 118 vaginal deliveries, 41 caesarean
sections, and one case in which the first twin
was delivered vaginally and the second twin was delivered by caesarean section. Among the patients
with singleton pregnancies, there were 133 vaginal
deliveries and 27 caesarean sections. Instrumental
deliveries were performed in 32 patients with twin
pregnancies and eight patients with singleton
pregnancies (Table 2).
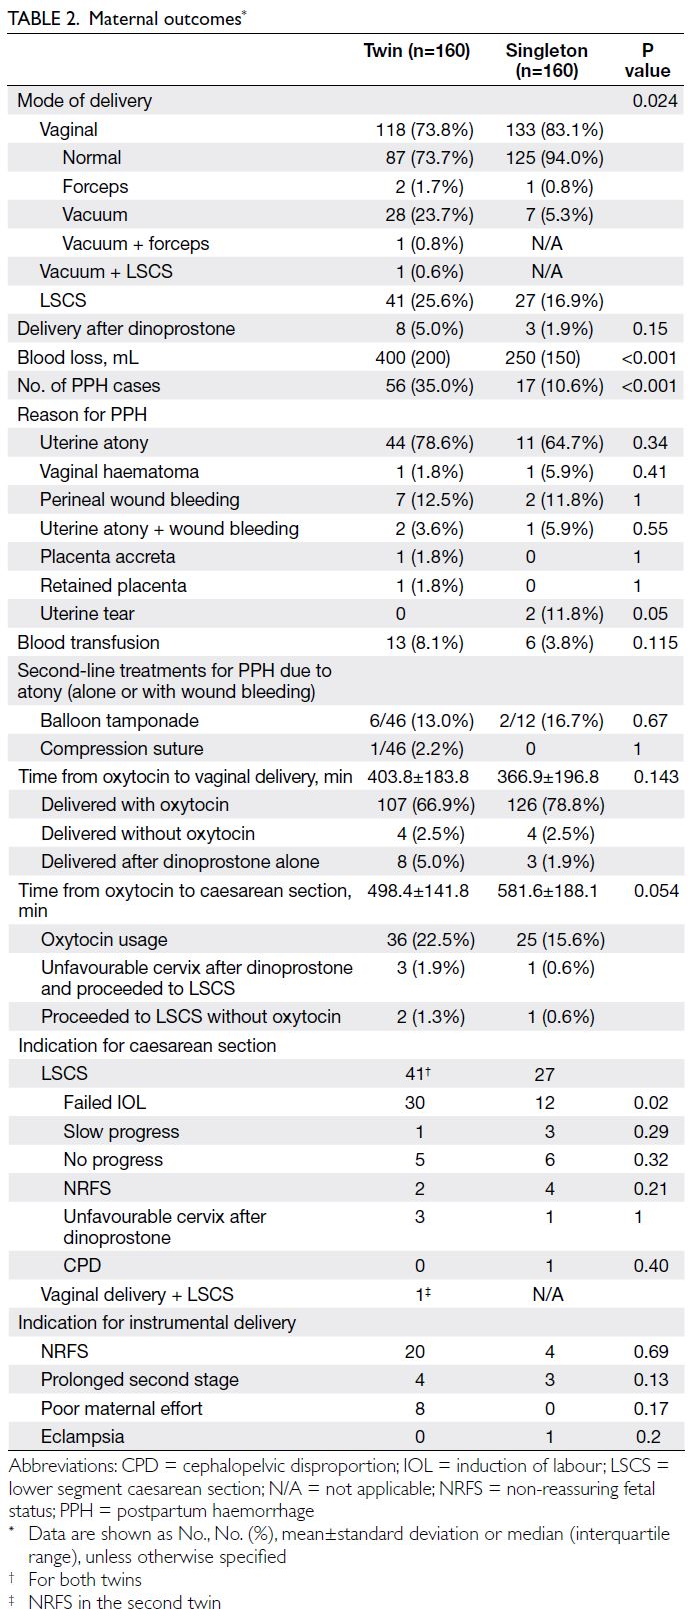
Table 2. Maternal outcomes
There was no significant difference between the
groups in the time from oxytocin administration to
vaginal delivery (P=0.143) or the time from oxytocin
administration to caesarean section (P=0.054). In
total, eight patients with twin pregnancies and three
patients with singleton pregnancies delivered after
dinoprostone insertion without requiring artificial
rupture of membranes or oxytocin infusion. Three
patients with twin pregnancies and one patient with a singleton pregnancy had an unfavourable cervix
after repeated doses of dinoprostone; thus, caesarean
section was performed (Table 2).
Obstetric outcomes
Twin pregnancies were associated with significantly
greater blood loss relative to singleton pregnancies
(median: 400 mL vs 250 mL; P<0.001) and a higher
incidence of postpartum haemorrhage (35.0% vs
10.6%; P<0.001). However, there was no significant
difference between the groups in blood transfusion
rates (8.1% vs 3.8%; P=0.115). The aetiology of
postpartum haemorrhage and need for second-line
treatments were also comparable between the two
groups (Table 2).
Mode of delivery in twin pregnancies
Among those 118 vaginal deliveries, 45 had vaginal
cephalic deliveries of both twins, whereas 42 had a
vaginal cephalic delivery of the first twin followed
by a vaginal breech delivery of the second twin.
Additionally, 32 patients required instrumental
delivery with vacuum or forceps for at least one twin
(Table 3).
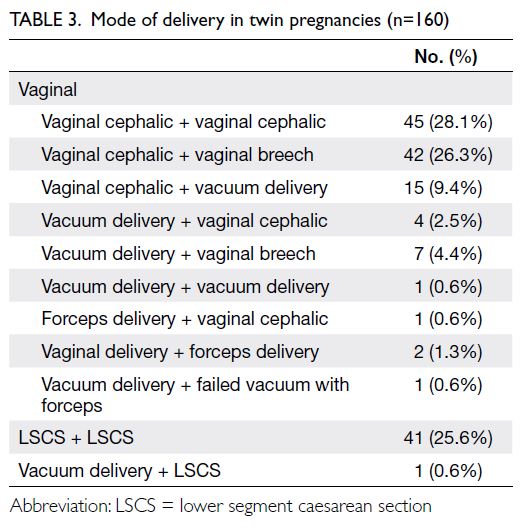
Table 3. Mode of delivery in twin pregnancies (n=160)
In cases where vaginal breech delivery was
required for the second twin, most babies were in
breech presentation. Internal podalic version was
performed in 16 patients (13.6%) to facilitate delivery
of the second twin (Tables 3 and 4). Notably, even
in five cases where the second twin was in cephalic
presentation, internal podalic version was performed
by manual upward displacement of the fetal head to
expedite delivery due to fetal bradycardia or cord
presentation.
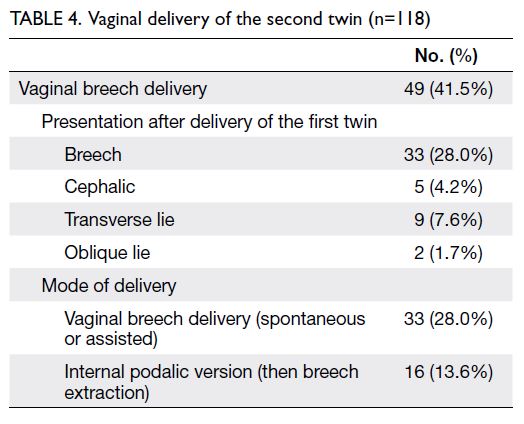
Table 4. Vaginal delivery of the second twin (n=118)
Neonatal outcomes
When neonatal outcomes were compared between the two groups, no significant differences were
observed in Apgar scores at 1 and 5 minutes or in
rates of admission to neonatal intensive care units.
However, both the first and second twins were
significantly lighter in weight relative to neonates in
singleton pregnancies (Table 5).
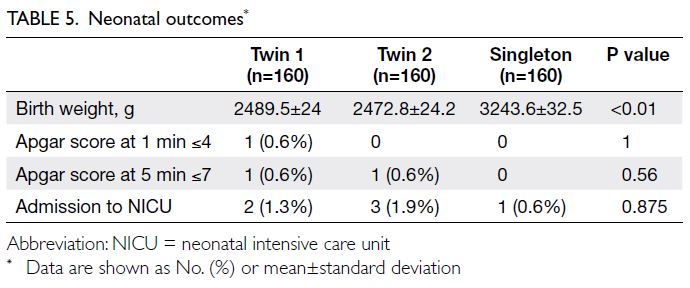
Table 5. Neonatal outcomes
Discussion
Primary outcomes
This case-control study, utilising matched controls,
demonstrated that the rate of failed induction of
labour was significantly higher in twin pregnancies
than in singleton pregnancies. Nevertheless, 73.8% of
patients with twin pregnancies achieved successful
vaginal deliveries. This study represents the largest
cohort investigation of its kind in a predominantly
Chinese population and differs from previous studies
conducted in Western countries.8 9 10 11 A previous
study19 revealed that ethnic variation can influence
the success of induction of labour; thus, our findings
provide valuable insights for counselling and
managing Chinese patients with twin pregnancies.
Comparison with previous studies
The literature on induction of labour in twin
pregnancies compared with singleton pregnancies
remains limited. The present findings are consistent
with those reported by Loscul et al8 and Okby et al,9
both of which identified an increased risk of caesarean
delivery after induction of labour in twin pregnancies.
Loscul et al8 reported an adjusted OR of 1.8 (95%
CI=1.4-2.2), whereas Okby et al9 reported an adjusted
OR of 2.2 (95% CI=1.7-2.7). Similarly, the current
study demonstrated an OR of 2.14, reinforcing the
notion that induction of labour in twin pregnancies
is associated with a higher rate of caesarean
section relative to singleton pregnancies. However,
limitations existed in these studies. For instance, the
large cohort study by Loscul et al,8 which included
1995 twin deliveries and 2771 singleton deliveries,
did not consider chorionicity, and the methods
of induction were not described; considering the
multicentre retrospective design of that study,
interhospital variations may have existed in terms
of induction methods, intrapartum assessment, and
decisions regarding caesarean section. Furthermore,
Okby et al9 included 191 twin deliveries and 25 913
singleton deliveries, but did not provide details
regarding induction methods, cervical status prior to
induction, Bishop score, or the chorionicity of twin
pregnancies. Conversely, Fausett et al10 and Taylor
et al11 included smaller cohorts of twin pregnancies
(62 and 100 patients, respectively), and their findings
may have been influenced by the small sample sizes.
The method of random patient selection used in the
control group of the study by Taylor et al11 may have
introduced potential bias. Another factor potentially contributing to differences in findings among these studies is ethnic variation.
Physiological explanations
Physiological differences in the myometrium between twin and singleton pregnancies may explain the higher incidence of failed labour induction in twin
pregnancies. Research has shown that myometrial
activity in twin pregnancies is characterised by
shorter and more frequent contractions compared
with singleton pregnancies, particularly at term.20
Shortened contraction duration may result
in ineffective and dysfunctional contractions,
increasing the likelihood of failed labour induction.
Additionally, the uterus undergoes greater distension
and stretching in twin pregnancies. Physiological
studies have indicated that increased myometrial
stretching is associated with reduced uterine
contraction in response to oxytocin stimulation.21
One potential mechanism for this phenomenon is
that prolonged stretching enhances the expression
or activity of TWIK-related K+ channels, which
subsequently diminish myometrial contraction in
response to oxytocin.21 Further physiological and
molecular investigations are warranted to explore the
differences between singleton and twin pregnancies
in greater detail.
Clinical implications of secondary outcomes
In conjunction with the primary outcomes, the
secondary outcomes of this study provide important
clinical insights and have substantial implications.
Notably, 26.3% of twin pregnancies delivering
vaginally required a vaginal breech delivery for
the second twin (Tables 3 and 4). Therefore, we
recommend that senior obstetricians with expertise
in internal podalic version and breech extraction be
present during such deliveries.
This study identified one patient who required
a caesarean section for the second twin after the
first twin had been delivered vaginally. When the
first twin was delivered vaginally in our cohort,
the probability of caesarean section for the second
twin was 0.8%. Patients should be informed of this
potential risk prior to induction of labour. Previous
studies have shown that the risk of caesarean
section for the second twin after vaginal delivery
of the first twin ranges from 4.3% to 10.7%.5 22 23 24 In
our cohort, the percentage of caesarean deliveries
for second twins was much lower than that in
other series, including another retrospective study
conducted in Hong Kong with the same ethnic
population.22 23 24 This discrepancy may be attributed
to selection bias because the present study included
only patients undergoing induction of labour,
whereas other studies included patients with both
induction of labour and spontaneous onset of
labour. Furthermore, elective induction of labour for
twin pregnancies in our unit is typically scheduled
during daytime hours. This practice ensures the
availability of experienced staff proficient in internal
podalic version, potentially improving the likelihood
of successful vaginal delivery for the second twin.
Our findings showed that 13.6% of cases involving second twin deliveries required internal podalic
version, primarily due to transverse or oblique lie
(Table 4). Even when the second twin presented in
cephalic position (as observed in five cases), internal
podalic version was required to expedite delivery
because of complications such as cord presentation
or fetal bradycardia. The presence of experienced
staff skilled in performing internal podalic version
can significantly increase the likelihood of achieving
successful vaginal delivery for the second twin. At
our hospital, vaginal twin deliveries during daytime
hours are typically supervised by experienced
obstetric consultants or associate consultants.
Strengths and limitations
To minimise the impact of variations in medical
practice during the study period, we utilised a
rigorous matching approach in which the singleton
pregnancy patient with the delivery date closest to
that of the twin pregnancy patient was selected.
This approach effectively reduced the potential for
confounding factors, including variations in medical
practices, and ensured that the same induction of
labour protocol was applied to both patient groups.
Also, we recorded detailed information concerning
chorionicity, indications for induction of labour, and
the modified Bishop score. Finally, the induction of
labour protocol used in this study aligns with NICE
recommendations; thus, the results are applicable to
other centres that use a similar protocol.
However, this study had some limitations.
The earlier gestational age at delivery in the twin
pregnancy group, as recommended by international
guidelines4 even for uncomplicated twin pregnancies,
may have affected the efficacy of induction of labour
and influenced the overall outcomes. Additionally,
patients with twin pregnancies had a higher initial
modified Bishop score relative to those with
singleton pregnancies. This difference may be due to
selection bias because obstetricians often discourage
vaginal delivery in patients with low initial modified
Bishop scores; instead, they recommend caesarean
section. Despite the higher initial modified Bishop
score in twin pregnancies, the success rate of vaginal
delivery remained lower in this group than in
singleton pregnancies, suggesting that this factor did
not significantly influence the study’s results.
Although the induction of labour protocol was
consistent for both twin and singleton pregnancies,
variations in obstetricians’ assessments of cervical
dilatation, labour progression, and confidence in
managing vaginal twin deliveries may have influenced
study outcomes. Obstetricians with less experience
or confidence in vaginal twin delivery may have been
more likely to diagnose failed induction of labour
and proceed with caesarean section. However, no
statistically significant difference was observed in
the time from initiation of oxytocin to selection of caesarean section between the two groups.
The retrospective nature of the study introduced
potential biases, and the limited incidence of twin
pregnancies in a single regional hospital restricted
the sample size. A larger sample size and multicentre
design would enhance the generalisability of the
findings. Furthermore, because the study primarily
included Chinese patients, the applicability of these
conclusions to other ethnic groups is limited; there
is a need for further research in this area.
Conclusion
The failure rate of induction of labour was higher
in twin pregnancies than in singleton pregnancies.
Nevertheless, 73.8% of patients with twin
pregnancies achieved successful vaginal deliveries;
approximately 20% required instrumental delivery
for at least one twin. Furthermore, twin pregnancies
were associated with a higher incidence of
postpartum haemorrhage. These findings can help
facilitate informed decision making for patients and
obstetricians when considering induction of labour
and selecting the most appropriate mode of delivery
for patients with twin pregnancies.
Author contributions
Concept or design: CK Wong, WL Lau.
Acquisition of data: CK Wong.
Analysis or interpretation of data: CK Wong.
Drafting of the manuscript: CK Wong, CMW Hung.
Critical revision of the manuscript for important intellectual content: All authors.
Acquisition of data: CK Wong.
Analysis or interpretation of data: CK Wong.
Drafting of the manuscript: CK Wong, CMW Hung.
Critical revision of the manuscript for important intellectual content: All authors.
All authors had full access to the data, contributed to the study, approved the final version for publication, and take responsibility for its accuracy and integrity.
Conflicts of interest
All authors have disclosed no conflicts of interest.
Acknowledgement
The authors thank the Kwong Wah Hospital Clinical Research
Centre and Mr Steven Lau, Biostatistician from the Centre for
Clinical Research and Biostatistics of The Chinese University
of Hong Kong, for their statistical advice.
Declaration
This work was posted on Authorea as a registered online
preprint (https://doi.org/10.22541/au.169320065.53300017/v1).
Funding/support
This research received no specific grant from any funding agency in the public, commercial, or not-for-profit sectors.
Ethics approval
This research was approved by the Kowloon Central Cluster/Kowloon East Cluster Research Ethics Committee of Hospital Authority, Hong Kong (Ref No.: KC/KE-22-0113/ER-3). The requirement for informed patient consent was waived by the
Committee due to the retrospective nature of the research
and the use of anonymised data in the research.
References
1. Monden C, Pison G, Smits J. Twin peaks: more twinning
in humans than ever before. Hum Reprod 2021;36:1666-73. Crossref
2. Santana DS, Cecatti JG, Surita FG, et al. Twin pregnancy and
severe maternal outcomes: the World Health Organization
multicountry survey on maternal and newborn health.
Obstet Gynecol 2016;127:631-41. Crossref
3. Cheong-See F, Schuit E, Arroyo-Manzano D, et al.
Prospective risk of stillbirth and neonatal complications
in twin pregnancies: systematic review and meta-analysis.
BMJ 2016;354:i4353. Crossref
4. National Institute for Health and Care Excellence. NICE
guideline [NG137]. Twin and triplet pregnancy. London:
National Institute for Health and Care Excellence; 2019.
5. Barrett JF, Hannah ME, Hutton EK, et al. A randomized
trial of planned cesarean or vaginal delivery for twin
pregnancy. N Engl J Med 2013;369:1295-305. Crossref
6. Sotiriadis A, Petousis S, Thilaganathan B, et al. Maternal
and perinatal outcomes after elective induction of labor at
39 weeks in uncomplicated singleton pregnancy: a meta-analysis.
Ultrasound Obstet Gynecol 2019;53:26-35. Crossref
7. Stock SJ, Ferguson E, Duffy A, Ford I, Chalmers J,
Norman JE. Outcomes of elective induction of labour
compared with expectant management: population-based
study. BMJ 2012;344:e2838. Crossref
8. Loscul C, Schmitz T, Blanc-Petitjean P, Goffinet F, Le
Ray C; JUMODA and MEDIP study groups. Risk of
cesarean after induction of labor in twin compared to
singleton pregnancies. Eur J Obstet Gynecol Reprod Biol
2019;237:68-73. Crossref
9. Okby R, Shoham-Vardi I, Ruslan S, Sheiner E. Is induction
of labor risky for twins compare to singleton pregnancies?
J Matern Fetal Neonatal Med 2013;26:1804-6. Crossref
10. Fausett MB, Barth WH Jr, Yoder BA, Satin AJ. Oxytocin
labor stimulation of twin gestations: effective and efficient.
Obstet Gynecol 1997;90:202-4. Crossref
11. Taylor M, Rebarber A, Saltzman DH, Klauser CK, Roman AS,
Fox NS. Induction of labor in twin compared with singleton
pregnancies. Obstet Gynecol 2012;120:297-301. Crossref
12. Amikam U, Hiersch L, Barrett J, Melamed N. Labour induction in twin pregnancies. Best Pract Res Clin Obstet Gynaecol 2022;79:55-69. Crossref
13. Yung WK, Liu AL, Lai SF, et al. A specialised twin pregnancy
clinic in a public hospital. Hong Kong J Gynaecol Obstet
Midwifery 2012;12:21-32.
14. National Institute for Health and Care Excellence. NICE
guideline [NG207]. Inducing labour. London: National
Institute for Health and Care Excellence; 2021.
15. Thomas J, Kavanagh J, Kelly A, editors. RCOG Evidence-based Clinical Guidelines Induction of labour. RCOG Press; 2001.
16. Batinelli L, Serafini A, Nante N, Petraglia F, Severi FM,
Messina G. Induction of labour: clinical predictive factors
for success and failure. J Obstet Gynaecol 2018;38:352-8. Crossref
17. Jeong Y, Choo SP, Yun J, Kim EH. Effect of maternal age
on maternal and perinatal outcomes including cesarean
delivery following induction of labor in uncomplicated
elderly primigravidae. Medicine (Baltimore)
2021;100:e27063. Crossref
18. Chan YY, Lo TK, Yu EL, Ho LF. Indications for induction
of labour and mode of delivery in nulliparous term women
with an unfavourable cervix. Hong Kong J Gynaecol Obstet
Midwifery 2021;21:69-75. Crossref
19. Papoutsis D, Antonakou A, Tzavara C. The effect of ethnic
variation on the success of induced labour in nulliparous
women with postdates pregnancies. Scientifica (Cairo)
2016;2016:9569725. Crossref
20. Turton P, Arrowsmith S, Prescott J, et al. A comparison of
the contractile properties of myometrium from singleton
and twin pregnancies. PLoS One 2013;8:e63800. Crossref
21. Yin Z, He W, Li Y, et al. Adaptive reduction of human
myometrium contractile activity in response to prolonged
uterine stretch during term and twin pregnancy. Role of
TREK-1 channel. Biochem Pharmacol 2018;152:252-63. Crossref
22. Mok SL, Lo TK. Vaginal delivery of second twins: factors
predictive of failure and adverse perinatal outcomes. Hong
Kong Med J 2022;28:376-82. Crossref
23. Tang HT, Liu AL, Chan SY, et al. Twin pregnancy outcomes
after increasing rate of vaginal twin delivery: retrospective
cohort study in a Hong Kong regional obstetric unit. J
Matern Fetal Neonatal Med 2016;29:1094-100. Crossref
24. Kong CW, To WW. The predicting factors and outcomes
of caesarean section of the second twin. J Obstet Gynaecol
2017;37:709-13. Crossref