Effects of nerve sparing on erectile dysfunction and urinary incontinence in robot-assisted radical prostatectomy
Hong Kong Med J 2025 Jun;31(3):218–24 | Epub 10 Jun 2025
© Hong Kong Academy of Medicine. CC BY-NC-ND 4.0
ORIGINAL ARTICLE
Effects of nerve sparing on erectile dysfunction
and urinary incontinence in robot-assisted radical prostatectomy
Omar WK Tsui1; Kevin CH Shing1; Aren PM Lam1; SL Ng, DNurs, MSSc2,3; Stacia Chun, BSc2,3; CF Tsang, FHKAM (Surgery), FCSHK2,3; Terence CT Lai, FHKAM (Surgery), FCSHK2,3; Rong Na, PhD2,3; HL Wong, FHKAM (Surgery), FCSHK2,3; Brian SH Ho, FHKAM (Surgery), FCSHK2,3; Ada TL Ng, FHKAM (Surgery), FCSHK2,3
1 Li Ka Shing Faculty of Medicine, The University of Hong Kong, Hong Kong SAR, China
2 Division of Urology, Department of Surgery, School of Clinical Medicine, Li Ka Shing Faculty of Medicine, The University of Hong Kong, Hong Kong SAR, China
3 Division of Urology, Department of Surgery, Queen Mary Hospital, Hong Kong SAR, China
Corresponding author: Dr Brian SH Ho (hobrian@hku.hk)
 Full paper in PDF
Abstract
Introduction: In 2020, there were >1.4 million
new prostate cancer cases and >370 000 related
deaths reported globally. Robot-assisted radical
prostatectomy (RARP) is a surgical method used
to eradicate localised prostate cancer. However,
erectile dysfunction (ED) and urinary incontinence
(UI) are common side-effects. This retrospective
cohort study investigated erectile function, urinary
continence, and oncological outcomes of nerve
sparing (NS) in RARP.
Methods: In total, 431 patients who underwent
RARP in our institution between January 2018
and April 2023 were recruited; all had attended
postoperative follow-up. Regarding ED outcome,
patients with a preoperative International Index of
Erectile Function–5 (IIEF-5) score of 7 or below were excluded
from analysis. Patient demographics, 1-hour pad
test results, IIEF-5 questionnaire results, and
pathological parameters were analysed.
Results: Patients with bilateral NS had a higher mean
postoperative IIEF-5 score after 2 months (7.60 vs
3.19 in non-NS patients, P=0.037; 7.60 vs 2.50 in
unilateral NS patients, P=0.020) and 3 months (7.40
vs 2.06 in unilateral NS patients; P=0.027). They also
had lower mean urine leakage volume in the 1-hour
pad test after 1 month (16.40 g vs 49.44 g in non-NS
patients, P<0.001; 16.40 g vs 50.82 g in unilateral
NS patients, P=0.010) and 2 months (13.60 g vs
35.45 g in non-NS patients; P=0.009). No significant differences were observed in ED or UI between
non-NS and unilateral or bilateral NS at 6 and 12
months. There was no correlation between positive
surgical margin and NS.
Conclusion: Bilateral NS had significant short-term
effects on early recovery of erectile function and
urinary continence, relative to unilateral NS and
non-NS groups, without compromising oncological
outcomes.
New knowledge added by this study
- Bilateral nerve sparing (NS) is an effective technique for improving erectile function and urinary continence within the first 3 months after surgery.
- No significant differences in erectile dysfunction and urinary incontinence were observed 12 months after surgery.
- Bilateral NS does not increase the risk of positive surgical margins in selected patients.
- Bilateral NS is a surgical approach that facilitates the early recovery of erectile function and urinary continence.
- Bilateral NS is a safe option for oncologically suitable patients, without increasing the risk of positive surgical margins.
Introduction
Prostate cancer is one of the most common cancers
in men. In 2020, there were 2315 new cases of
prostate cancer diagnosed in Hong Kong, with
an age-standardised incidence rate of 30.5 per 100 000 population.1 Globally, >1.4 million new
prostate cancer cases and more than 370 000 related deaths
were reported in 2020.2 Robot-assisted radical
prostatectomy (RARP) is one of the most common
procedures used to eradicate localised prostate cancer. However, erectile dysfunction (ED) and
urinary incontinence (UI) are common side-effects
of RARP.3
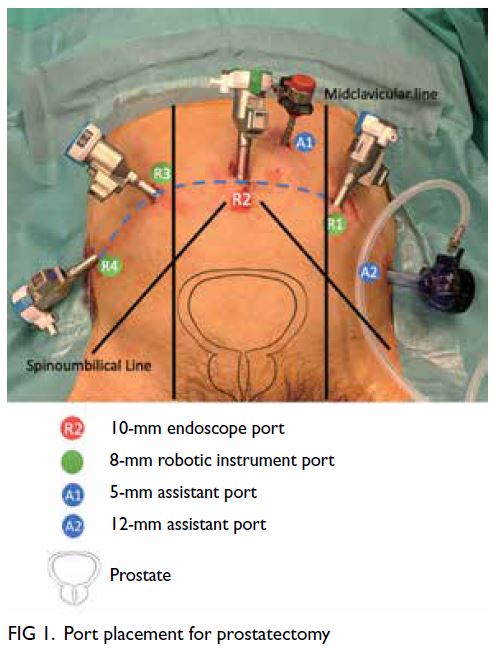
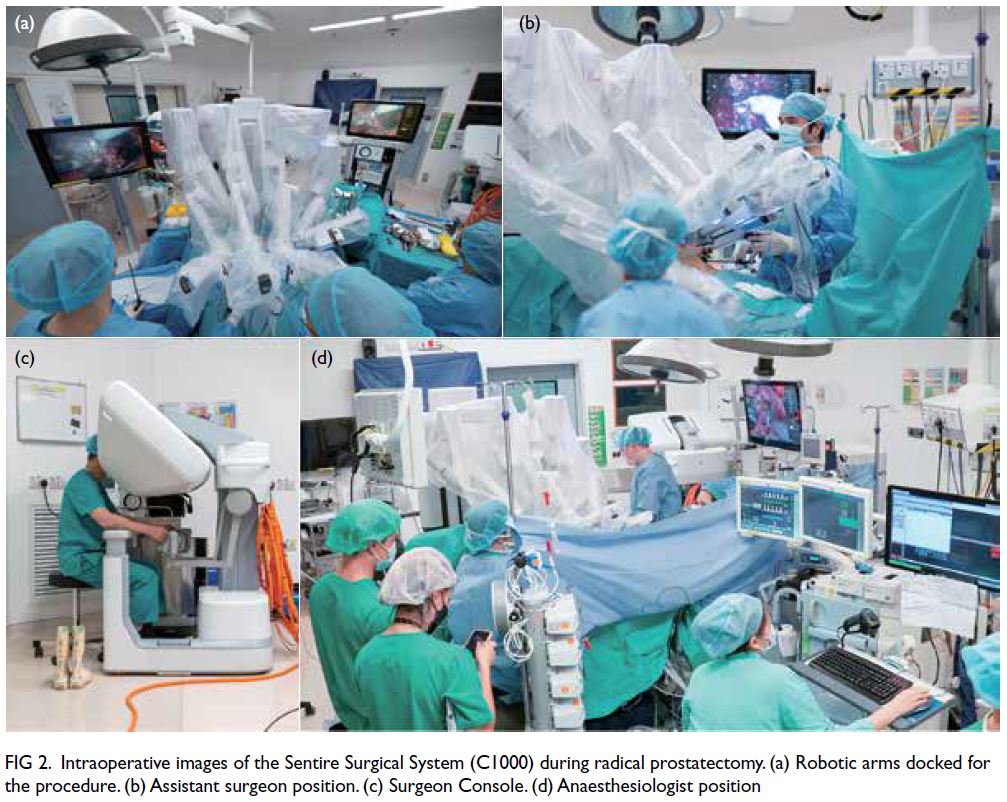
The RARP is typically performed using
robotic surgical platforms, such as the da Vinci
Surgical System4 which facilitates minimally invasive
prostatectomy. Keyholes are created through
which high-resolution, illuminated cameras and
robotic arms are inserted into the peritoneal cavity,
which is inflated with carbon dioxide to provide
adequate space for surgery. If the tumour is small
and likelihood of extracapsular extension (ECE) is
low, bilateral or unilateral nerve sparing (NS) may
be performed to preserve postoperative erectile5
and lower urinary tract function,6 7 while taking
oncological outcomes into consideration. The
decision to use an NS technique is made by the
surgeon, who carefully assesses the patient’s disease
characteristics, drawing on personal experience and
current research evidence.8 The prostate is then
dissected from the bladder and urethra, and a re-anastomosis
is performed between the bladder neck
and the urethra.
A meta-analysis of NS techniques in radical
prostatectomy (including RARP) has shown that the
use of NS techniques results in lower risks of ED and
UI at 3- and 12-month follow-ups.9 Nerve sparing cases demonstrate superior erectile function, urinary
continence, and oncological outcomes compared
with non-NS cases.9 Further analyses indicated
that NS is associated with fewer complications than
non-NS.10 11 They also suggest that the use of NS
techniques does not lead to inferior oncological
outcomes.10 11 Therefore, we hypothesised that
bilateral NS in RARP improves erectile function
and urinary continence after surgery. Our study
aimed to investigate the effects of NS RARP on
the aforementioned side-effects of ED and UI in
Hong Kong and provide suggestions for enhancing
patient’s quality of life.
Methods
We retrospectively recruited 431 patients who
underwent RARP in a university-based teaching
hospital (our institution) between January 2018 and
April 2023. We retrieved their basic demographics,
relevant surgical parameters (NS approach, positive
surgical margin [PSM], ECE and Gleason score),
postoperative 1-hour pad test results (at 1, 2, 3, 6,
and 12 months postoperatively), and pre- and postoperative
International Index of Erectile Function–5
(IIEF-5) scores12 at the same time points from electronic medical records. The IIEF-5 assesses
erectile function using a 5-point scale across several
domains, including erectile function, orgasmic
function, sexual desire, intercourse satisfaction, and
overall sexual satisfaction.12 All patients attended
follow-up at our institution’s urology nurse clinic and
received guidance on postoperative management,
including pelvic floor strengthening exercises.
The primary outcome of the study was to
evaluate the effect of NS in RARP on postoperative
ED and UI. Secondary outcomes included
correlations between other factors (PSM and ECE)
and functional outcomes (ED and UI); correlations
between NS and PSM or ECE; and postoperative
trends in ED and UI beyond 1 year.
Inclusion criteria comprised all patients who
had undergone RARP in our institution with follow-up
in our nurse clinic. Treatment via bilateral NS,
unilateral NS, or non-NS RARP was performed at
the surgeon’s discretion and the patient’s preferences.
Exclusion criteria included incomplete data. For the
ED outcome, patients with an IIEF-5 score of 7 or below were
excluded because this score indicates severe ED,13
and improvement beyond the preoperative baseline
was not expected after NS RARP. Patient selection
flowcharts for ED and UI are provided in online supplementary Figures 1 and 2, respectively.
R (R Foundation for Statistical Computing,
Vienna, Austria) and RStudio software were used
for data analysis.14 All statistical tests were two-sided
and incorporated a 5% significance threshold.
Cases with missing data due to loss to follow-up
were excluded from analysis. Patients selected for ED and UI analysis had comparable age profiles
(online supplementary Tables 1 and 2, respectively).
Categorical variables were analysed using Chi
squared tests or Fisher’s exact tests, depending on
the observed frequencies. Continuous variables
were analysed using independent sample t tests and
Pearson correlations were utilised.
Results
Demographics
Among the 431 eligible patients included in the
analysis, the mean age was 67.67 years. Regarding
ED, the mean ages (±standard deviation) in the
non-NS, unilateral NS, and bilateral NS groups
were 65.20±4.95, 64.84±6.51, and 66.64±5.35
years, respectively, with no statistically significant
differences observed (online supplementary Table 3).
Concerning UI, the mean ages (±standard deviation)
in the non-NS, unilateral NS, and bilateral NS
groups were 66.82±5.48, 67.90±5.49, and 67.94±5.14
years, respectively, with no statistically significant
differences observed (online supplementary Table 4). The mean tumour percentage was 12.85% of the
total prostate volume and the mean resected prostate
volume was 54.39 g. The distribution of pathological
Gleason scores is shown in online supplementary Table 5. The majority of patients had a Gleason score
of 7: 41.0% had a score of 3+4 (International Society
of Urological Pathology [ISUP] Grade Group 2),
and 23.9% had a score of 4+3 (ISUP Grade Group
3). Patients with low to intermediate risk prostate
cancer, based on the National Comprehensive
Cancer Network risk classification, were more likely
to undergo bilateral NS operations (Table 1). Further
details of NS approaches are presented in Table 1.
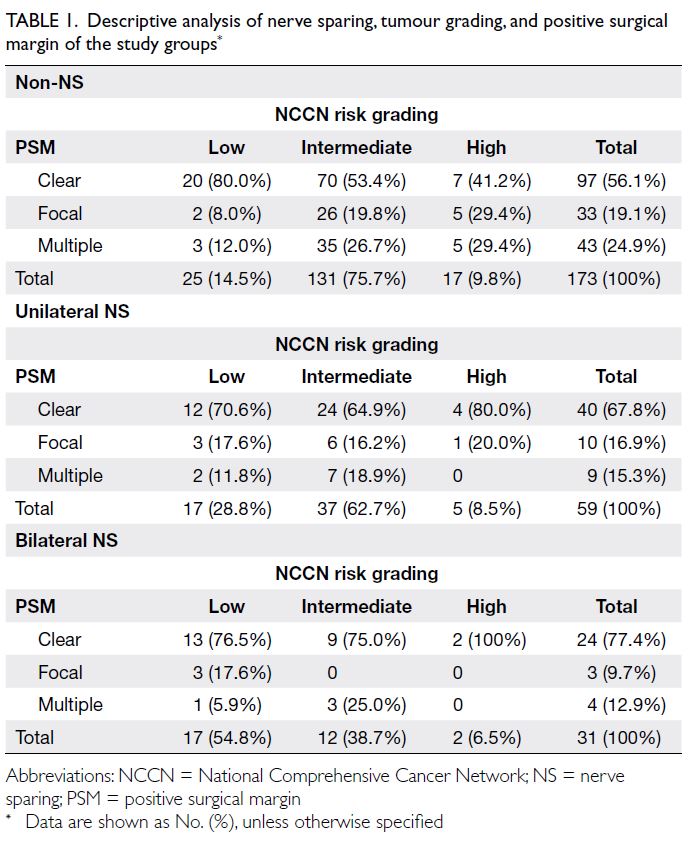
Table 1. Descriptive analysis of nerve sparing, tumour grading, and positive surgical margin of the study groups
Erectile dysfunction
The mean preoperative IIEF-5 score was 10.22 (n=75; online supplementary Fig 1). For the primary
outcome, patients with bilateral NS had a higher
mean postoperative IIEF-5 score than those without
NS at 2 months (non-NS vs bilateral NS=3.19 vs
7.60, t=-2.35; P=0.037). Bilateral NS patients also
had a higher mean postoperative IIEF-5 score than
unilateral NS patients at 2 months (2.50 vs 7.60,
t=-2.69; P=0.020) and 3 months (2.06 vs 7.40,
t=-2.61; P=0.027) [Table 2]. Differences in IIEF-5
scores at 1, 6, and 12 months postoperatively were
not significant among any of the groups (Table 2).
Concerning the secondary outcome, younger age
was associated with a higher postoperative IIEF-5
score among non-NS patients (m=-0.42; P=0.024).
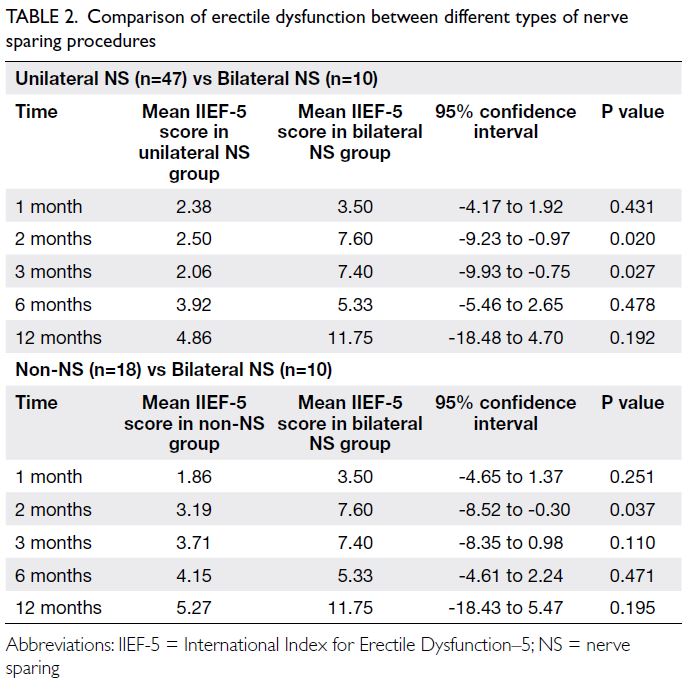
Table 2. Comparison of erectile dysfunction between different types of nerve sparing procedures
With respect to postoperative penile
rehabilitation, the use of phosphodiesterase type
5 inhibitors (PDE5i) was reported by 38.3%, 77.8%
and 60.0% in non-NS, unilateral NS, and bilateral NS
patients, respectively. Among those who did not take PDE5i, reasons included financial considerations—patients must pay out of pocket for PDE5i in Hong
Kong, and a perceived lack of efficacy. Even among
those who utilised PDE5i, only 38.9%, 35.7%, and
66.7% of non-NS, unilateral NS, and bilateral
NS patients, respectively, reported subjective
improvement in erectile function. Objective changes
in IIEF-5 scores (difference between preoperative
and 12-month postoperative scores) were -10.20,
-17.03, and -7.67 in non-NS, unilateral NS, and
bilateral NS patients, respectively. Further details
can be found in online supplementary Tables 6 to 8.
Urinary incontinence
After initial screening and the exclusion of records
with missing follow-up data, 264 patients were
included in the analysis of UI following RARP (online supplementary Fig 2).
For the primary outcome, patients with
bilateral NS had lower mean urinary leakage volume
in the 1-hour pad test relative to patients without
NS after 1 month (non-NS vs bilateral NS=49.44 g
vs 16.40 g, t=3.92; P<0.001) and 2 months (35.45 g
vs 13.60 g, t=2.67; P=0.009). Patients with bilateral
NS also had lower mean urinary leakage volume
than unilateral NS patients after 1 month (50.82 g vs
16.40 g, t=2.61; P=0.01). Differences in UI at 3, 6, and
12 months were not significant among the groups
(Table 3). Further details comparing non-NS and unilateral NS can be found in online supplementary Tables 9 and 10.
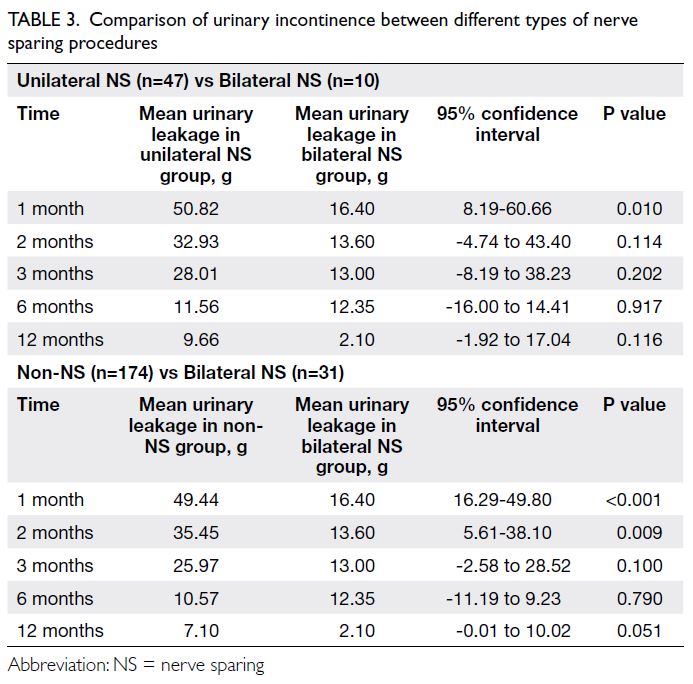
Table 3. Comparison of urinary incontinence between different types of nerve sparing procedures
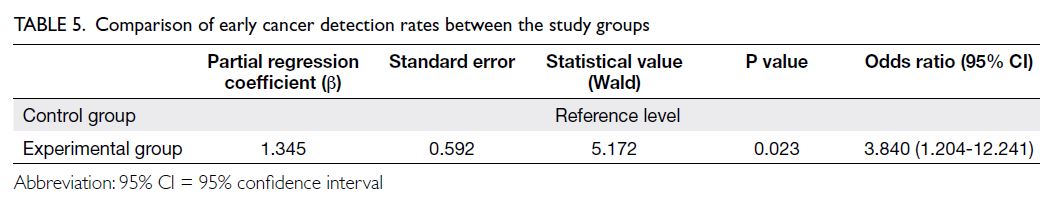
Oncological outcome
Tumour recurrence is an adverse surgical outcome
of RARP that requires further oncological
management. We identified patients who underwent
adjuvant radiotherapy, salvage radiotherapy, or
experienced cancer-related death, then stratified
them according to NS group, adjusted for age and
total Gleason score. Statistical analysis showed no
significant differences in oncological outcomes
between non-NS and bilateral NS patients
(odds ratio [OR]=0.75, 95% confidence interval
[95% CI]=0.39-1.27; P=0.321), as well as unilateral
NS and bilateral NS patients (OR=0.78, 95% CI=0.18-2.82; P=0.720). These findings indicated that bilateral
NS was neither superior nor inferior in oncological
outcomes compared with unilateral and non-NS
groups, consistent with literature reports.15 16
Other correlations
Older patients had lower postoperative IIEF-5 scores
at 6 months (Pearson correlation=-0.18; P=0.013)
and 12 months (Pearson correlation=-0.22; P=0.014).
However, the correlations were not statistically
significant at 1, 2, or 3 months postoperatively.
There also was no statistically significant correlation
between age and postoperative UI.
Patients who underwent non-NS RARP were
more likely to have ≥1 positive surgical margin (Chi squared=4.2673, P=0.039, OR=0.46; 95% CI=0.22-0.91). This result was likely attributable to disease-related
factors. A larger proportion of patients in the
non-NS group had a higher National Comprehensive
Cancer Network risk score, indicating more
aggressive tumours. Distributions of patients’ NS
status, tumour grading, and PSMs are shown in
Table 1.
Discussion
Erectile dysfunction
Comparisons of postoperative IIEF-5 scores among
NS groups revealed significant differences. Patients
with bilateral NS exhibited higher postoperative
IIEF-5 scores than those without NS at 2 months,
highlighting the positive impact of bilateral NS on
early erectile function recovery. Similar trends were
observed when comparing bilateral NS with unilateral
NS at both 2 and 3 months postoperatively. However,
no significant differences in IIEF-5 scores were
noted at 6 or 12 months, suggesting a convergence of
outcomes beyond the initial recovery phase. A meta-analysis
Nguyen et al17 on NS techniques in radical
prostatectomy (including RARP) showed that NS
cases had lower risks of ED at 3 and 12 months (risk
ratio [RR] at 3 months=0.77; 95% CI=0.70-0.85;
RR at 12 months=0.53; 95% CI=0.39-0.71). Some
differences between our study (Table 2) and that
of Nguyen et al17 might be attributable to the small sample size and loss to follow-up in our cohort, which may have introduced selection bias.
Our study also demonstrated that the bilateral
NS technique was linked to better erectile function
outcomes than unilateral NS, consistent with
previous findings. In the study by Berg et al,18 the
proportion of patients who were alive, continent,
and potent was significantly greater among those
with bilateral NS (67.6%) compared to unilateral NS
(31.3%) [P<0.001]. Other studies also showed that
bilateral NS was associated with lower risks of ED
at 3 months (RR=0.80; 95% CI=0.70-0.90) and 1 year
(RR=0.80; 95% CI=0.72-0.88) relative to unilateral
NS.17
However, our study did not identify statistically
significant benefits from unilateral NS in terms of
ED and UI compared with non-NS. This may be
due to a combination of factors, including variation
in surgeons’ techniques for unilateral NS, small
sample size, and relatively small absolute differences
in outcomes between the unilateral and non-NS
groups.
Further analysis also found that PDE5i therapy
yielded only modest improvements in erectile
function among individuals who underwent non-NS
or unilateral NS procedures. Changes in IIEF-5 scores
from preoperative to 12 months postoperative after
PDE5i use were -10.20, -17.03 and -7.67 in non-NS,
unilateral NS, and bilateral NS patients, respectively.
Although approximately two-thirds of bilateral NS
patients experienced improved erectile function,
the limited number of patients who received PDE5i
warrants caution when interpreting effects in this
subgroup.
The relationship between age and erectile
function in patients without NS was notable. Younger
age was associated with higher postoperative IIEF-5
scores, emphasising the potential influence of age on
postoperative erectile function recovery, consistent
with international literature.19 Among older
patients, postoperative ED remains an important
complication. Thus, age is a key consideration when
balancing quality of life and oncological control
in planning surgical approaches. Surgeons should
thoroughly discuss potential side-effects of ED
with older patients who have concerns about sexual
function prior to surgery involving NS.
Urinary incontinence
In terms of UI, patients with bilateral NS
demonstrated lower urinary leakage volumes in the
1-hour pad test compared with those without NS at 1
and 2 months postoperatively. Similarly, bilateral NS
was associated with lower urinary leakage volumes
than unilateral NS at 1 month. These findings suggest
that NS techniques enhance short-term UI recovery,
although the differences tend to diminish over time.
The benefit of NS on long-term UI recovery beyond 1 year remains uncertain.9 17 20 Choi et al20 reported
findings similar to ours, indicating that bilateral
NS was associated with a higher continence rate
than non-NS at 4 months (P=0.043), although the
differences at 12 and 24 months were not significant.
Conversely, a meta-analysis by Nguyen et al17 on
NS techniques in radical prostatectomy (including
RARP) found that NS was associated with lower
risks of UI at both 3 months (RR =0.75, 95% CI=0.65-0.85) and 12 months (RR=0.61, 95% CI=0.44-0.84).
These discrepancies may be attributed to differences
in study design, sample size, and baseline patient
characteristics.
Other studies have also shown that bilateral
NS is associated with a lower risk of UI at 1 year
(RR=0.70, 95% CI=0.50-0.98) and lower risks of ED
at 3 months (RR=0.80, 95% CI=0.70-0.90) and 1
year (RR=0.80, 95% CI=0.72-0.88) compared with
unilateral NS.17 In our study, while we observed
a lower risk of UI at 1 and 2 months after surgery,
this difference was not statistically significant at 3 months.
Clinical implications and future research
Our findings have implications for surgical decision-making
and patient counselling. Surgeons should
consider the potential benefits of bilateral NS for
early postoperative recovery of erectile function
and urinary continence.21 Although our study did
not demonstrate statistically significant long-term
differences in these outcomes, bilateral NS has
been reported to play a key role in early recovery.
Contributing to improved quality of life and patient
satisfaction.21 Moreover, age should be considered
when evaluating erectile function outcomes in
patients undergoing non-NS RARP.
Future research could investigate the long-term
trajectories of erectile function and urinary
continence, exploring factors that contribute to
outcome convergence over time. Additionally,
efforts to evaluate the impact of NS techniques on
quality of life and patient satisfaction could offer a
more comprehensive understanding of the clinical
implications of these findings.
We also intend to further examine why patients
with unilateral NS did not demonstrate better
erectile function outcomes than those in the non-NS
group. Notably, there was a significant difference
in outcomes between the bilateral NS and non-NS
groups, despite the small number of patients with
bilateral NS (n=10). Therefore, we plan to conduct a
detailed review of surgical records for patients with
unilateral NS to determine why erectile function
outcomes were not superior to those in the non-NS
group.
This study also highlights the need for better
public and patient education regarding sexual health.
In Hong Kong, sexual function currently remains a major taboo topic among older individuals. Many
are reluctant to discuss ED and are even more
reluctant to seek medical treatment. In our study,
121 patients displayed severe preoperative ED, but
none had sought medical attention. This problem is
compounded by the financial barriers to treatment.
In public hospitals, PDE5i is entirely self-financed,
and even government employees are unable to
reclaim their costs. These factors collectively create
a substantial barrier for older men in Hong Kong to
recognise ED as a treatable clinical condition that
could improve their sexual health.
Strengths and limitations
To our knowledge, this is the first local retrospective
cohort study in Hong Kong comparing the efficacy
of NS approaches in RARP for reducing ED and UI.
These findings provide valuable insights into current
local RARP practices and serve as a foundation for
future prospective studies.
However, there were several limitations,
including the retrospective design, potential selection
biases, single-centre setting, and inconsistency in
follow-up intervals, as some patients might have
attended follow-up appointments earlier or later than
scheduled due to personal reasons. These factors
could affect the interpretation and generalisability
of the results. Furthermore, the IIEF-5 score used
in this study was based on patients’ subjective self-assessment
and may not accurately reflect changes
in erectile function, particularly among patients
without preoperative sexual activity.22
Conclusion
The bilateral NS technique during prostatectomy
demonstrated a significant positive impact on the
recovery of erectile function and urinary continence
within the first 6 months postoperatively, without
compromising oncological outcomes. However, the
extent of this benefit appears to diminish over time,
indicating the need for longer-term assessment.
These findings contribute valuable insights into
the role of NS in prostate cancer surgery and may
inform clinical decision-making in prostate cancer
management. To validate and expand upon these
observations, further prospective, randomised
studies with extended follow-up are warranted.
Author contributions
Concept or design: OWK Tsui, S Chun, BSH Ho.
Acquisition of data: OWK Tsui, KCH Shing.
Analysis or interpretation of data: OWK Tsui, KCH Shing, APM Lam, S Chun.
Drafting of the manuscript: OWK Tsui.
Critical revision of the manuscript for important intellectual content: All authors.
Acquisition of data: OWK Tsui, KCH Shing.
Analysis or interpretation of data: OWK Tsui, KCH Shing, APM Lam, S Chun.
Drafting of the manuscript: OWK Tsui.
Critical revision of the manuscript for important intellectual content: All authors.
All authors had full access to the data, contributed to the study, approved the final version for publication, and take responsibility for its accuracy and integrity.
Conflicts of interest
As an editor of the journal, BSH Ho was not involved in the peer review process. Other authors have disclosed no conflicts of interest.
Declaration
This research was presented at The Hong Kong Urological Association 28th Annual Scientific Meeting held in Hong Kong on 19 November 2023.
Funding/support
This research received no specific grant from any funding
agency in the public, commercial, or not-for-profit sectors.
Ethics approval
This research was approved by the Institutional Review Board
of The University of Hong Kong/Hospital Authority Hong
Kong West Cluster, Hong Kong (Ref No.: UW-24-099). The
requirement for informed patient consent was waived by the
Board due to the retrospective nature of the research.
Supplementary material
The supplementary material was provided by the authors and
some information may not have been peer reviewed. Accepted
supplementary material will be published as submitted by
the authors, without any editing or formatting. Any opinions
or recommendations discussed are solely those of the
author(s) and are not endorsed by the Hong Kong Academy
of Medicine and the Hong Kong Medical Association.
The Hong Kong Academy of Medicine and the Hong Kong
Medical Association disclaim all liability and responsibility
arising from any reliance placed on the content.
References
1. Centre for Health Protection, Department of Health, Hong
Kong SAR Government. Prostate cancer. 2025 Feb 24.
Available from: https://www.chp.gov.hk/en/healthtopics/content/25/5781.html#:~:text=Prostate%20cancer%20was%20the%20fourth,per%20100%20000%20male%20population . Accessed 24 Feb 2025.
2. Wang L, Lu B, He M, Wang Y, Wang Z, Du L. Prostate
cancer incidence and mortality: global status and temporal
trends in 89 countries from 2000 to 2019. Front Public
Health 2022;10:811044. Crossref
3. Kesch C, Heidegger I, Kasivisvanathan V, et al. Radical
prostatectomy: sequelae in the course of time. Front Surg
2021;8:684088. Crossref
4. Deligiannis D, Anastasiou I, Mygdalis V, Fragkiadis E,
Stravodimos K. Change of practice patterns in urology
with the introduction of the Da Vinci surgical system: the
Greek NHS experience in debt crisis era. Arch Ital Urol
Androl 2015;87:56-61. Crossref
5. Harris CR, Punnen S, Carroll PR. Men with low
preoperative sexual function may benefit from nerve
sparing radical prostatectomy. J Urol 2013;190:981-6. Crossref
6. Kübler HR, Tseng TY, Sun L, Vieweg J, Harris MJ, Dahm P.
Impact of nerve sparing technique on patient self-assessed outcomes after radical perineal prostatectomy. J Urol
2007;178:488-92; discussion 492. Crossref
7. Avulova S, Zhao Z, Lee D, et al. The effect of nerve sparing
status on sexual and urinary function: 3-year results from
the CEASAR study. J Urol 2018;199:1202-9. Crossref
8. Vis AN, van den Bergh RC, van der Poel HG, et al. Selection
of patients for nerve sparing surgery in robot-assisted
radical prostatectomy. BJUI Compass 2021;3:6-18. Crossref
9. Liu Y, Deng XZ, Qin J, et al. Erectile function, urinary
continence and oncologic outcomes of neurovascular
bundle sparing robot-assisted radical prostatectomy for
high-risk prostate cancer: a systematic review and meta-analysis.
Front Oncol 2023;13:1161544. Crossref
10. Furrer MA, Sathianathen N, Gahl B, et al. Oncological
outcomes after attempted nerve-sparing radical
prostatectomy (NSRP) in patients with high-risk
prostate cancer are comparable to standard non-NSRP: a
longitudinal long-term propensity-matched single-centre
study. BJU Int 2024;133:53-62. Crossref
11. Takahara K, Sumitomo M, Fukaya K, et al. Clinical
and oncological outcomes of robot-assisted radical
prostatectomy with nerve sparing vs. non-nerve sparing for
high-risk prostate cancer cases. Oncol Lett 2019;18:3896-902. Crossref
12. Díaz-Mohedo E, Meldaña Sánchez A, Cabello Santamaría F,
Molina García E, Hernández Hernández S, Hita-Contreras F.
The Spanish version of the International Index of Erectile
Function: adaptation and validation. Int J Environ Res
Public Health 2023;20:1830. Crossref
13. Yin Y, Wang K, Xu Y, et al. The impact of using donor
sperm after ICSI failure in severe oligozoospermia on male
mental health and erectile function. J Multidiscip Healthc
2024;17:21-8. Crossref
14. Gasparini A. comoRbidity: an R package for computing
comorbidity scores. J Open Source Softw 2018;3:648. Crossref
15. Kumar A, Samavedi S, Bates AS, et al. Safety of selective
nerve sparing in high-risk prostate cancer during robotassisted
radical prostatectomy. J Robot Surg 2017;11:129-38. Crossref
16. Yuh B, Artibani W, Heidenreich A, et al. The role of robot-assisted
radical prostatectomy and pelvic lymph node
dissection in the management of high-risk prostate cancer:
a systematic review. Eur Urol 2014;65:918-27. Crossref
17. Nguyen LN, Head L, Witiuk K, et al. The risks and benefits
of cavernous neurovascular bundle sparing during radical
prostatectomy: a systematic review and meta-analysis. J
Urol 2017;198:760-9. Crossref
18. Berg KD, Thomsen FB, Hvarness H, Christensen IJ, Iversen P.
Early biochemical recurrence, urinary continence and
potency outcomes following robot-assisted radical
prostatectomy. Scand J Urol 2014;48:356-66. Crossref
19. Tal R, Alphs HH, Krebs P, Nelson CJ, Mulhall JP. Erectile
function recovery rate after radical prostatectomy: a metaanalysis.
J Sex Med 2009;6:2538-46. Crossref
20. Choi WW, Freire MP, Soukup JR, et al. Nerve-sparing
technique and urinary control after robot-assisted
laparoscopic prostatectomy. World J Urol 2011;29:21-7. Crossref
21. Ngoo KS, Honda M, Kimura Y, et al. Longitudinal study
on the impact of urinary continence and sexual function
on health-related quality of life among Japanese men after
robot-assisted radical prostatectomy. Int J Med Robot
2019;15:e2018. Crossref
22. Tang Z, Li D, Zhang X, et al. Comparison of the simplified
International Index of Erectile Function (IIEF-5) in patients
of erectile dysfunction with different pathophysiologies.
BMC Urol 2014;14:52. Crossref