Hong Kong Med J 2025;31:Epub 23 Jun 2025
© Hong Kong Academy of Medicine. CC BY-NC-ND 4.0
ORIGINAL ARTICLE
Machine learning model for prediction of coronavirus disease 2019 within 6 months after three doses of BNT162b2 in Hong Kong
Jing Tong Tan, BSc1; Ruiqi Zhang, PhD1; KH Chan, PhD2; Jian Qin, PhD3; Ivan FN Hung, MD1; KS Cheung, MD, MPH1,4
1 Department of Medicine, School of Clinical Medicine, The University of Hong Kong, Queen Mary Hospital, Hong Kong SAR, China
2 Department of Microbiology, School of Clinical Medicine, The University of Hong Kong, Queen Mary Hospital, Hong Kong SAR, China
3 Department of Medicine, Yulin Traditional Chinese Medicine Hospital, Guangxi, China
4 Department of Medicine, The University of Hong Kong–Shenzhen Hospital, Shenzhen, China
Corresponding authors: Prof Ivan FN Hung (ivanhung@hku.hk); Prof KS Cheung (cks634@hku.hk)
 Full paper in PDF
Abstract
Introduction: We aimed to develop a machine
learning (ML) model to predict the risk of
coronavirus disease 2019 (COVID-19) among three-dose
BNT162b2 vaccine recipients in Hong Kong.
Methods: A total of 304 individuals who had received
three doses of BNT162b2 were recruited from three
vaccination centres in Hong Kong between May and
August 2021. The dataset was randomly divided into
training (n=184) and testing (n=120) sets in a 6:4 ratio.
Demographics, co-morbidities and medications,
blood tests (complete blood count, liver and renal
function tests, glycated haemoglobin level, lipid
profile, and presence of hepatitis B surface antigen),
and controlled attenuation parameter (CAP) were
used to develop six ML models (logistic regression,
linear discriminant analysis, random forest, naïve
Bayes, neural network [NN], and extreme gradient
boosting models) to predict COVID-19 risk. Model
performance was assessed using area under the
receiver operating characteristic curve (AUC),
sensitivity, specificity, and positive predictive value
(PPV) and negative predictive value (NPV).
Results: Among the study population (median age:
50.9 years [interquartile range=43.6-57.8]; men:
30.9% [n=94]), 27 participants (8.9%) developed
COVID-19 within 6 months. Fifteen clinical
variables were used to train the models. The NN
model achieved the best performance, with an AUC
of 0.74 (95% confidence interval [95% CI]=0.60-0.88). Using the optimal cut-off value based on the
maximised Youden index, sensitivity, specificity,
PPV, and NPV were 90% (95% CI=55%-100%), 58%
(95% CI=48%-68%), 16% (95% CI=8%-29%), and 98%
(95% CI=92%-100%), respectively. The top predictors
in the NN model include age, prediabetes/diabetes,
CAP, alanine aminotransferase level, and aspartate
aminotransferase level.
Conclusion: An NN model integrating 15 clinical
variables effectively identified individuals at low risk
of COVID-19 following three doses of BNT162b2.
New knowledge added by this study
- A neural network model is a useful tool that effectively predicts coronavirus disease 2019 (COVID-19) risk in individuals who have received three doses of the BNT162b2 vaccine.
- Metabolic risk factors, including prediabetes/diabetes, non-alcoholic fatty liver disease, and steatohepatitis, play key roles in vaccine immunogenicity.
- Clinicians can use the model to identify high-risk patients for booster doses and preventive strategies.
- Our findings can guide targeted educational campaigns and resource allocation by identifying demographic and clinical factors associated with higher COVID-19 risk despite vaccination.
- The identification of key variables such as age, prediabetes/diabetes, and liver enzyme levels can prompt further studies to understand the underlying mechanisms and to develop more effective interventions.
Introduction
The severe acute respiratory syndrome coronavirus
2 pandemic has been a global health crisis, resulting
in substantial morbidity and mortality worldwide,
with over 13 billion vaccine doses administered.1 To mitigate the risk of breakthrough infections
by dominant Omicron variants, a third-dose
booster following two doses of BNT162b2 vaccine
(BioNTech-Pfizer, Mainz, Germany) has been rolled
out. Compared with a two-dose schedule, a third dose significantly reduces the risk of infection,
hospitalisation, and severe disease.2 3 However,
waning anti-Omicron neutralising antibody
and T cell responses have been reported even
after the booster dose,4 and sustained long-term
immunogenicity remains uncertain.
Advanced machine learning (ML) algorithms,
such as random forest, artificial neural network
(NN), and gradient boosting, have been increasingly
utilised to develop prognostic models that can
identify individuals at high risk of coronavirus disease
2019 (COVID-19). These models offer potential
to improve risk stratification and inform targeted
prevention and intervention strategies. Numerous
studies have demonstrated the development of
such models, which integrate various clinical,
demographic, and routine laboratory variables to
predict risks of COVID-19, hospitalisation, and
mortality.5 6 7 8 9 However, these previous studies did
not stratify patients by vaccination status, leading
to heterogeneous cohorts of both vaccinated and
unvaccinated individuals. This may introduce
limitations and biases in model performance, given
that vaccination status can substantially affect
COVID-19 risk and disease severity.10 11
This study focused on individuals who had
received three doses of BNT162b2, aiming to identify
the ML algorithm with optimal performance for
predicting COVID-19 risk using clinically available
data. We also sought to identify key predictors used
by the model to stratify individuals who may be more
susceptible to COVID-19 despite vaccination.
Methods
Study design and study population
This multi-centre, prospective cohort study recruited
individuals aged 18 years or above who had received
three doses of BNT162b2 vaccine from three
vaccination centres in Hong Kong, namely, Sun Yat Sen
Memorial Park Sports Centre, Queen Mary Hospital,
and Sai Ying Pun Jockey Club Polyclinic, between
May and August 2021. Participants volunteered
for the study after being informed through flyers
and announcements at the vaccination sites. All
participants were screened by a trained research
assistant using a checklist form (online Appendix)
to confirm no active COVID-19 case or a history
of the disease. Exclusion criteria included prior
COVID-19 infection identified through serological
testing for antibodies to the nucleocapsid protein
of severe acute respiratory syndrome coronavirus
2, gastrointestinal surgery, inflammatory bowel
disease, immunocompromised status (including
post-transplantation, use of immunosuppressants, or
receipt of chemotherapy), other medical conditions
(malignancy, haematological, rheumatological or
autoimmune diseases), and fewer than 14 days
between the booster dose and either the study
endpoint or the date of COVID-19 diagnosis.
Demographic and clinical information—including age, sex, body mass index (BMI), waist-to-hip ratio, smoking status, alcohol use, co-morbidities
(hypertension, diabetes mellitus, and
prediabetes), and recent medication use within 6
months of vaccination (proton pump inhibitors,
statins, metformin, antibiotics,12 antidepressants,
steroids, probiotics or prebiotics)—was collected.
Additional data included blood pressure; blood
test results (complete blood count, liver and renal
function tests,13 glycated haemoglobin [HbA1c]
level, lipid profile, and presence of hepatitis B surface
antigen); controlled attenuation parameter (CAP) to
measure liver fat14; and liver stiffness measured by
transient elastography15 using FibroScan (Echosens,
Paris, France). We also cross-checked the Hospital
Authority’s database (eg, Clinical Management
System) to verify participants’ co-morbidity
conditions.
The primary outcome was COVID-19. All
participants were prospectively followed from the
date of their third vaccine dose until either a COVID-19 diagnosis or the end of the study (18 May 2022), whichever occurred first. Monthly follow-ups were
conducted via phone calls or messages to inquire
about participants’ COVID-19 status, especially
during the fifth COVID-19 outbreak in Hong Kong
in early 2022,16 when face-to-face meetings were not
recommended. Participants were also instructed
to notify the study team if they tested positive.
COVID-19 diagnosis was based on self-reported
symptoms followed by either a rapid antigen test or
deep throat saliva reverse transcription polymerase
chain reaction test.
Model development
This was a binary classification task using supervised
learning algorithms, aiming to predict COVID-19
status after three vaccine doses. Predicted outcomes
were labelled as ‘0’ (negative) or ‘1’ (positive). The
dataset was randomly divided into training and
validation sets in a 6:4 ratio.
Data preprocessing included three steps:
missing data imputation, feature engineering, and
data transformation. First, variables with more
than 20% missing data were dropped because high
levels of missingness can hinder the accuracy and
reliability of imputation methods.17 18 Remaining
missing values were imputed using the MICE
(Multivariate Imputation by Chained Equations)
package in R software (version 4.2.1, R Foundation
for Statistical Computing, Vienna, Austria). Second,
new features were extracted from existing variables
(ie, transforming numerical variables into categorical
groups and combining similar variables). Third,
continuous variables were standardised through
centring and scaling, whereas categorical variables
were processed using one-hot encoding to ensure
data compatibility for different ML algorithms.
Feature selection involved correlation analysis
between variables and the dependent variable, the
Boruta package in R,19 literature review, and expert
consultation. A total of 37 variables were selected
and ranked based on their overall importance using
the aforementioned methods. Male sex, age ≥60
years, hepatitis B virus surface antigen positivity,
diabetes/prediabetes, and recent medication use
(antibiotics, proton pump inhibitors, probiotics/prebiotics, metformin, statins) were regarded as
categorical variables (online supplementary Table 1).
Six frequently used supervised ML models
were selected: logistic regression, linear discriminant
analysis, random forest, naïve Bayes, NN, and
extreme gradient boosting (XGBoost) [online supplementary Table 2]. Due to the imbalance in the dataset, with relatively few COVID-19 cases, multiple
models were explored to assess different strategies
for handling class imbalance. Hyperparameter
tuning was performed using the caret package in
R with grid search (3p grid size, where p represents
the number of hyperparameters) and three-fold cross-validation. The dataset was divided into three
equal subsets: the model trained on two subsets and
validated on the third; the process was repeated five
times, with the validation subset rotated each time.
Hyperparameters yielding the highest area under
the receiver operating characteristic curve (AUC)
on the validation set were selected. A loop function
was implemented to iteratively train the model while
removing a single variable from the end of the ranked
list of variables. By evaluating model performance
with different variable combinations, we identified
the most predictive variables.
A sensitivity analysis was conducted by
excluding variables not routinely available in clinical
practice (eg, CAP and liver stiffness).
Evaluation and comparison of model
performance
To compare the performance of the ML models,
we calculated AUCs and used DeLong’s test to
assess statistical significance among the AUCs. We
estimated the best cut-off point for each model
using the Youden index, selecting the threshold that
maximised the sum of sensitivity and specificity.
Using these cut-off points, we calculated performance
metrics including sensitivity, specificity, positive
predictive value (PPV), negative predictive value
(NPV), positive likelihood ratio (PLR), and negative
likelihood ratio (NLR) to identify the best model.
We also compared the miss rate (false negative
rate) across models. Given the imbalanced nature
of the dataset, precision-recall curves and F1 scores
were used. Higher F1 scores indicate better balance
between precision and recall.
All statistical analyses were conducted using
R, with packages such as caret, randomForest,
naivebayes, nnet, xgboost, pROC, and
SHAPforxgboost for model building, evaluation,
and interpretation. The DTComPair package
was used to compare performance metrics.20
Continuous variables were summarised as medians
and interquartile ranges (IQRs), with comparisons
performed using the Wilcoxon rank-sum test.
Categorical variables were presented as counts
and percentages, and compared using Pearson’s
Chi squared test or Fisher’s exact test, applying
Bonferroni correction for multiple comparisons.
SHapley Additive exPlanations (SHAP) analysis was
utilised to interpret complex models by generating
SHAP values to determine feature impact.
Results
Patient characteristics
A total of 304 three-dose BNT162b2 recipients
were identified between May and August 2021 (Fig 1a). The median age was 50.9 years (IQR=43.6-57.8), and 94 participants (30.9%) were men. Over a median follow-up of 2.6 months (IQR=1.8-3.1;
up to 5.1 months), 27 participants (8.9%) tested
positive for COVID-19. The dataset was randomly
split into training and testing sets, comprising 184
(60.5%) and 120 (39.5%) participants, respectively.
Table 1 summarises baseline characteristics,
stratified by the outcome of interest (COVID-19
status) and by training and testing sets. Baseline
characteristics prior to imputation are shown in
online supplementary Table 3.
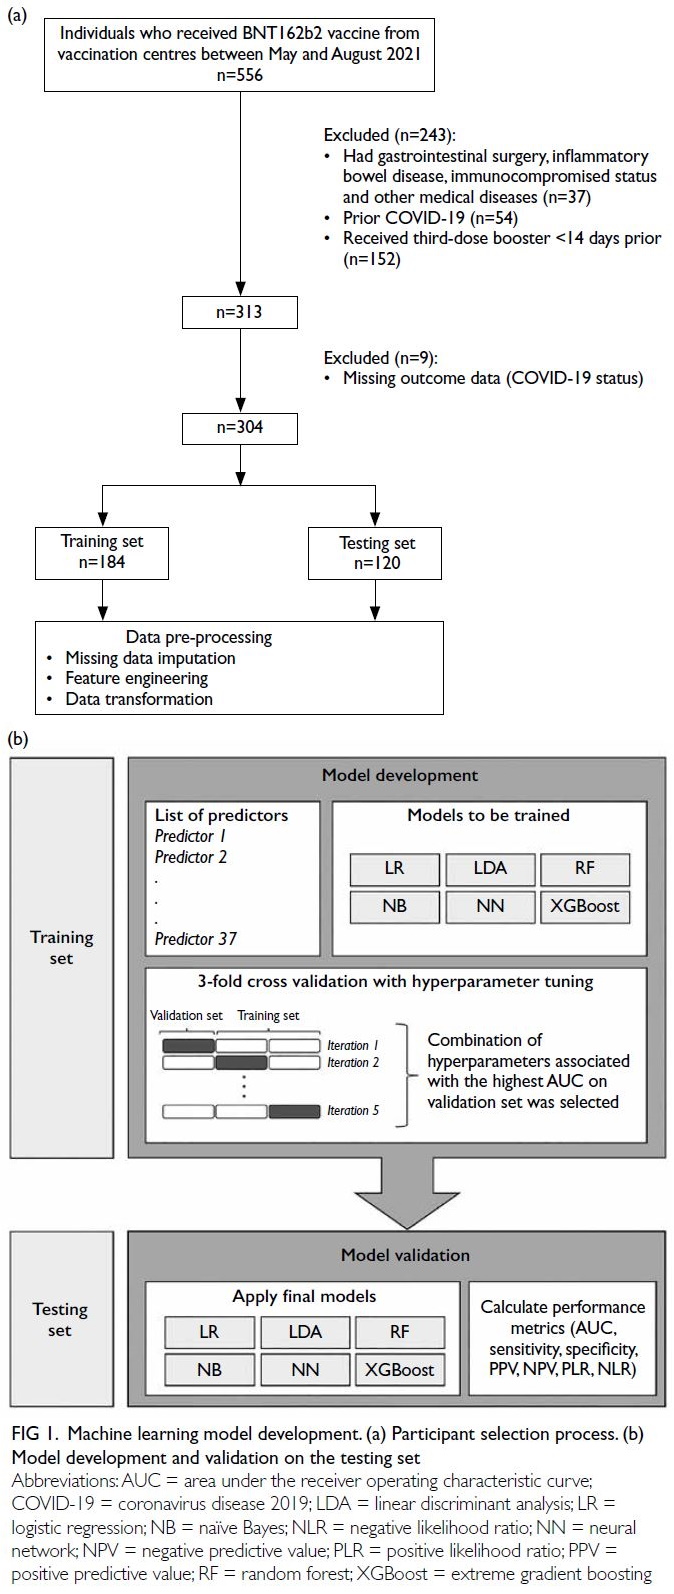
Figure 1. Machine learning model development. (a) Participant selection process. (b) Model development and validation on the testing set
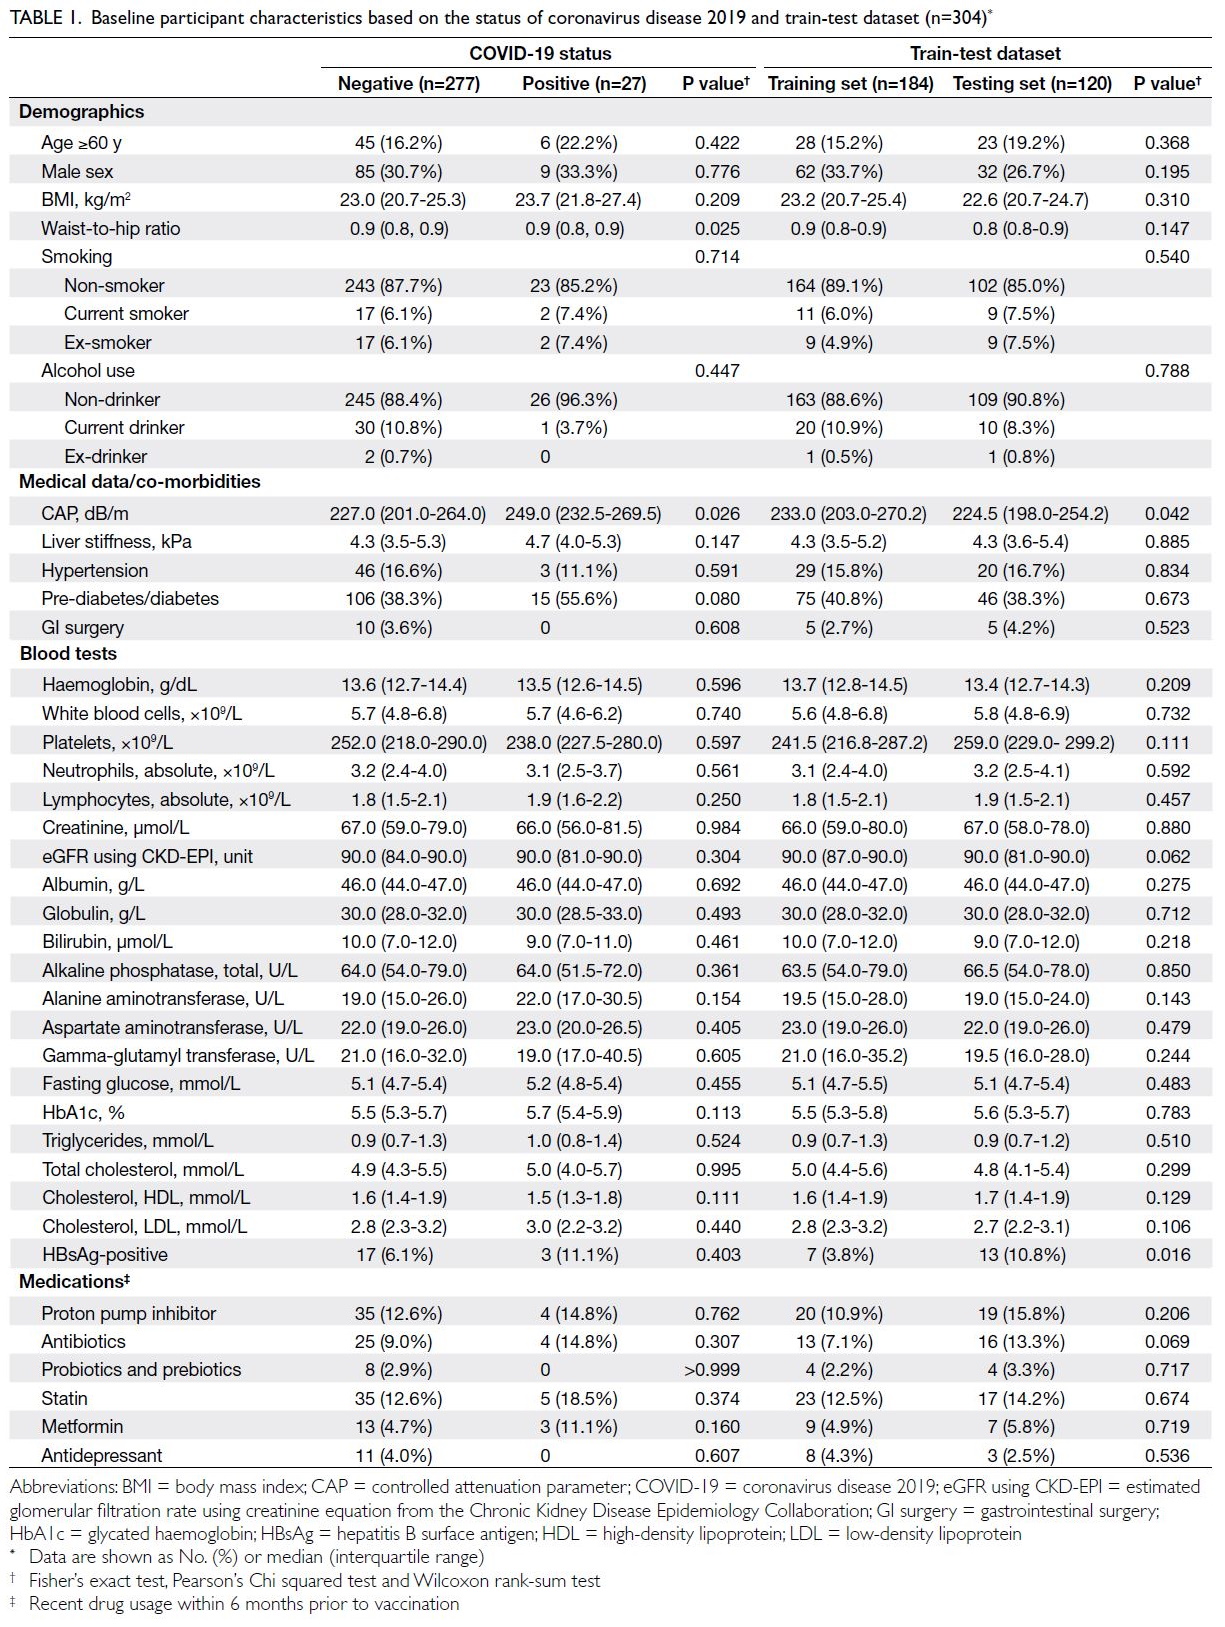
Table 1. Baseline participant characteristics based on the status of coronavirus disease 2019 and train-test dataset (n=304)
The COVID-19-positive patients had worse
medical conditions than those tested negative.
Specifically, they were older (with a higher proportion
aged ≥60 years: 22.2% vs 16.2%), predominantly
male (33.3% vs 30.7%), had greater liver fat content
(median CAP: 249.0 dB/m vs 227.0 dB/m), and
were more frequently diagnosed with prediabetes/diabetes (55.6% vs 38.3%). Both the training
and testing sets had a comparable proportion of
COVID-19–positive cases (8.3-9.2%). Most
independent variables were similarly distributed
between sets (P>0.05), although CAP differed
significantly (Table 1).
Performance of different machine learning
models
We trained six different ML algorithms on the training
set to predict COVID-19. Model performance was
evaluated using three-fold cross-validation (Fig 1b).
Concerning the testing set, performance metrics
for each model are reported in Table 2 and AUCs
are summarised in Figure 2. A comparison of AUCs
between training and testing sets for the six ML
models is presented in online supplementary Figure 1. All models showed a slight decrease in AUC from
the training to the testing set, indicating some degree
of overfitting. Notably, the NN model did not exhibit
a significant AUC reduction, suggesting it was less
susceptible to overfitting than other models.
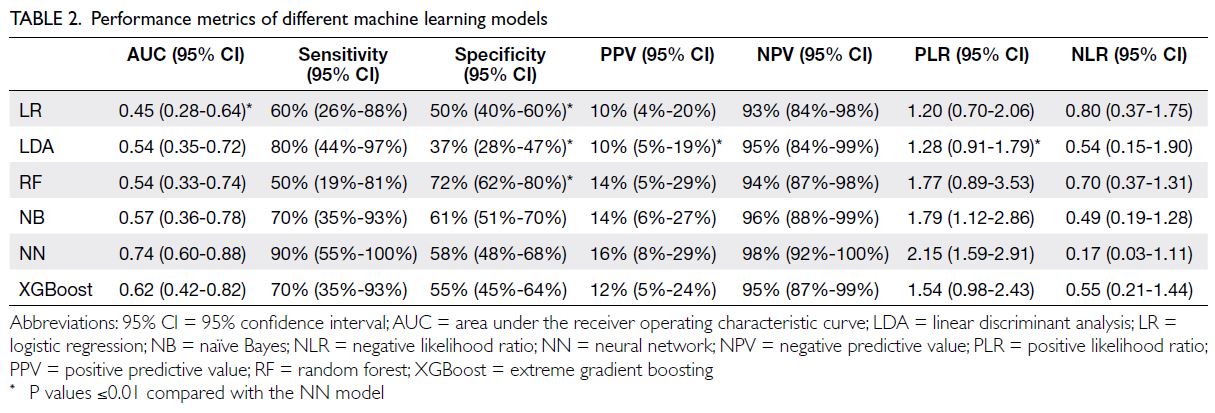
Table 2. Performance metrics of different machine learning models
Of the six ML models evaluated, the NN
algorithm performed best (AUC: 0.74, 95% CI=0.60-0.88), followed by XGBoost (AUC: 0.62, 95%
CI=0.42-0.82) [Fig 2]. Using the optimal cut-off
value estimated by the maximum Youden index,
performance metrics are summarised in Table 2.
The 2×2 confusion matrix tables, which summarise
the numbers of true positives, true negatives, false
positives, and false negatives for each model’s
predictions, are shown in online supplementary Table 4. Multiple comparisons between the NN and
other models in terms of performance metrics are
presented in online supplementary Table 5.
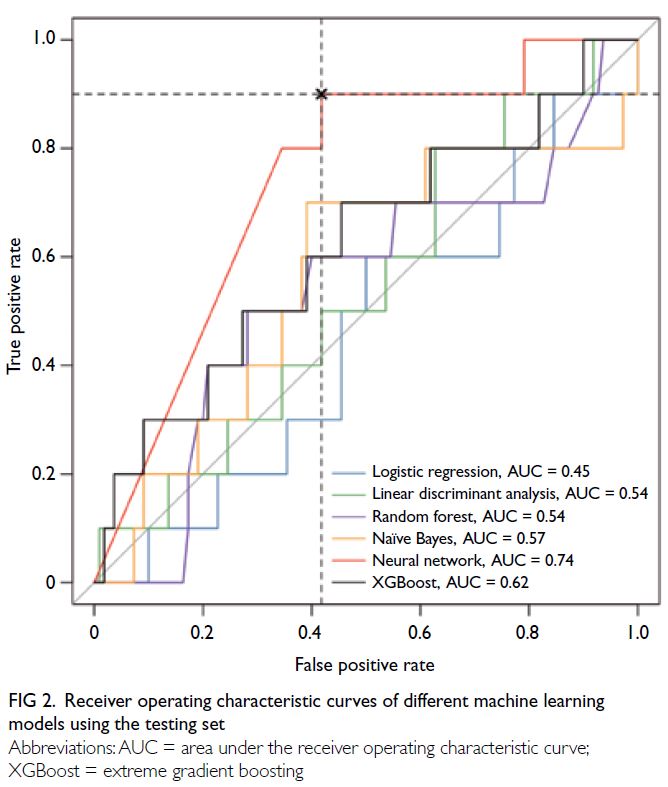
Figure 2. Receiver operating characteristic curves of different machine learning models using the testing set
The NN and linear discriminant analysis
models achieved the highest sensitivity, with values
of 90% (95% CI=55%-100%) and 80% (95% CI=44%-97%), respectively. The random forest model had the
best specificity (72%, 95% CI=62%-80%). The NN
model also had the highest NPV (98%, (95% CI=92%-100%) and the best likelihood ratios (PLR: 2.15,
95% CI=1.59-2.91; NLR: 0.17, 95% CI=0.03-1.11)
[Table 2]. It classified 45.8% of participants as high
risk for COVID-19, with a miss rate or false negative
rate of 10% (Table 3). Precision-recall curves
and F1 scores for all models are shown in online supplementary Figure 2, offering a more precise evaluation of model performance in the context of
an imbalanced dataset. With a precision baseline
of 0.092, naïve Bayes and random forest models
recorded AUC values of around 0.10, reflecting
modest discrimination ability under class imbalance.
The NN model achieved an F1 score of 0.277,
highlighting a better balance between precision and
recall.
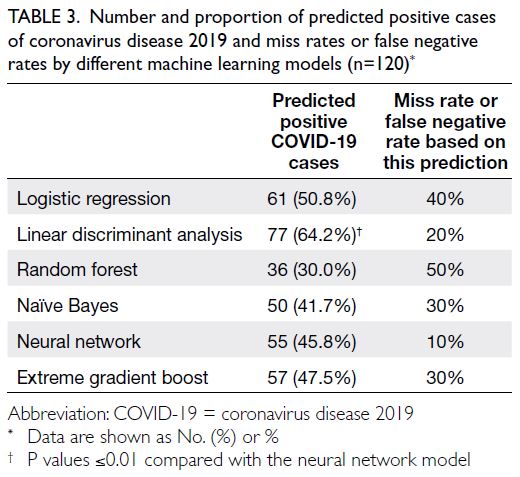
Table 3. Number and proportion of predicted positive cases of coronavirus disease 2019 and miss rates or false negative rates by different machine learning models (n=120)
Crucial risk factors associated with
coronavirus disease 2019 in the neural network model
According to the best-performing model (the NN
model), the five most important predictors of
COVID-19 risk were CAP, alanine aminotransferase
level, age (≥60 years), presence of prediabetes/diabetes, and aspartate aminotransferase (AST)
level, with relative importance values of 14.9%,
10.1%, 9.4%, 8.4%, and 7.9%, respectively (Fig 3).
These were further confirmed by SHAP analysis,
a method specifically compatible with ensemble
algorithms (ie, XGBoost) that quantifies the
contribution of each input variable to the model’s
prediction. When SHAP analysis was applied to the
second best-performing model (XGBoost), leading
variables remained similar to those in the NN model,
except for BMI which ranked highest in importance
(with a mean absolute SHAP value of 0.992) in the
XGBoost model (online supplementary Fig 3). The
SHAP analysis in online supplementary Figure 3b
also provided deeper insights into the contribution
of each variable to the model’s prediction. Among
leading variables in the XGBoost model, higher CAP
(red dots), lower BMI (blue dots), and age ≥60 years
(red dots) had a positive impact (right side of the
plot) on COVID-19 prediction. In terms of high-density
lipoprotein (HDL) and AST levels, the SHAP
plot showed a wide distribution with mixed colours,
suggesting that HDL and AST levels had diverse
impacts on COVID-19 prediction.
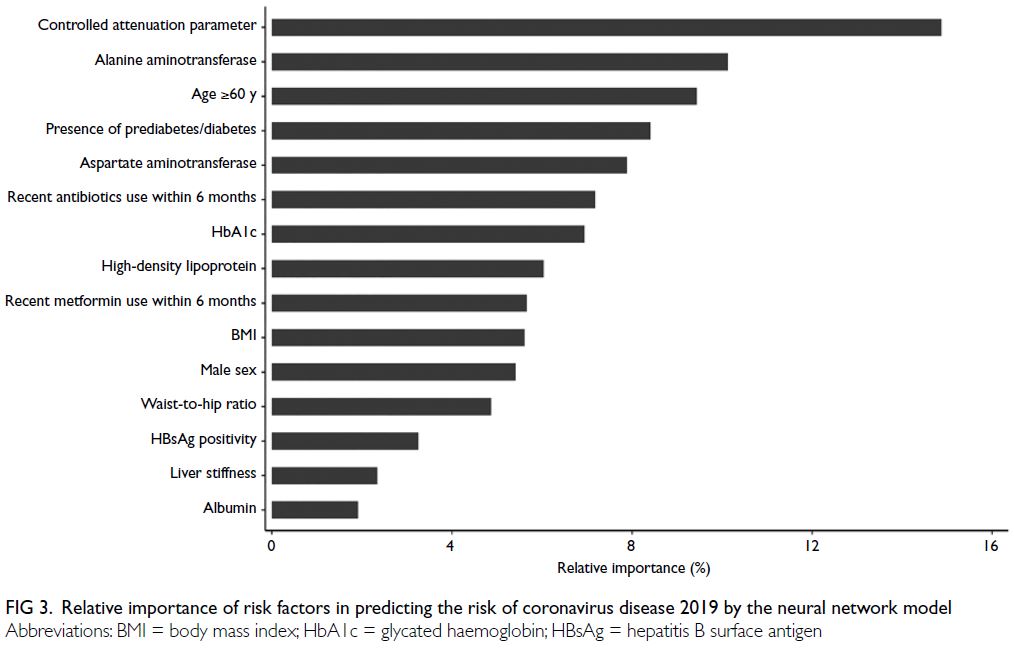
Figure 3. Relative importance of risk factors in predicting the risk of coronavirus disease 2019 by the neural network model
Sensitivity analysis excluding non-routine
clinical variables
Excluding CAP and liver stiffness, XGBoost
achieved the best performance (AUC: 0.66, 95%
CI=0.50-0.82), followed by naïve Bayes, logistic
regression, linear discriminant analysis, random
forest, and NN models (AUCs: 0.49- 0.63) [online supplementary Fig 4]. The top five predictors in the
XGBoost model were BMI, alanine aminotransferase level, HDL level, HbA1c level, and age ≥60 years
(online supplementary Fig 5). In the NN model, the
top predictors were AST level, HbA1c level, HDL
level, hepatitis B virus antigen positivity, and alanine
aminotransferase level (online supplementary Fig 6).
Discussion
In this study involving three-dose BNT162b2
recipients, the NN model achieved satisfactory
performance in predicting COVID-19 using baseline
clinical data. The leading predictors identified were
age ≥60 years, presence of prediabetes/diabetes,
CAP, alanine aminotransferase level, and AST
level, highlighting the need for vigilance among
fully vaccinated individuals, especially those with
concomitant co-morbidities.
Advanced age, prediabetes/diabetes, and
abnormal liver condition (ie, high fatty liver
content and abnormal liver function test results)
were significant predictors of high infection risk,
consistent with previous studies.21 22 23 24 25 A meta-analysis
of 18 studies revealed a higher prevalence of diabetes
(11.5%) among hospitalised COVID-19 patients21
compared to the general population (9.3%).26 Studies
have found that the presence of preexisting diabetes
or hyperglycaemia is associated with higher risks
of severe illness, mortality, and complications
in COVID-19 patients.22 23 This elevated risk is
likely due to impaired immune function, chronic
inflammation, and common cardiovascular and metabolic co-morbidities in diabetic patients.27 28
Individuals with liver diseases or abnormal liver
function test results also exhibit higher risks of
severe COVID-19 and complications.24 25
This study is among the few that have developed
ML models to predict COVID-19 in recipients of
three doses of BNT162b2. No prior studies have
developed COVID-19 prognostic models with
clear information on vaccination status, type,
and number of doses. A study from Hong Kong11
showed that a timely third vaccine dose strongly
protected against Omicron BA.2 variant infections,
the dominant strain in Hong Kong during our study
period. The effectiveness of vaccination against
infection declined over time after two doses but was
restored to a high level after a third dose, resulting in
significantly lower risks of infection, hospitalisation,
and severe illness compared with those who
received only two doses.2 3 By including only three-dose
vaccinated patients in the development of ML
models, the resulting models may be more accurate
in predicting COVID-19 risk and severity among
vaccinated individuals. This can be particularly
important in settings where vaccination rates are
high and breakthrough infections are a concern; it
may help identify individuals with higher infection
risk who could benefit from additional precautions
or interventions.
Strengths and limitations
Our study offers practical value by enabling risk
stratification, allowing healthcare providers to
focus resources on higher-risk populations. It
informs public health strategies by identifying
factors associated with increased COVID-19 risk
despite vaccination, guiding targeted campaigns and
resource allocation. Additionally, an understanding
of risk predictors in vaccinated individuals supports
tailored booster strategies. The identification of key
variables such as age, prediabetes/diabetes, and liver
enzyme levels also encourages further research into
underlying mechanisms and potential interventions.
However, this study had some limitations.
First, the small sample size (~300 participants) may
affect model performance and generalisability. The
dataset size was constrained by specific inclusion
criteria, but this represented the maximum size
available for model training. We believe that selection
of high-quality data maximises training efficacy.
Second, we did not include gut microbiota data,
which may be associated with COVID-19 vaccine
immunogenicity.29 A focus on readily available
clinical data facilitates practical and clinically relevant
predictive models. Third, our dataset exhibited
significant class imbalance, such that only 8.9% of
participants developed COVID-19 within 6 months.
Whereas receiver operating characteristic curve
analysis provides an optimistic assessment, we also used precision-recall curves and F1 scores for a more
realistic evaluation. Fourth, although missing values
for certain variables might introduce error into the
prediction models, the small percentage of missing
data and the use of multiple imputation likely had
minimal impact on model accuracy. Fifth, COVID-19
cases were self-reported and confirmed by either
rapid antigen or polymerase chain reaction tests. In
Hong Kong, rapid antigen tests have a false negative
rate of approximately 15% (sensitivity: 85%)30 but
a high specificity of 99.93%,30 indicating very few
false positives. Although some cases may have gone
unreported or untested, we believe that the majority
adhered to testing requirements as mandated
by law. Additionally, we did not grade infection
severity, and there were no hospitalised cases in our
cohort, limiting our ability to predict hospitalisation
outcomes in this study. Sixth, the NN model—our
best-performing model—is complex and has low
interpretability. We used a variable importance plot
to visualise and identify the most influential features,
enhancing its practical application. It should be noted
that the other models demonstrated suboptimal
performance, with AUCs below 0.7. The NN model’s
superior performance is likely due to its ability to
capture complex patterns and interactions. Simpler
models struggled with the dataset’s complexity, class
imbalance, non-linear relationships, and outliers.
Finally, although this study offers insights into the
use of advanced ML models to predict COVID-19
outcomes, its generalisability is limited. Overfitting
remains a concern despite mitigation techniques (eg,
regularisation, pruning, and ensemble methods).
The complexity of our models and the dataset hinder
generalisability. Variability in vaccines, booster
intervals, doses, demographics, and study design
further impacts the generalisability of our model.
Future studies should include diverse populations
and vaccine types to enhance applicability. External
validation of our results in other centres is also
warranted.
Conclusion
The NN model is a useful tool for identifying
individuals at low risk of COVID-19 within 6 months
after receiving three doses of BNT162b2. Key
features selected by the model highlight the central
role of metabolic risk factors (prediabetes/diabetes,
non-alcoholic fatty liver disease, and steatohepatitis)
in vaccine immunogenicity.
Author contributions
Concept or design: JT Tan, KS Cheung.
Acquisition of data: JT Tan, R Zhang, KH Chan.
Analysis or interpretation of data: JT Tan, KS Cheung.
Drafting of the manuscript: JT Tan.
Critical revision of the manuscript for important intellectual content: KS Cheung, IFN Hung.
Acquisition of data: JT Tan, R Zhang, KH Chan.
Analysis or interpretation of data: JT Tan, KS Cheung.
Drafting of the manuscript: JT Tan.
Critical revision of the manuscript for important intellectual content: KS Cheung, IFN Hung.
All authors had full access to the data, contributed to the study, approved the final version for publication, and take responsibility for its accuracy and integrity.
Conflicts of interest
All authors have disclosed no conflicts of interest.
Funding/support
This research was funded by the Health and Medical Research
Fund of the former Food and Health Bureau, Hong Kong
SAR Government (Ref No.: COVID1903010, Project 16).
The funder had no role in the study design, data collection/analysis/interpretation, or manuscript preparation.
Ethics approval
The research was approved by the Institutional Review
Board of The University of Hong Kong/Hospital Authority
Hong Kong West Cluster, Hong Kong (Ref No.: UW 21-216).
Participants provided written informed consent to participate
in this study.
Supplementary material
The supplementary material was provided by the authors and
some information may not have been peer reviewed. Accepted
supplementary material will be published as submitted by the
authors, without any editing or formatting. Any opinions
or recommendations discussed are solely those of the
author(s) and are not endorsed by the Hong Kong Academy
of Medicine and the Hong Kong Medical Association.
The Hong Kong Academy of Medicine and the Hong Kong
Medical Association disclaim all liability and responsibility
arising from any reliance placed on the content.
References
1. World Health Organization. WHO Coronavirus
(COVID-19) Dashboard. 2023. Available from: https://data.who.int/dashboards/covid19/cases. Accessed 4 May 2023.
2. Andrews N, Stowe J, Kirsebom F, et al. Effectiveness of
COVID-19 booster vaccines against COVID-19–related
symptoms, hospitalization and death in England. Nat Med
2022;28:831-37. Crossref
3. Andrews N, Stowe J, Kirsebom F, et al. COVID-19 vaccine
effectiveness against the Omicron (B.1.1.529) variant. N
Engl J Med 2022;386:1532-46. Crossref
4. Peng Q, Zhou R, Wang Y, et al. Waning immune responses
against SARS-CoV-2 variants of concern among vaccinees
in Hong Kong. EBioMedicine 2022;77:103904. Crossref
5. Willette AA, Willette SA, Wang Q, et al. Using machine
learning to predict COVID-19 infection and severity risk
among 4510 aged adults: a UK Biobank cohort study. Sci
Rep 2022;12:7736. Crossref
6. Wynants L, Van Calster B, Collins GS, et al. Prediction
models for diagnosis and prognosis of COVID-19:
systematic review and critical appraisal. BMJ
2020;369:m1328. Crossref
7. Subudhi S, Verma A, Patel AB, et al. Comparing machine
learning algorithms for predicting ICU admission and
mortality in COVID-19. NPJ Digit Med 2021;4:87. Crossref
8. Brinati D, Campagner A, Ferrari D, Locatelli M, Banfi G,
Cabitza F. Detection of COVID-19 infection from routine
blood exams with machine learning: a feasibility study. J
Med Syst 2020;44:135. Crossref
9. Yao H, Zhang N, Zhang R, et al. Severity detection for
the coronavirus disease 2019 (COVID-19) patients using
a machine learning model based on the blood and urine
tests. Front Cell Dev Biol 2020;8:683. Crossref
10. Baden LR, El Sahly HM, Essink B, et al. Efficacy and safety
of the mRNA-1273 SARS-CoV-2 vaccine. N Engl J Med
2021;384:403-16. Crossref
11. Zhou R, Liu N, Li X, et al. Three-dose vaccination–induced
immune responses protect against SARS-CoV-2 Omicron
BA.2: a population-based study in Hong Kong. Lancet Reg
Health West Pac 2023;32:100660. Crossref
12. Cheung KS, Lam LK, Zhang R, et al. Association between
recent usage of antibiotics and immunogenicity within
six months after COVID-19 vaccination. Vaccines (Basel)
2022;10:1122. Crossref
13. Cheung KS, Mok CH, Mao X, et al. COVID-19 vaccine
immunogenicity among chronic liver disease patients
and liver transplant recipients: a meta-analysis. Clin Mol
Hepatol 2022;28:890-911. Crossref
14. Cheung KS, Lam LK, Hui RW, et al. Effect of moderate-to-severe
hepatic steatosis on neutralising antibody response
among BNT162b2 and CoronaVac recipients. Clin Mol
Hepatol 2022;28:553-64. Crossref
15. Cheung KS, Lam LK, Mao X, et al. Effect of moderate
to severe hepatic steatosis on vaccine immunogenicity
against wild-type and mutant virus and COVID-19
infection among BNT162b2 recipients. Vaccines (Basel)
2023;11:497. Crossref
16. Cheung PH, Chan CP, Jin DY. Lessons learned from the
fifth wave of COVID-19 in Hong Kong in early 2022.
Emerg Microbes Infect 2022;11:1072-8. Crossref
17. Little RJ, Rubin DB. Statistical Analysis with Missing Data,
3rd edition. New York [NY]: John Wiley & Sons; 2019. Crossref
18. Dong Y, Peng CY. Principled missing data methods for
researchers. Springerplus 2013;2:222. Crossref
19. Kursa MB, Rudnicki WR. Feature selection with the Boruta
package. J Stat Softw 2010;36:1-13. Crossref
20. Kitcharanant N, Chotiyarnwong P, Tanphiriyakun T, et al.
Development and internal validation of a machine-learning–developed model for predicting 1-year mortality
after fragility hip fracture. BMC Geriatr 2022;22:451. Crossref
21. Singh AK, Gillies CL, Singh R, et al. Prevalence of co-morbidities
and their association with mortality in patients
with COVID-19: a systematic review and meta-analysis.
Diabetes Obes Metab 2020;22:1915-24. Crossref
22. Zhu L, She ZG, Cheng X, et al. Association of blood glucose
control and outcomes in patients with COVID-19 and pre-existing
type 2 diabetes. Cell Metab 2020;31:1068-77.e3. Crossref
23. Yang JK, Feng Y, Yuan MY, et al. Plasma glucose levels
and diabetes are independent predictors for mortality and
morbidity in patients with SARS. Diabet Med 2006;23:623-8. Crossref
24. Singh S, Khan A. Clinical characteristics and outcomes of
coronavirus disease 2019 among patients with preexisting
liver disease in the United States: a multicenter research
network study. Gastroenterology 2020;159:768-771.e3. Crossref
25. Simon TG, Hagström H, Sharma R, et al. Risk of severe
COVID-19 and mortality in patients with established
chronic liver disease: a nationwide matched cohort study. BMC Gastroenterol 2021;21:439. Crossref
26. Saeedi P, Petersohn I, Salpea P, et al. Global and regional
diabetes prevalence estimates for 2019 and projections
for 2030 and 2045: results from the International Diabetes
Federation Diabetes Atlas, 9th edition. Diabetes Res Clin
Pract 2019;157:107843. Crossref
27. Pal R, Bhadada SK. COVID-19 and diabetes mellitus: an
unholy interaction of two pandemics. Diabetes Metab
Syndr 2020;14:513-7. Crossref
28. Azar WS, Njeim R, Fares AH, et al. COVID-19 and diabetes
mellitus: how one pandemic worsens the other. Rev Endocr
Metab Disord 2020;21:451-63. Crossref
29. Ng HY, Leung WK, Cheung KS. Association between
gut microbiota and SARS-CoV-2 infection and vaccine
immunogenicity. Microorganisms 2023;11:452. Crossref
30. Zee JS, Chan CT, Leung AC, et al. Rapid antigen test during
a COVID-19 outbreak in a private hospital in Hong Kong.
Hong Kong Med J 2022;28:300-5. Crossref