Hong Kong Med J 2024 Apr;30(2):130-8 | Epub 28 Mar 2024
© Hong Kong Academy of Medicine. CC BY-NC-ND 4.0
ORIGINAL ARTICLE
Prediction of hospital mortality among critically ill patients in a single centre in Asia: comparison of artificial neural networks and logistic regression–based model
Swan Lau, BSc, MB, BS1; HP Shum, MD, FRCP2; Carol CY Chan, FHKCA, FHKAM (Anaesthesiology)2; MY Man, MRCP (UK), FHKAM (Medicine)2; KB Tang, FHKCA, FHKAM (Anaesthesiology)2; Kenny KC Chan, MStat, FHKAM (Anaesthesiology)3; Anne KH Leung, FHKCA (IC), FCICM4; WW Yan, FRCP, FHKAM (Medicine)2
1 Department of Anaesthesia, Pain and Perioperative Medicine, Queen Mary Hospital, Hong Kong SAR, China
2 Department of Intensive Care, Pamela Youde Nethersole Eastern Hospital, Hong Kong SAR, China
3 Department of Anaesthesia and Intensive Care, Tuen Mun Hospital, Hong Kong SAR, China
4 Department of Intensive Care, Queen Elizabeth Hospital, Hong Kong SAR, China
Corresponding author: Dr S Lau (ls037@ha.org.hk)
 Full paper in PDF
Abstract
Introduction: This study compared the performance
of the artificial neural network (ANN) model with
the Acute Physiologic and Chronic Health Evaluation
(APACHE) II and IV models for predicting hospital
mortality among critically ill patients in Hong Kong.
Methods: This retrospective analysis included
all patients admitted to the intensive care unit of
Pamela Youde Nethersole Eastern Hospital from
January 2010 to December 2019. The ANN model
was constructed using parameters identical to the
APACHE IV model. Discrimination performance
was assessed using area under the receiver
operating characteristic curve (AUROC); calibration
performance was evaluated using the Brier score and
Hosmer–Lemeshow statistic.
Results: In total, 14 503 patients were included, with
10% in the validation set and 90% in the ANN model
development set. The ANN model (AUROC=0.88,
95% confidence interval [CI]=0.86-0.90, Brier
score=0.10; P in Hosmer–Lemeshow test=0.37)
outperformed the APACHE II model (AUROC=0.85,
95% CI=0.80-0.85, Brier score=0.14; P<0.001 for
both comparisons of AUROCs and Brier scores)
but showed performance similar to the APACHE
IV model (AUROC=0.87, 95% CI=0.85-0.89, Brier
score=0.11; P=0.34 for comparison of AUROCs, and
P=0.05 for comparison of Brier scores). The ANN model demonstrated better calibration than the
APACHE II and APACHE IV models.
Conclusion: Our ANN model outperformed the
APACHE II model but was similar to the APACHE
IV model in terms of predicting hospital mortality
in Hong Kong. Artificial neural networks are
valuable tools that can enhance real-time prognostic
prediction.
New knowledge added by this study
- An artificial neural network model outperformed the Acute Physiologic and Chronic Health Evaluation (APACHE) II model but was similar to the APACHE IV model in terms of predicting hospital mortality.
- The three most important predictor variables were the highest sodium level, highest bilirubin level, and lowest white cell count within 24 hours of intensive care unit admission.
- External validation studies using data from other hospitals are recommended to confirm these findings.
- Prediction of mortality among critically patients is challenging.
- Artificial neural networks, along with other machine learning techniques, are valuable tools that can enhance real-time prognostic prediction.
Introduction
Intensive care treatments are primarily intended to
improve patient outcomes. Considering the high
operating costs of intensive care units (ICUs), a
reliable, decision-supporting, risk stratification
system is needed to predict patient outcomes and facilitate cost-effective use of ICU beds.
Several disease severity scoring systems, such
as the Acute Physiology and Chronic Health
Evaluation (APACHE) system and the Simplified
Acute Physiology Score system, are currently
used to objectively assess outcomes and recovery potential in this complex and diverse group of patients.1 2
The APACHE system, one of the most
commonly used benchmark severity scoring systems
worldwide, can measure disease severity and predict
hospital mortality among ICU patients. In the 40
years since its initial development, the APACHE
system has undergone multiple revisions to improve
statistical power and discrimination performance
by modifying the numbers and weights of included
variables.3 4 5 6 The underlying statistical principle
is multivariable logistic regression based on data
from an American population. The results are easy
to interpret and allow robust outcome prediction
for individuals with characteristics similar to
the original population. However, the APACHE
system has limited capacity to manage non-linear
relationships between predictor and outcome
variables, interactions between variables, and
missing data. Although the value of the APACHE
system for mortality prediction has been established,
especially in Western countries, its discrimination
performance and calibration are inconsistent when
applied outside of the US.7 8 9 10 Since 2008, the Hospital
Authority in Hong Kong has utilised the APACHE IV model to assess outcomes in critically ill patients.
Nevertheless, the APACHE II model remains the
most extensively validated version; it is widely used
for research and reference purposes.11
In the early 1990s, artificial neural networks
(ANNs), a type of machine learning algorithm,
were proposed as alternative statistical techniques
to logistic regression–based method. Similar to the
organisation and data processing configurations in
human brains, these networks consist of input and
output layers with at least one or more intermediate
(hidden) layers for pattern recognition. Each layer
contains several ‘artificial neurons’, known as nodes,
for data extraction; these nodes are connected with
each other through variable ‘weights’.12 Artificial
neural networks identify representative patterns
from input data and observed output data within
a training set, then fine-tune the variable weights;
thus, they can predict outcomes when provided
novel information. This method has considerable
advantages in terms of managing non-linear
relationships and multivariable interactions.13
A review of 28 studies comparing ANN
and regression-based models showed that ANN
outperformed regression-based models in 10
studies (36%), was outperformed by regression-based
models in four studies (14%), and had similar
performance in the remaining 14 studies (50%).14
Multiple recent studies also demonstrated that the
integration of machine learning with electronic
health records provided more accurate and reliable
predictive performance compared with conventional
prognostic models.15 16
This study was conducted to compare ANN
performance with the performances of extensively
validated and benchmark scoring systems—APACHE II and APACHE IV—in terms of predicting
hospital mortality among critically ill patients in
Hong Kong.
Methods
This retrospective analysis included all patients
aged ≥18 years with first-time admissions to the
ICU of Pamela Youde Nethersole Eastern Hospital
between 1 January 2010 and 31 December 2019. The
hospital is a 2000-bed tertiary care regional hospital
that provides comprehensive services except for
cardiothoracic surgery, transplant surgery, and
burn management. The ICU is a 24-bed, closed,
mixed medical-surgical unit with an average of 1600
patients admitted annually.
Demographic characteristics and hospital
mortality data were retrospectively recorded.
The worst value of each physiological parameter
during the first 24 hours after ICU admission was
used to generate an APACHE score. The predicted
mortality risk was calculated based on published methods.3 5 Included parameters were age, sex,
systolic and diastolic blood pressures, temperature,
heart rate, respiratory rate, glucose level, blood
urea nitrogen level, serum sodium level, creatinine
level, haematocrit level, white cell count, albumin
level, bilirubin level, pH, fraction of inspired oxygen,
partial pressures of carbon dioxide and oxygen,
bicarbonate, and urine output during the first 24
hours after ICU admission. For patients who had
multiple ICU admissions during a single hospital
stay, only the first admission was included. Patients
were excluded if they died or were discharged from
the ICU within 4 hours after admission.
Instances of incomplete data were resolved by
multiple imputation using the Markov chain Monte
Carlo algorithm (ie, fully conditional specification).
This method fits a univariate (single dependent
variable) model using all other available variables
in the model as predictors, then imputes missing
values for the dependent variable. The method
continues until the maximum number of iterations
is reached; the resulting imputed values are saved to
the imputed dataset.
Neural network models were constructed with
SPSS software (Windows version 25.0; IBM Corp,
Armonk [NY], US) using the same parameters as
in the APACHE IV model (online supplementary Fig); SPSS software was also used to examine model
precision. The multilayer perceptron procedure,
a class of feed-forward learning model, consists
of ≥3 layers of nodes: input, hidden, and output.17
Automatic architecture building, which computes
the best number of units in a hidden layer, was
performed with SPSS software. Each hidden unit is
an activation function of the weighted sum of the
inputs; the values of the weights are determined by
an estimation algorithm. In this study, the hidden
layer consisted of 12 units (nodes). A hyperbolic
tangent activation function was also employed for
the hidden layers. Softmax activation and cross-entropy
error functions were used for the output
layer. The multilayer perceptron procedure utilised a
backpropagation technique for supervised training.
Learning occurred in the recognition phase for each
piece of data via changes to connection weights based
on the amount of error in the output compared with
the expected result (gradient descent method).18
The training process was terminated when no
further decreases in calculated error were observed.
Subsequently, network weights were identified and
used to compute test values. The importance of an
independent variable was regarded as a measure
of the extent to which network model–predicted
values differed from observed values. Normalised
importance, expressed as a percentage, constituted
the ratio between the importance of each predictor
variable and the largest importance value. Model
stability was assessed by tenfold cross-validation. Oversampling of minority classes was performed via
duplication to manage imbalances in outcome data.
Categorical and continuous variables were
expressed as numbers (percentages) and medians
(interquartile ranges). The Chi squared test or Fisher’s
exact test was used for comparisons of categorical
data; the Mann-Whitney U test was used for
comparisons of continuous data. The performances
of ANN, APACHE II, and APACHE IV models were
evaluated in terms of discrimination and calibration
power. Discrimination, which constitutes the ability
of a predictive model to separate data into classes
(eg, death or survival), was evaluated using the
area under the receiver operating characteristic
curve (AUROC). The AUROCs of the models were
compared using the DeLong test. Calibration, which
represents the closeness of model probability to the
underlying probability of the study population, was
evaluated using the Brier score, Hosmer–Lemeshow
statistic, and calibration curves.19 All P values
were two-sided, and values < 0.05 were considered
statistically significant. All analyses were performed
with SPSS software and MedCalc statistical software
(version 19.6.1).
Results
In total, 14 503 patients were included. The
demographic characteristics and hospital mortality
data of the study cohort were shown in Table 1, while
the physiological and laboratory parameters required
to generate an APACHE score were presented in
Table 2. Among the recruited patients, 4.93% had at
least one missing data point, and the overall rate of
missing data was 0.48%. Furthermore, 1400 (9.7%)
of the recruited patients were randomly assigned to
the validation set; the remaining patients (n=13 103,
90.3%) were assigned to the model development set.
With respect to the ANN model, 70% and 30% of the
development set were used for training and testing
purposes, respectively. The median age was 67 years
(interquartile range [IQR]=54-78), median APACHE
II score was 18 (IQR=13-25), and median APACHE
IV score was 66 (IQR=46-91). The overall hospital
and ICU mortality rates were 19.3% (n=2799) and
9.6% (n=1392), respectively.
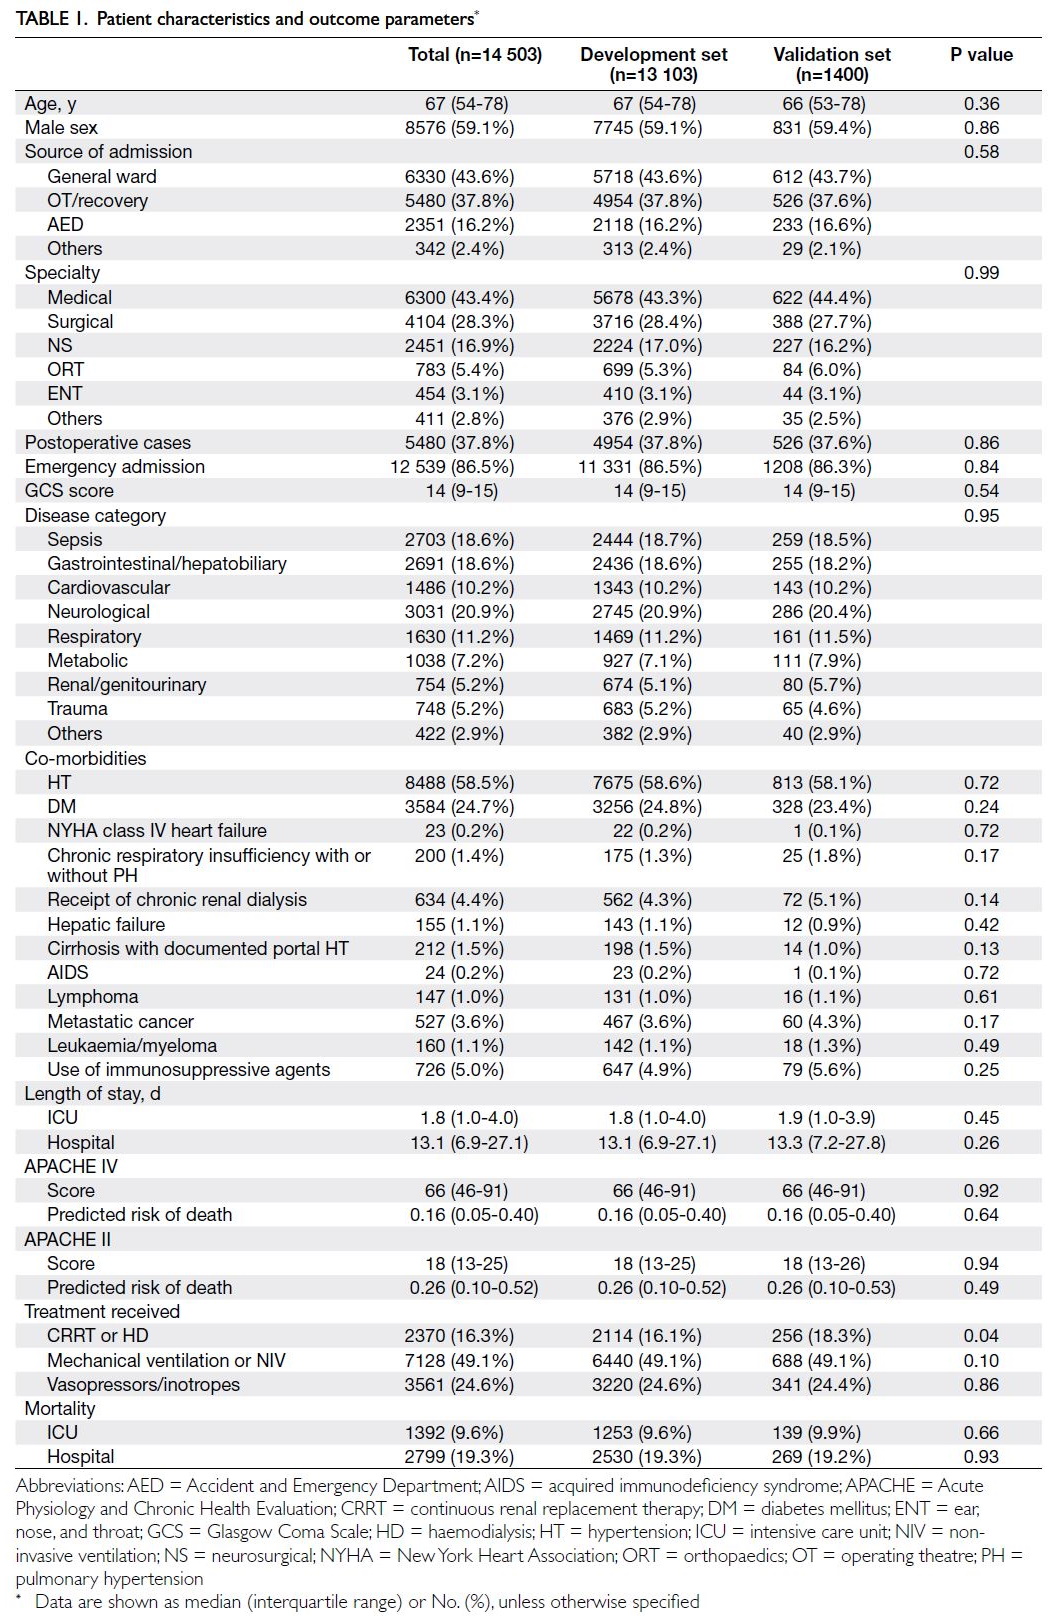
Table 1. Patient characteristics and outcome parameters
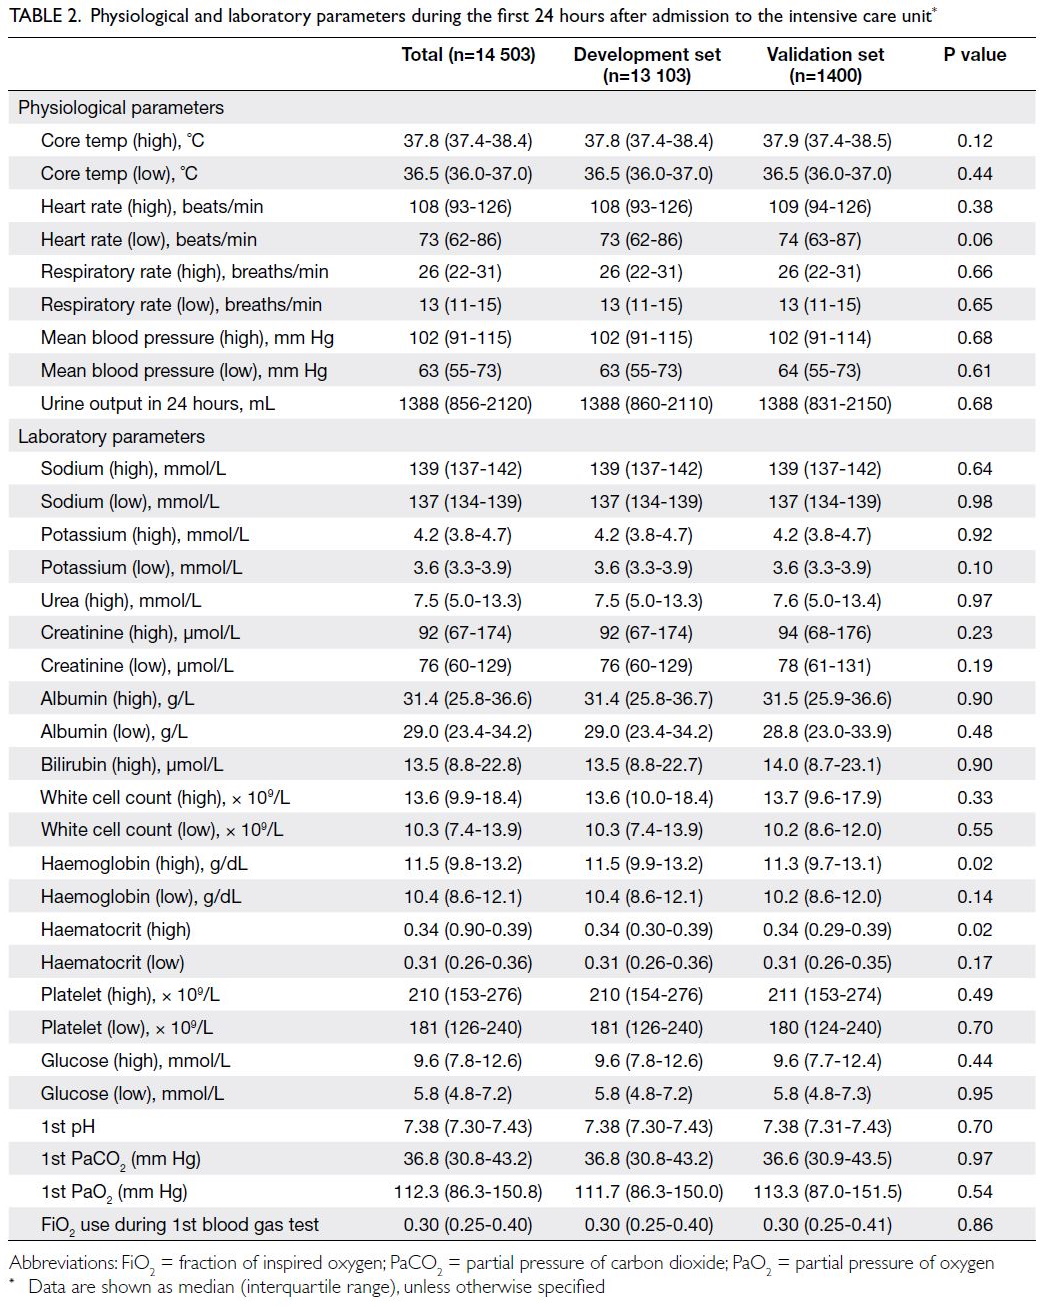
Table 2. Physiological and laboratory parameters during the first 24 hours after admission to the intensive care unit
The baseline co-morbidities, source of
admission, disease category, APACHE II score,
and APACHE IV score were similar in the test
and validation sets (Table 1). More patients in the
validation set received continuous renal replacement
therapy (18.3% vs 16.1%; P=0.04). Concerning the
worst physiological and laboratory parameters
within the first 24 hours (Table 2), there were almost
no significant differences between the development
and validation sets; notably, the haemoglobin
level was lower in the validation set (11.3 g/dL vs
11.5 g/dL; P=0.02).
In the development set, the ANN model
(AUROC=0.89, 95% confidence interval [CI]=0.88-0.92, Brier score=0.10; P in Hosmer–Lemeshow
test=0.34) outperformed the APACHE II model
(AUROC=0.80, 95% CI=0.79-0.81, Brier score=0.15;
P<0.001) and APACHE IV model (AUROC=0.84,
95% CI=0.83-0.85, Brier score=0.12; P<0.001) for
prediction of hospital mortality. The cross-validation accuracy ranged from 0.98 to 1 (mean=0.99),
indicating that our ANN model had good stability.
There was no statistically significant difference
between our ANN model and an ANN model created
by oversampling of minority classes (AUROC=0.89,
95% CI=0.89-0.90; P=0.103).
In the validation set, the ANN model
(AUROC=0.88, 95% CI=0.86-0.90, Brier score=0.10, P in Hosmer–Lemeshow test=0.37) was superior to
the APACHE II model (AUROC=0.85, 95% CI=0.80-0.85, Brier score=0.14; P<0.001 for both comparisons
of AUROCs and Brier scores) but similar to the
APACHE IV model (AUROC=0.87, 95% CI=0.85-0.89, Brier score=0.11; P=0.34 for comparison of
AUROCs, and P=0.05 for comparison of Brier
scores) [Fig 1].
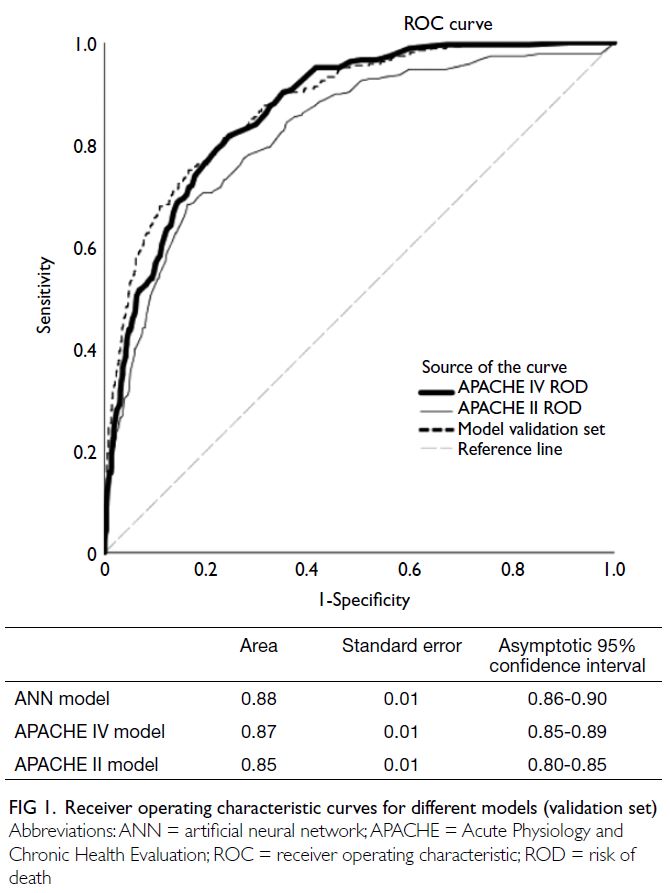
Figure 1. Receiver operating characteristic curves for different models (validation set)
The calibration curve for the validation set
showed that the ANN model (Fig 2a) outperformed
the APACHE IV model (Fig 2b) and the APACHE II
model (Fig 2c).
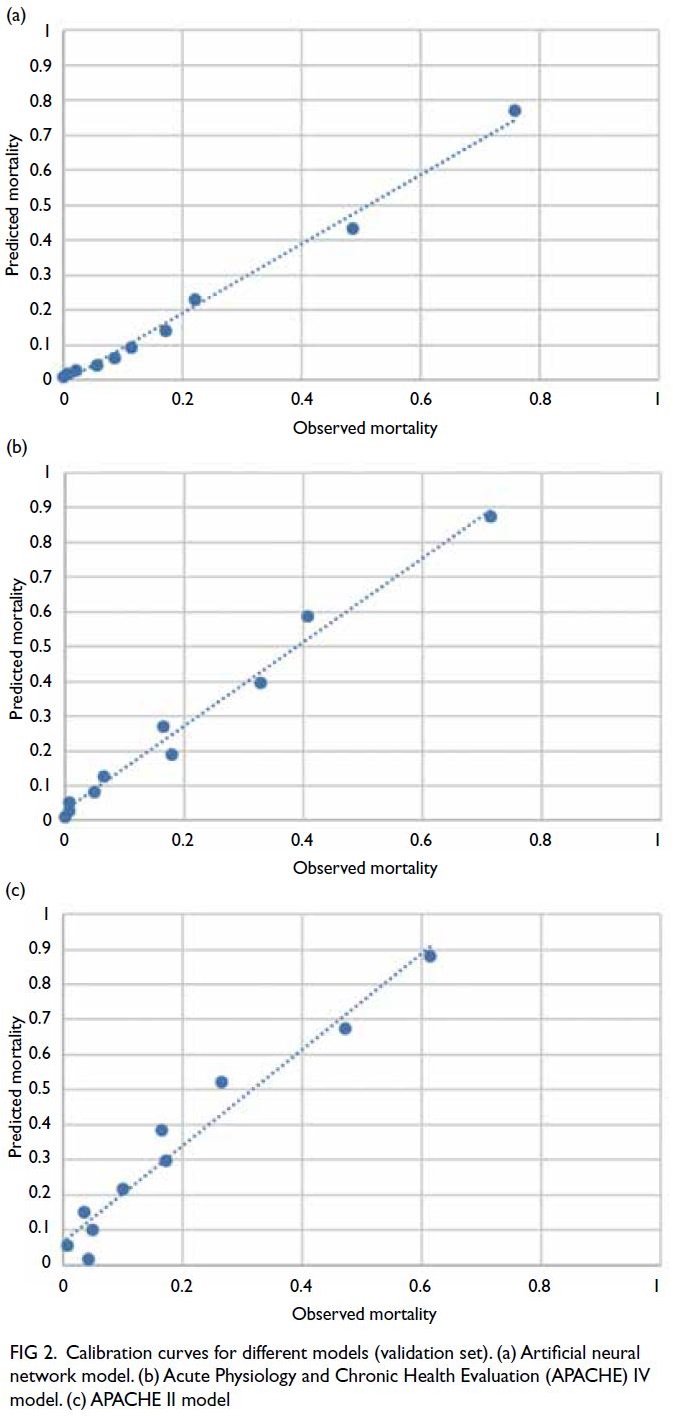
Figure 2. Calibration curves for different models (validation set). (a) Artificial neural network model. (b) Acute Physiology and Chronic Health Evaluation (APACHE) IV model. (c) APACHE II model
The importances of the predictor variables
in predictions of hospital mortality using the
ANN model were evaluated. Within 24 hours of
ICU admission, the highest sodium level was the
most important variable, followed by the highest
bilirubin level and the lowest white cell count.
Details regarding the normalised importance of each
covariate are presented in online supplementary Tables 1 and 2.
Discussion
To our knowledge, this is the first study in Asia to
assess the performance of ANN and compare it
with the performances of two extensively validated
and benchmark scoring systems—APACHE II
and APACHE IV—in terms of predicting hospital
mortality among critically ill patients. We found that
the ANN model provided better discrimination and
calibration compared with the APACHE II model.
However, the difference between the ANN and
APACHE IV models was less prominent. Calibration
was slightly better with the ANN model, but
discrimination was similar between the ANN and
APACHE IV models.
Conventional logistic regression–based
APACHE systems often lose calibration over
time and require regular updates to maintain
performance.6 11 20 21 22 The original APACHE II model
was developed over 30 years ago using data from
13 different hospitals in the US; it was validated in
the country before clinical application.2 Studies in
Hong Kong7 and Singapore23 have shown that the
APACHE II model has good discrimination but poor
calibration for ICU patients in Asia. Calibration
remained suboptimal regardless of customisation
as demonstrated by Lew et al,23 indicating the need
for a new prognostic prediction model. Wong and
Young24 showed that the APACHE II model had
equivalent performance status compared with an
ANN model that had been trained and validated
using the original APACHE II data. In a medicalneurological
ICU in India, an ANN model trained
on an Indian population (with or without redundant
variables) demonstrated better calibration compared
with the APACHE II model.25 The authors speculated
that this finding was partly related to differences in
standards of care and resources between American
and Indian ICUs.25 Overall, differences in case mix,
advances in medical technology, and the use of more
recent data may explain the superiority of our ANN
model compared with the APACHE II model.
Compared with ICU patients in the US, it is
fivefold more common for Hong Kong ICU patients
to begin renal replacement therapy.26 More than
50% of critically ill patients in Hong Kong require
mechanical ventilation, compared with 28% in
the US.26 27 A recent population-based study of
all patients admitted to adult ICUs in Hong Kong
between 2008 and 2018 showed that the APACHE
IV standardised mortality ratio decreased from
0.81 to 0.65 during the study period, implying a
gradual decline in the performance of the APACHE
IV model.26 This model, which was established
using data derived from >100 000 ICU patients
in 45 US hospitals between 2002 and 2003,5 also
tends to overestimate hospital mortality among
ICU patients in Hong Kong. In contrast to our
study population, where Asian ethnicities were most common, 70% of the patients in APACHE IV
reference population were Caucasian.5 The subtle
differences in performance between our ANN
model and the APACHE IV model could be related
to differences in timing during the development of
the models. Nevertheless, our ANN model trained
on a Hong Kong population was better calibrated for
prediction in such a population, compared with the
APACHE IV model. This improved calibration could
be related to differences in target population (Asian
vs Caucasian), epidemiology, and disease profile.
The selection of appropriate variables is a
key aspect of model development. The inclusion of
additional predictor variables does not necessarily
improve a model’s overall performance. Redundant
variables may result in overfitting and produce a
complicated predictive model without additional
benefits. A recently published large national cohort
study from Sweden showed that a simplified ANN
model with eight parameters outperformed the
Simplified Acute Physiology Score III model in
terms of discrimination and calibration.28 Among
the eight parameters, age and leukocyte count were
the most and least important variables, respectively.
Notably, leukocyte count was the most important
variable in terms of predicting mortality among
patients on continuous renal replacement therapy.29
Similar to the present study, Kang et al29 found
that age was the 12th most important variable. The
overall performance of an ANN model trained with
APACHE II parameters in an Indian population
could be maintained with the 15 highest information
gain variables, including serum sodium level and
leukocyte count.25
Among the 53 parameters in our ANN model,
the highest sodium level, highest bilirubin level,
and lowest white cell count within 24 hours of
ICU admission were the top three most important
predictor variables (online supplementary Table 1).
The association between acquired hypernatraemia
and increased hospital mortality among critically
patients has consistently been demonstrated in
multiple studies.30 31 Hyperbilirubinaemia, another
complication in patients with sepsis, was associated
with the onset of acute respiratory distress
syndrome.32 Sepsis and gastrointestinal/hepatobiliary
diseases caused ICU admission in approximately
40% of our patients, possibly explaining the
importance of hyperbilirubinaemia in our ANN
model. Although the importance of leukocyte count
has been demonstrated in other mortality prediction
models, the previous models did not specify whether
the count was high or low.25 28 29 In the present study,
the lowest white cell count was more important than
the highest white cell count. Another intriguing
observation was that age constituted the 11th most
important predictor in our ANN model (online supplementary Table 1). Age is a predictor of survival in many prognostic models.3 5 28 Increasing biological
age is often associated with multiple co-morbidities
and a progressive decline in physiological reserve, leading to increased mortality. However, a recently
published systematic review of 129 studies showed
large variations in ICU and hospital mortality rates
among older ICU patients, ranging from 1% to 51%
in single-centre retrospective studies and 6% to 28%
in multicentre retrospective studies.33 These results
could be related to differences in admission policies,
premorbid functional status, and the intensity of
provided to older critically ill patients.
Our ANN model was trained and internally
validated on a large number of representative data
samples that included most patients admitted to a
tertiary ICU in Hong Kong over the past decade. This
approach addressed the small sample size limitation
that was common in previous studies.24 25 34 All data
were automatically collected by a computer system,
eliminating the risk of human error during data
extraction. Healthcare system digitalisation and
advances in information technology have enabled
effortless generation of abundant clinical data (eg,
physiological parameters, laboratory results, and
radiological findings), which can facilitate data
collection and development of a new risk prediction
model via machine learning.35 36 We hope that
generalisability to other ICUs in Asia can be achieved
through external validation studies.
Limitations
This study had some limitations. Although the sample
size was large, all data were collected from a single
centre; in contrast, data for the APACHE scoring
system were derived from multiple large centres.
Because the primary objective of the present study
was comparison of performance between our ANN
model and the APACHE II and APACHE IV models
using identical parameters, we did not attempt
to determine the optimal subset of parameters
that would maintain high ANN performance.25 28
Furthermore, our ANN model may not be applicable
to other centres with different case mixes and
medical approaches. The lack of external validation
may lead to concerns about overfitting, which is a
common challenge in ANN model development.
Because mortality prediction among ICU patients is
a dynamic process, other limitations include the use
of static data and the lack of a fixed time point for
mortality assessment.
Conclusion
Mortality prediction among critically patients is
a challenging endeavour. Our ANN model, which
was trained with representative data from a Hong
Kong population, outperformed the internationally
validated APACHE II model with respect to critically
ill patients in Hong Kong. In contrast to the APACHE
IV model, our ANN model demonstrated better
calibration but similar discrimination performance. External validation studies using data from other
hospitals are recommended to confirm our findings.
Future studies should explore the feasibility of
reducing the number of variables while preserving
the discrimination and calibration power of the
ANN model. The widespread use of computerised
information systems, rather than paper records, in
ICU and general ward settings has led to increased
data availability. Artificial neural networks, along
with other machine learning techniques, are
valuable tools that can enhance real-time prognostic
prediction.
Author contributions
Concept or design: S Lau, HP Shum, CCY Chan.
Acquisition of data: S Lau, HP Shum, CCY Chan.
Analysis or interpretation of data: S Lau, HP Shum, CCY Chan.
Drafting of the manuscript: S Lau.
Critical revision of the manuscript for important intellectual content: MY Man, KB Tang, KKC Chan, AKH Leung, WW Yan.
Acquisition of data: S Lau, HP Shum, CCY Chan.
Analysis or interpretation of data: S Lau, HP Shum, CCY Chan.
Drafting of the manuscript: S Lau.
Critical revision of the manuscript for important intellectual content: MY Man, KB Tang, KKC Chan, AKH Leung, WW Yan.
All authors had full access to the data, contributed to the study, approved the final version for publication, and take responsibility for its accuracy and integrity.
Conflicts of interest
All authors have disclosed no conflicts of interests.
Declaration
Part of the research was presented at the 34th Annual
Congress of the European Society of Intensive Care Medicine
(3-6 October 2021, virtual) and the Annual Scientific Meeting
2021 of Hong Kong Society of Critical Care Medicine (12
December 2021, virtual).
Funding/support
This research did not receive any specific grant from funding agencies in the public, commercial, or not-for-profit sectors.
Ethics approval
The study protocol complies with the Declaration of Helsinki
and was approved by the Hong Kong East Cluster Research
Ethics Committee of Hospital Authority, Hong Kong (Ref No.:
HKECREC-2021-024). The requirement for patient consent
was waived by the Committee due to the retrospective nature
of the study.
Supplementary material
The supplementary material was provided by the authors and
some information may not have been peer reviewed. Any
opinions or recommendations discussed are solely those of the
author(s) and are not endorsed by the Hong Kong Academy
of Medicine and the Hong Kong Medical Association.
The Hong Kong Academy of Medicine and the Hong Kong
Medical Association disclaim all liability and responsibility
arising from any reliance placed on the content.
References
1. Keegan MT, Gajic O, Afessa B. Severity of illness scoring
systems in the intensive care unit. Crit Care Med
2011;39:163-9. Crossref
2. Breslow MJ, Badawi O. Severity scoring in the critically ill:
part 1—interpretation and accuracy of outcome prediction
scoring systems. Chest 2012;141:245-52. Crossref
3. Knaus WA, Draper EA, Wagner DP, Zimmerman JE.
APACHE II: a severity of disease classification system. Crit
Care Med 1985;13:818-29. Crossref
4. APACHE III study design: analytic plan for evaluation
of severity and outcome [editorial]. Crit Care Med
1989;17:S169-221.
5. Zimmerman JE, Kramer AA, McNair DS, Malila FM,
Shaffer VL. Intensive care unit length of stay: benchmarking
based on Acute Physiology and Chronic Health Evaluation
(APACHE) IV. Crit Care Med 2006;34:2517-29. Crossref
6. Zimmerman JE, Kramer AA. Outcome prediction in
critical care: the Acute Physiology and Chronic Health
Evaluation models. Curr Opin Crit Care 2008;14:491-7. Crossref
7. Tan IK. APACHE II and SAPS II are poorly calibrated in
a Hong Kong intensive care unit. Ann Acad Med Singap
1998;27:318-22.
8. Gupta R, Arora VK. Performance evaluation of APACHE
II score for an Indian patient with respiratory problems.
Indian J Med Res 2004;119:273-82.
9. Choi JW, Park YS, Lee YS, et al. The ability of the Acute
Physiology and Chronic Health Evaluation (APACHE)
IV score to predict mortality in a single tertiary hospital.
Korean J Crit Care Med 2017;32:275-83. Crossref
10. Ghorbani M, Ghaem H, Rezaianzadeh A, Shayan Z,
Zand F, Nikandish R. A study on the efficacy of APACHEIV
for predicting mortality and length of stay in an intensive
care unit in Iran. F1000Res 2017;6:2032. Crossref
11. Ko M, Shim M, Lee SM, Kim Y, Yoon S. Performance
of APACHE IV in medical intensive care unit patients:
comparisons with APACHE II, SAPS 3, and MPM0 III.
Acute Crit Care 2018;33:216-21. Crossref
12. Xie J, Su B, Li C, et al. A review of modeling methods for
predicting in-hospital mortality of patients in intensive
care unit. J Emerg Crit Care Med 2017;1:18. Crossref
13. Tu JV. Advantages and disadvantages of using artificial
neural networks versus logistic regression for predicting
medical outcomes. J Clin Epidemiol 1996;49:1225-31. Crossref
14. Sargent DJ. Comparison of artificial neural networks with
other statistical approaches: results from medical data sets.
Cancer 2001;91(8 Suppl):1636-42. Crossref
15. Meiring C, Dixit A, Harris S, et al. Optimal intensive care
outcome prediction over time using machine learning.
PLoS One 2018;13:e0206862. Crossref
16. Rajkomar A, Oren E, Chen K, et al. Scalable and accurate
deep learning with electronic health records. NPJ Digit
Med 2018;1:18. Crossref
17. Norgaard M, Ravn O, Poulsen NK, Hansen LK. Neural Networks for Modelling and Control of Dynamic Systems:
A Practitioner’s Handbook. London: Springer; 2000.
18. Ludermir TB, Yamazaki A, Zanchettin C. An optimization
methodology for neural network weights and architectures.
IEEE Trans Neural Netw 2006;17:1452-9. Crossref
19. Steyerberg EW, Vickers AJ, Cook NR, et al. Assessing
the performance of prediction models: a framework for
traditional and novel measures. Epidemiology 2010;21:128-38. Crossref
20. Lam KW, Lai KY. Evaluation of outcome and performance of an intensive care unit in Hong Kong by APACHE IV model: 2007-2014. J Emerg Crit Care Med 2017;1:16. Crossref
21. Paul E, Bailey M, Van Lint A, Pilcher V. Performance of
APACHE III over time in Australia and New Zealand:
a retrospective cohort study. Anaesth Intensive Care
2012;40:980-94. Crossref
22. Mann SL, Marshall MR, Holt A, Woodford B, Williams AB.
Illness severity scoring for intensive care at Middlemore
Hospital, New Zealand: past and future. N Z Med J
2010;123:47-65.
23. Lew CC, Wong GJ, Tan CK, Miller M. Performance of
the Acute Physiology and Chronic Health Evaluation
II (APACHE II) in the prediction of hospital mortality
in a mixed ICU in Singapore. Proc Singapore Healthc
2019;28:147-52. Crossref
24. Wong LS, Young JD. A comparison of ICU mortality
prediction using the APACHE II scoring system and
artificial neural networks. Anaesthesia 1999;54:1048-54. Crossref
25. Nimgaonkar A, Karnad DR, Sudarshan S, Ohno-Machado L,
Kohane I. Prediction of mortality in an Indian intensive
care unit. Comparison between APACHE II and artificial
neural networks. Intensive Care Med 2004;30:248-53. Crossref
26. Ling L, Ho CM, Ng PY, et al. Characteristics and outcomes
of patients admitted to adult intensive care units in Hong
Kong: a population retrospective cohort study from 2008
to 2018. J Intensive Care 2021;9:2. Crossref
27. Wunsch H, Angus DC, Harrison DA, Linde-Zwirble WT,
Rowan KM. Comparison of medical admissions to intensive
care units in the United States and United Kingdom. Am J
Respir Crit Care Med 2011;183:1666-73. Crossref
28. Holmgren G, Andersson P, Jakobsson A, Frigyesi A.
Artificial neural networks improve and simplify intensive
care mortality prognostication: a national cohort study
of 217,289 first-time intensive care unit admissions. J
Intensive Care 2019;7:44. Crossref
29. Kang MW, Kim J, Kim DK, et al. Machine learning algorithm
to predict mortality in patients undergoing continuous
renal replacement therapy. Crit Care 2020;24:42. Crossref
30. O’Donoghue SD, Dulhunty JM, Bandeshe HK, Senthuran S,
Gowardman JR. Acquired hypernatraemia is an
independent predictor of mortality in critically ill patients.
Anaesthesia 2009;64:514-20. Crossref
31. Olsen MH, Møller M, Romano S, et al. Association between
ICU-acquired hypernatremia and in-hospital mortality:
data from the medical information mart for intensive care
III and the electronic ICU collaborative research database.
Crit Care Explor 2020;2:e0304. Crossref
32. Zhai R, Sheu CC, Su L, et al. Serum bilirubin levels on ICU
admission are associated with ARDS development and
mortality in sepsis. Thorax 2009;64:784-90. Crossref
33. Vallet H, Schwarz GL, Flaatten H, de Lange DW, Guidet B,
Dechartres A. Mortality of older patients admitted to an
ICU: a systematic review. Crit Care Med 2021;49:324-34. Crossref
34. Clermont G, Angus DC, DiRusso SM, Griffin M, Linde-Zwirble WT. Predicting hospital mortality for patients in
the intensive care unit: a comparison of artificial neural
networks with logistic regression models. Crit Care Med
2001;29:291-6. Crossref
35. Kim S, Kim W, Park RW. A comparison of intensive care
unit mortality prediction models through the use of data
mining techniques. Healthc Inform Res 2011;17:232-43. Crossref
36. Bulgarelli L, Deliberato RO, Johnson AE. Prediction on
critically ill patients: the role of “big data”. J Crit Care
2020;60:64-8. Crossref