Hong Kong Med J 2014;20:178–86 | Number 3, June 2014 | Epub 22 Nov 2013
DOI: 10.12809/hkmj133986
© Hong Kong Academy of Medicine. CC BY-NC-ND 4.0
ORIGINAL ARTICLE
Effectiveness and cost-effectiveness of
erlotinib versus gefitinib in first-line treatment of epidermal
growth factor receptor–activating mutation-positive non–small-cell
lung cancer patients in Hong Kong
Vivian WY Lee, PharmD, BCPS1;
Bjoern Schwander, BSc, RN2 #; Victor HF Lee,
FHKCR, FHKAM (Radiology)3
1 School of Pharmacy, The
Chinese University of Hong Kong, Shatin, Hong Kong
2 AHEAD — Agency for Health
Economic Assessment and Dissemination GmbH, Lörrach, Germany
3 Department of Clinical
Oncology, Queen Mary Hospital, The University of Hong Kong,
Pokfulam, Hong Kong
Corresponding author: Dr B Schwander (bjoern.schwander@ahead-net.de)
# Before July 2012: AiM Research and Consulting GmbH, Lörrach, Germany
# Before July 2012: AiM Research and Consulting GmbH, Lörrach, Germany

Abstract
ObjectiveTo compare
the effectiveness and cost-effectiveness of erlotinib versus
gefitinib as first-line treatment of epidermal growth factor
receptor— activating mutation-positive non—small-cell lung
cancer patients.
Design Indirect
treatment comparison and a cost-effectiveness assessment.
Setting Hong Kong.
Patients Those having
epidermal growth factor receptor–activating mutation-positive
non–small-cell lung cancer.
Interventions Erlotinib
versus gefitinib use was compared on the basis of four relevant
Asian phase-III randomised controlled trials: one for erlotinib
(OPTIMAL) and three for gefitinib (IPASS; NEJGSG; WJTOG). The
cost-effectiveness assessment model simulates the transition
between the health states: progression-free survival,
progression, and death over a lifetime horizon. The World Health
Organization criterion (incremental cost-effectiveness ratio
<3 times of gross domestic product/capita: <US$102 582;
approximately <HK$798 078) was used to rate
cost-effectiveness.
Results The best fit of
study characteristics and prognostic patient characteristics
were found between the OPTIMAL and IPASS trials. Comparing
progression-free survival hazard ratios of erlotinib versus
gefitinib using only these randomised controlled trials in an
indirect treatment comparison resulted in a statistically
significant progression-free survival difference in favour of
erlotinib (indirect treatment comparison hazard ratio=0.33; 95%
confidence interval, 0.19-0.58; P=0.0001). The
cost-effectiveness assessment model showed that the cost per
progression-free life year gained and per quality-adjusted life
year gained was at acceptable values of US$39 431 (approximately
HK$306 773) and US$62 419 (approximately HK$485 619) for
erlotinib versus gefitinib, respectively.
Conclusion The indirect
treatment comparison of OPTIMAL versus IPASS shows that
erlotinib is significantly more efficacious than gefitinib.
Furthermore, the cost-effectiveness assessment indicates that
the incremental cost-effectiveness ratios are well within an
acceptable range in relation to the survival benefits obtained.
In conclusion, erlotinib is cost-effective compared to gefitinib
for first-line epidermal growth factor receptor–activating
mutation-positive non–small-cell lung cancer patients.
New knowledge added by this
study
- The current project provided cost-effectiveness information for erlotinib and gefitinib based on four Asian phase-III clinical trials in non–small-cell lung cancer (NSCLC) patients using a threshold recommended by the World Health Organization.
- The cost-effectiveness analysis indicates that erlotinib is cost-effective compared to gefitinib in first-line epidermal growth factor receptor (EGFR)–activating mutation-positive (MuT+) NSCLC patients in Hong Kong.
- Erlotinib is efficacious and cost-effective, and hence should be considered a good option for treatment of EGFR MuT+ NSCLC patients.
- Being cost-effective, erlotinib should be considered for reimbursement by health care payers in Hong Kong.
Introduction
Lung cancer is the leading cause of cancer
deaths worldwide (1.38 million cancer deaths, 18.2% of the total)
as well as of cancer morbidity (1.61 million new cases, 12.7% of
all new cancers).1
Approximately 80 to 85% of lung cancer patients have
non–small-cell lung cancer (NSCLC), and around 70% of these NSCLC
patients present with advanced or metastatic disease (TNM stages
IIIB/IV according to the American Joint Committee on Cancer2) at the time of diagnosis.3 4 5 6
Patients with late-stage NSCLC have a very poor prognosis; only
about 7% with stage IIIB and 2% of those with stage IV survive
beyond 5 years.7
Evidently, NSCLC is a biological and
genetic variant of lung cancer, which bears activating mutations
in the tyrosine kinase domain of the epidermal growth factor
receptor (EGFR). In Asian NSCLC patients, the frequency of
activating EGFR mutations (EGFR MuT+) is estimated to be
approximately 30 to 40%.6 8 Notably, EGFR mutations
lead to structural changes, which stabilise the active form of the
tyrosine kinase domain and result in a high affinity for binding
EGFR tyrosine kinase inhibitors (TKIs).9
There are currently two small-molecule EGFR
TKIs used in clinical practice and recommended as first-line
treatment in patients with EGFR MuT+ NSCLC: erlotinib (Tarceva; F.
Hoffmann-La Roche Ltd, Basel, Switzerland) and gefitinib (Iressa;
AstraZeneca Ltd, London, UK).6
8
Recently published analyses concluded that
these EGFR TKIs appear to be the most effective therapy in
treatment-naïve cancer patients with this mutation.10 11
As a result, both therapies are competing to be the primary choice
in this clinical setting.
This poses the question as to whether there
are differences in efficacy and cost-effectiveness between
erlotinib and gefitinib. To answer this question and to offer
guidance for physicians and health care payers, we undertook
comparative effectiveness and cost-effectiveness assessments
(CEAs) for the health care setting of Hong Kong.
Underlying data
In order to base the research on the
strongest available evidence, standard literature databases
(PubMed, ASCO and ESMO congress databases) were screened for Asian
randomised controlled phase-III trials that investigated the
efficacy of erlotinib and gefitinib as first-line EGFR MuT+ NSCLC
therapy. We included all Asian randomised controlled phase-III
trials that investigated either gefitinib or erlotinib as
first-line therapy of NSCLC, that have systematically assessed the
EGFR mutation status of the included patients, and that have
published sufficient information on the EGFR-mutation patient
population characteristics and outcomes. By applying these
criteria, four suitable Asian phase-III randomised controlled
trials (RCT) were identified, one for erlotinib and three for
gefitinib.
The OPTIMAL trial evaluated the efficacy
and tolerability of erlotinib versus chemotherapy,12 13
and the Iressa Pan-ASia Study (IPASS),14
the North-East Japan Gefitinib Study Group trial (NEJGSG),15 and the West Japan Thoracic Oncology Group
3405 trial (WJTOG)16
evaluated the efficacy and safety of gefitinib vs chemotherapy.
The following section provides the background information on these
clinical trials, which is necessary as a basis for the planned
comparative assessments.
Study characteristics, study measurements, and
patient characteristics
As shown in Table 1, the main study characteristics,
study measurements, and patient characteristics of the Asian EGFR
TKI phase-III RCT for first-line treatment of EGFR MuT+ NSCLC are
largely comparable but not identical.
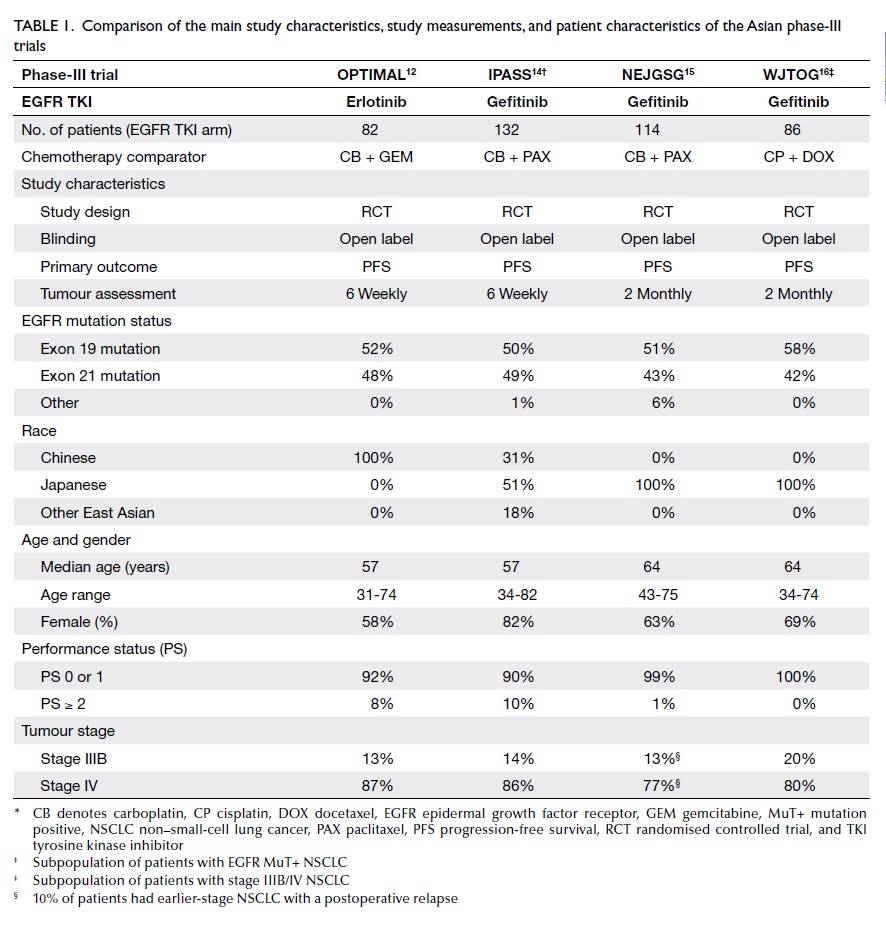
Table 1. Comparison of the main study characteristics, study measurements, and patient characteristics of the Asian phase-III trials
The best fit is encountered with the
OPTIMAL and IPASS trials, as the tumour assessment periodicity (6
weekly for both OPTIMAL and IPASS), median age (57 years for both
trials), performance status proportion (performance status 0 or 1:
OPTIMAL 92%, IPASS 90%), and the tumour stage distribution (stage
IV: OPTIMAL 87%, IPASS 86%) were comparable. In contrast, on
comparing OPTIMAL versus the NEJGSG and WJTOG trials, differences
were evident with respect to all of the above-named factors (Table
1). Such differences are important, as at least age, performance
status, and tumour stage were predictors of progression-free
survival (PFS) in NSCLC.7 17 18 19
Efficacy outcomes
All these phase-III RCT in first-line EGFR
MuT+ NSCLCs have shown significant increases in the primary
endpoint, namely PFS for erlotinib (OPTIMAL trial12) and gefitinib (IPASS14, NEJGSG15,
WJTOG16) in comparison to
standard chemotherapy. The erlotinib OPTIMAL trial reached a
median PFS of 13.7 months and a corresponding hazard ratio (HR) of
0.16 with 95% confidence intervals (CI) of 0.11-0.26
(P<0.0001).13 The
gefitinib IPASS, NEJGSG, and WJTOG trials reached a respective
median PFS of 9.5, 10.8, and 8.4 months with corresponding HRs of
0.48 (95% CI, 0.36-0.64; P<0.001), 0.30 (95% CI, 0.22-0.41;
P<0.001), and 0.33 (95% CI, 0.20-0.54; P<0.0001).14 15 16
Tolerability outcomes
According to all four phase-III RCT, the
EGFR TKIs showed a better tolerability profile than the
chemotherapy comparators, and hence they appeared to confer less
toxicity while achieving greater efficacy.1 12 14 15 16
The most common serious adverse event (SAE)
reported for erlotinib is elevation of alanine aminotransferase
level (3.6%), which nevertheless compares favourably with
gefitinib (27.6%).12 16 Other SAEs with the highest frequency for
erlotinib also compare favourably with gefitinib, namely rash
(2.4% vs 5.3%) and diarrhoea (1.2% vs 3.8%).12 14 15 Infection is the only
SAE that has been reported for erlotinib (1.2%) but not in
gefitinib trials.12 All
other SAEs reported for gefitinib (aspartate aminotransferase
elevation, neutropenia, fatigue, anaemia, anorexia, leukopenia,
nausea, paronychia, and sensory disturbance) have not been
reported for erlotinib. Irrespective of the small deviations
observed when comparing the frequency of single adverse effects
between erlotinib and gefitinib, the toxicity of these two TKIs
can be regarded as comparable.12
Methods
Comparative effectiveness assessment
As both EGFR TKIs have shown favourable
outcomes compared to chemotherapy, both are currently competing to
be the primary choice in treatment-naïve EGFR MuT+ NSCLC patients.
Thus, in the absence of a direct head-to-head comparison, there is
a need for an indirect comparative effectiveness assessment.
This assessment used the accepted and most
widely applied indirect comparison methods introduced by Bucher et
al in 1997.20 The Canadian
Agency for Drugs and Technologies in Health21 and others22
23 have identified this
method as the most suitable approach for performing indirect
comparisons of RCT outcomes.
According to the Bucher method,20 the chemotherapy comparator arm (C) of each
trial has been used as a ‘bridge’ to connect and compare the
efficacy of the investigational treatment arms, namely erlotinib
(A) and gefitinib (B). The PFS HRs were selected as the basis for
this indirect treatment comparison (ITC), as this efficacy
measurement accounts for censoring and incorporates time-to-event
information.24 As an
outcome of the comparative effectiveness assessment, the ITC HRs
of erlotinib versus gefitinib are provided with 95% CIs. The
applied ITC approach uses an effect size (PFS HR) that is
expressed relative to the comparator (A vs C and B vs C; hence the
comparator is used as a ‘bridge’) to perform a so-called ‘adjusted
ITC’ of the investigational treatment arms (A vs B). The related
formula for the ITC HR is HRAB = HRAC /HRBC
and the formula for the ITC 95% CI is HRAB ± 1.96 x
SQRT(VAR[HRAB]).
In order to test for statistical
significance, P values were calculated by means of a two-sided Z
test, using the methodology of Snedecor and Cochran 1989.25 The null hypothesis that the PFS of the
compared therapy options is equal was to be rejected if P<0.05.
All calculations were performed using Excel 2003. The ITC
calculations could be re-performed using the ITC tool26 provided by the Canadian Agency for Drugs and
Technologies in Health, thus ensuring maximum transparency.
Due to the good fit in prognostic patient
characteristics, the key ITC was based on the OPTIMAL versus IPASS
phase-III PFS HR outcomes. Furthermore, OPTIMAL was compared with
the pooled Asian gefitinib evidence. This pooled evidence was
obtained by applying a random effect pooling (PFS HR of gefitinib
vs chemotherapy = 0.37; 95% CI, 0.27-0.51; P<0.0001) and a
fixed effect pooling (PFS HR of gefitinib vs chemotherapy = 0.38;
95% CI, 0.31-0.46; P<0.0001) to the PFS HR outcomes of the
IPASS, NEJGSG, and WJTOG trials.
Cost-effectiveness assessment
Phase-III RCT evidence was used as the
basis for the CEA. Evidence from OPTIMAL was used for erlotinib
and evidence from IPASS for gefitinib, as these studies were the
most comparable with respect to prognostic characteristics of the
patients (Table 1).
The CEA model uses a Markov approach that
simulates the transition between the health states: PFS,
progression, and death, in monthly cycles and over a life-time
horizon. Patients with stage IIIB/IV EGFR MuT+ NSCLC enter the
model in PFS. Transition from PFS to progression is simulated by
the published phase-III Kaplan-Meier estimates (erlotinib: OPTIMAL13; gefitinib: IPASS14). For the transition from progression to
death, the same transition probability was applied for both EGFR
TKIs using the final overall survival results from IPASS.27 This procedure was necessary, as OPTIMAL
survival data are currently immature and follow-up is ongoing.12 13
To estimate the Hong Kong–specific drug
costs, the licensed dosage (same as in the phase-III RCT) was
applied; hence a daily dose of 150 mg for erlotinib and a daily
dose of 250 mg for gefitinib were simulated. The drug costs per
daily dose of US$74.94 for erlotinib and US$59.98 for gefitinib
were based on gross ex-factory prices from October 2011. In order
to transfer the local currency (HK$) to US$, the average exchange
rates (October 2010 to October 2011) from the Reserve Bank of
Australia were used (1 US$ = 7.78 HK$). These drug costs have been
simulated until disease progression or death (therapy until
progression).
In order to simulate quality-adjusted life
years (QALYs), published health utility values according to Nafees
et al28 were applied to
the health states PFS (0.653) and progression (0.473). A health
utility of zero (0) was applied to the health state death. The CEA
outcomes were expressed as cost per life year gained, cost per
progression-free life year (PF-LY) gained, and as cost per QALY
gained for erlotinib and gefitinib. The simulation results were
based on a Monte-Carlo simulation using 1000 iterations; all
simulations were performed in Excel 2003. Costs and effects have
been discounted by 3% per annum according to regional
pharmacoeconomic recommendations.29
Sensitivity analyses of the treatment effect on the
cost-effectiveness results were performed by applying the extreme
bounds (lower and upper 95% CIs) of the PFS Kaplan-Meier estimates
for erlotinib and gefitinib.
The World Health Organization (WHO)
criterion (incremental cost-effectiveness ratio [ICER] <3 times
of the Hong Kong GDP/capita,30
which gave a figure of <US$102 582 or approximately <HK$798
078) was used for this purpose.31
Results
Comparative effectiveness assessment
Comparing the PFS HRs of erlotinib versus
gefitinib in first-line EGFR MuT+ NSCLC based on OPTIMAL and IPASS
resulted in a statistically significant PFS difference in favour
of erlotinib (ITC HR=0.33; 95% CI, 0.19-0.58; P=0.0001). As shown
in Figure 1, comparing erlotinib versus the
pooled gefitinib phase-III evidence confirmed these findings.

Figure 1. Comparative effectiveness assessment results of erlotinib versus gefitinib
Cost-effectiveness assessment
According to the CEA model outcomes,
erlotinib was more effective in terms of life years gained, in
terms of PF-LY gained, and in terms of QALYs gained when compared
with gefitinib in first-line EGFR MuT+ NSCLC therapy (Table
2).
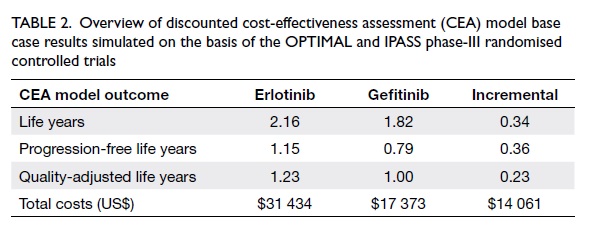
Table 2. Overview of discounted cost-effectiveness assessment (CEA) model base case results simulated on the basis of the OPTIMAL and IPASS phase-III randomised controlled trials
The therapy costs of erlotinib were higher
than those of gefitinib, as shown in Table 2. Besides higher daily
therapy costs, the superior efficacy of erlotinib was the reason
for this cost difference. The longer time in PFS compared with
gefitinib increased its total therapy duration (therapy until the
disease progressed or death), which translated into higher total
costs.
To determine whether the additional total
therapy costs of erlotinib therapy were reasonable in relation to
the efficacy benefit obtained, an incremental cost-effectiveness
analysis was performed. The cost per life year gained by erlotinib
was US$41 494 (incremental US$ costs 14 061/ incremental life
years 0.34), the cost per PF-LY gained by erlotinib was US$39 431
(incremental costs US$14 061/incremental PF-LY 0.36), and the cost
per QALY gained by erlotinib was US$62 419 (incremental costs
US$14 061/incremental QALY was 0.23) [Fig 2].
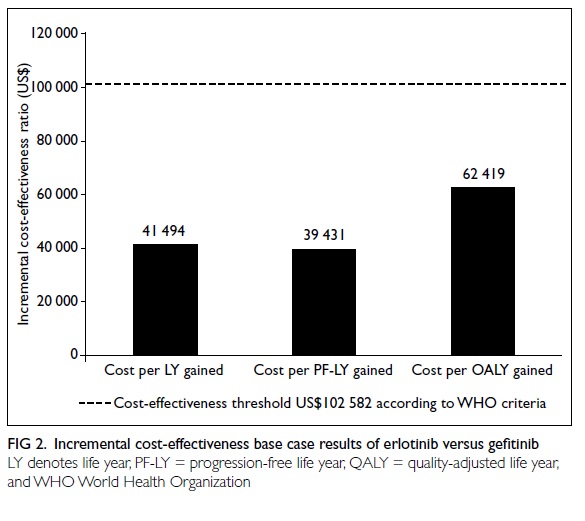
Figure 2. Incremental cost-effectiveness base case results of erlotinib versus gefitinib
These ICERs were well within a range
usually regarded as cost-effective using WHO cost-effectiveness
criteria. According to these, a therapy is ‘highly cost-effective’
if the ICERs are less than the gross domestic product (GDP) per
capita (<US$34 194), ‘cost-effective’ if the ICERs are between
1 (US$34 194) and 3 times (US$102 582) the GDP per capita, and
‘not cost-effective’ if more than 3 times the GDP per capita
(>US$102 582).
As shown in Table 3, sensitivity analyses on the
treatment effect confirmed the robustness of the
cost-effectiveness outcomes as almost all ICERs remained below the
WHO cost-effectiveness threshold (<US$102 582).
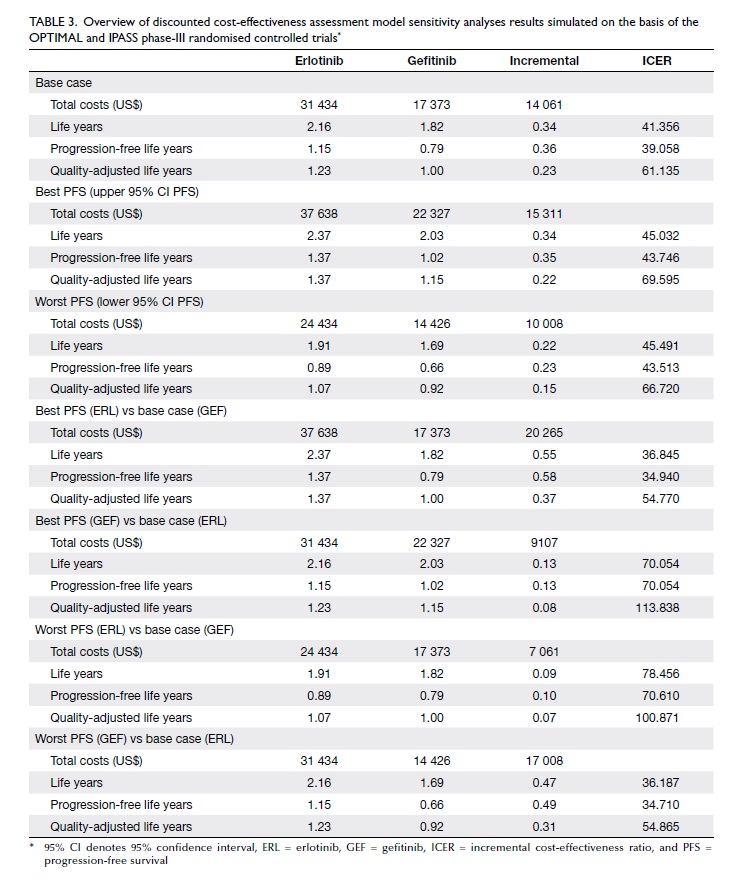
Table 3. Overview of discounted cost-effectiveness assessment model sensitivity analyses results simulated on the basis of the OPTIMAL and IPASS phase-III randomised controlled trials*
Discussion
To offer guidance for physicians and health
care payers, comparative effectiveness and CEAs were performed to
compare erlotinib versus gefitinib in the treatment of
treatment-naïve patients with EGFR MuT+ NSCLC in the health care
setting of Hong Kong. Both the comparative assessments used
state-of-the-art methods; however, specific limitations had to be
taken into account.
The main limitation related to these
comparative effectiveness assessments was that our findings were
based on indirect evidence. Such ITCs have to be regarded as
complementary to clinical trials, because they cannot substitute
direct evidence. However, in the absence of any head-to-head
comparison, the ITC approach can be regarded as the most valuable
way of estimating comparative treatment effects in a statistically
accurate manner.
Another limitation was the difference in
prognostic patient characteristics between the phase-III trials
used. Whereas OPTIMAL and IPASS showed a relatively good fit, the
OPTIMAL versus NEJGSG or WJTOG comparisons showed a mismatch of
prognostic factors. For this reason, the comparative effectiveness
assessment used only the OPTIMAL and the IPASS trials as a basis
for the key comparison. Focusing on this key comparison was a
necessary precondition for the validity of the ITC, as it ensured
that the results were primarily influenced by the treatment effect
and not the ‘base risk profiles’. To avoid this confounding
factor, the NEJGSG and the WJTOG trials were only considered in a
pooled gefitinib PFS HR analysis, which confirmed the findings of
the key comparison (OPTIMAL vs IPASS).
Another Asian study, namely the
First-Signal study,32 was
excluded from our assessment because relevant details on the EGFR
MuT+ subpopulation were not published. Besides, the EGFR MuT+
status in this study was assessed only in a limited number of
patients and the trial failed to meet its primary endpoint.
However, an inclusion of First-Signal study would have worsened
the pooled gefitinib results presented in our assessment, as the
PFS HR obtained for the EGFR MuT+ population in First-Signal study
was the highest obtained within each gefitinib study (PFS HR=0.54;
95% CI, 0.27-1.10) and did not reach statistical significance
compared to chemotherapy.
For erlotinib, there was another phase-III
RCT available named EURTAC that was performed in a European
patient population, and resulted in a PFS HR of 0.37 (95% CI,
0.25-0.54),33 which was
not included in our assessment. Compared to patients in the Asian
phase-III gefitinib trials,14
15 16 patients in the EURTAC trial33 had the highest median age, the highest
proportion with a worse performance status, and the highest
proportion with stage IV disease, apart from using a Caucasian
patient population which in itself was an important prognostic
factor.34 35 36
Thus, according to these prognostic patient characteristics, the
only phase-III trial performed in Caucasian patients (EURTAC) was
not comparable to any other phase-III trial and hence warranted
assessment separately from the Asian evidence. Notably, this was
our rationale for basing our assessment for the Hong Kong health
care setting on the available Asian evidence only.
The median PFS values of the chemotherapy
comparator arms of the selected Asian phase-III trials were 4.6
months in OPTIMAL,12 13 5.4 months in NEJGSG,15 and 6.3 months in the IPASS14 and WJTOG.16
These differences in the median PFS times of chemotherapy have
raised doubts about the PFS HRs of the OPTIMAL trial, since it
seemed that erlotinib treatment was compared to a comparator arm
with the worst performance. This is a frequently applied
misinterpretation of the data, as the median PFS values reflect
only one point in time in the PFS Kaplan-Meier curve. In order to
determine whether one chemotherapy arm shows a better performance
than the other (eg comparison between the OPTIMAL chemotherapy arm
and the IPASS chemotherapy arm), a comparison of both chemotherapy
PFS curves over time on the basis of patient level data from both
clinical studies is required. Our comparison approach was based on
the HRs (the standard measure for determining the efficacy of
oncology drugs), which reflects the area between the PFS
Kaplan-Meier curves of the EGFR TKIs versus the chemotherapy
comparators, taking into account the whole study period, hence it
is not influenced by the different median PFS values.
A possible reason for the PFS difference
observed between the two EGFR TKIs might be related to the
differences in the chemical structure of erlotinib and gefitinib.
These structural differences influence the metabolism of the two
drugs by the human liver enzymes. Erlotinib is less susceptible to
the metabolizing enzymes than gefitinib and therefore, at an
approved dose of 150 mg once daily, it achieves approximately a
3.5-fold higher steady-state plasma concentration than gefitinib
administered at the recommended dose of 250 mg once daily.37 This higher circulating level of erlotinib
might provide a clinical advantage over gefitinib38 and explain the better efficacy of erlotinib39 compared with gefitinib
in the treatment-naïve Asian EGFR MuT+ NSCLC patients.
One limitation of the CEA performed was
that total therapy costs were only estimated on the basis of drug
costs. In order to perform an adequate total cost assessment,
further cost components such as prescription costs, adverse effect
costs, and EGFR mutation testing costs usually have to be taken
into account. However, as the cost-effectiveness analysis was
based on an incremental assessment of erlotinib versus gefitinib,
the correctness of results depended on assessing all relevant
differences in costs. These differences were considered adequately
reflected by differences in drug costs and differences in the
therapy duration (difference in PFS) simulated. The rationale for
this was that both therapies have comparable prescription and EGFR
testing costs, which make no difference when calculating the
incremental costs between the two therapies. Only the costs of
adverse effects might influence the incremental costs. However,
these costs are hard to assess. Although erlotinib shows less SAEs
than gefitinib, the difference in the related costs in favour of
erlotinib was estimated to be minor.
Another limitation of the
cost-effectiveness analysis was the assumption that both TKI
therapies present a similar survival probability after disease
progression. The survival probability after disease progression
was simulated on the basis of the IPASS overall survival outcomes.
This assumption was necessary, as the overall survival results
from OPTIMAL are still immature. As a result of this assumption,
the PFS benefit of erlotinib was transferred to the overall
survival outcome. How strongly this assumption impacts the results
is currently difficult to determine. Future CEAs using the final
OPTIMAL overall survival data (currently immature) are necessary
to eliminate this uncertainty
Furthermore, the cost-effectiveness results
are not transferable to other health care settings, as they are
dependent on country-specific drug prices. Hence, the results
presented have to be regarded as specific to the health care
setting of Hong Kong and any possible similar findings in other
countries and health care settings need to be confirmed in
separate analyses.
To the authors’ knowledge, this is the
first ITC and CEA performed for treatment-naïve EGFR MuT+ NSCLC in
Asian patients. Hence, currently there are no other publications
confirming or conflicting with these findings.
Conclusion
The CEA for Hong Kong showed that the cost
per life year gained, the cost per PF-LY gained, and the cost per
QALY gained by erlotinib were well within an acceptable range in
relation to the survival benefit obtained. In conclusion,
erlotinib was cost-effective compared to gefitinib as first-line
EGFR MuT+ NSCLC in Hong Kong.
Declaration
This work was funded by Roche Hong Kong
Limited (Roche). Roche was involved in gathering the
country-specific input data, and in reviewing and commenting the
manuscript. All the authors made the decision to submit the
manuscript for publication and guarantee the accuracy and
completeness of the data. Prof Vivian WY Lee has received
educational grant, research contracts, and donations from
pharmaceutical companies including AstraZeneca, Boehringer
Ingelheim, Eisai, Janssen, Pfizer, Novartis, and Roche.
References
1. Ferlay J, Shin HR, Bray F,
Forman D, Mathers C, Parkin DM. Estimates of worldwide burden of
cancer in 2008: GLOBOCAN 2008. Int J Cancer 2010;127:2893-917. CrossRef
2. American Joint Committee on
Cancer. AJCC Cancer Staging Manual. 7th ed. New York, NY:
Springer; 2010.
3. D’Addario G, Früh M, Reck M,
Baumann P, Klepetko W, Felip E. Metastatic non-small-cell lung
cancer: ESMO Clinical Practice Guidelines for diagnosis, treatment
and follow-up. Ann Oncol 2010;21 Suppl 5:v116-9. CrossRef
4. Yang P, Allen MS, Aubry MC, et
al. Clinical features of 5,628 primary lung cancer patients:
experience at Mayo Clinic from 1997 to 2003. Chest
2005;128:452-62. CrossRef
5. Howlader N, Noone AM, Krapcho M,
et al. SEER Cancer Statistics Review, 1975-2008. Available from:
http://seer. cancer.gov/csr/1975_2008/. Accessed 15 Sep 2011.
6. National Comprehensive Cancer
Network. NCCN Practice Guidelines in Oncology—Asian Consensus
Statement—non-small cell lung cancer (Version 1.2009). Available
from:
http://www.nccn.org/professionals/physician_gls/PDF/nscl-asia.
pdf. Accessed 21 Oct 2011.
7. Goldstraw P, Crowley J, Chansky
K, et al. The IASLC Lung Cancer Staging Project: proposals for the
revision of the TNM stage groupings in the forthcoming (seventh)
edition of the TNM classification of malignant tumours. J Thorac
Oncol 2007;2:706-14. CrossRef
8. National Comprehensive Cancer
Network. NCCN Practice Guidelines in Oncology—Non-Small Cell Lung
Cancer (Version 2.2012). Available from: http://www.nccn.org/
professionals/physician_gls/f_guidelines.asp. Accessed 10 Oct
2011.
9. Carey KD, Garton AJ, Romero MS,
et al. Kinetic analysis of epidermal growth factor receptor
somatic mutant proteins shows increased sensitivity to the
epidermal growth factor receptor tyrosine kinase inhibitor,
erlotinib. Cancer Res 2006;66:8163-71. CrossRef
10. Paz-Ares L, Soulières D,
Klughammer B, Melezínek I, Moecks J, Mok T. Pooled analysis of
clinical outcomes in studies of patients with EGFR mutations
treated with either an EGFR TKI or chemotherapy. 2009 Jul 16;
2009. Available from:
http://www.mojemedicina.cz/files/leciva/prezentace/tarceva/wclcsf/egfr-mutations-analysis-wclc-2009-paz-ares.
ppt.
Accessed Oct 2013.
11. Bria E, Milella M, Cuppone F,
et al. Outcome of advanced NSCLC patients harboring sensitizing
EGFR mutations randomized to EGFR tyrosine kinase inhibitors or
chemotherapy as first-line treatment: a meta-analysis. Ann Oncol
2011;22:2277-85. CrossRef
12. Zhou C, Wu YL, Chen G, et al.
Erlotinib versus chemotherapy as first-line treatment for patients
with advanced EGFR mutation-positive non-small-cell lung cancer
(OPTIMAL, CTONG-0802): a multicentre, open-label, randomised,
phase 3 study. Lancet Oncol 2011;12:735-42. CrossRef
13. Zhou C, Wu J, Chen G, et al.
Updated efficacy and quality of life (QoL) analyses in OPTIMAL, a
phase III, randomized, open-label study of first-line erlotinib vs
gemcitabine/ carboplatin in patients with EGFR activating-mutation
positive (EGFR Act Mut+) advanced non-small cell lung cancer
(NSCLC). 2011 ASCO Annual Meeting. J Clin Oncol 2011;29 Suppl:
abstract 7520.
14. Mok TS, Wu YL, Thongprasert S,
et al. Gefitinib or carboplatin-paclitaxel in pulmonary
adenocarcinoma. N Engl J Med 2009;361:947-57. CrossRef
15. Maemondo M, Inoue A, Kobayashi
K, et al. Gefitinib or chemotherapy for non-small-cell lung cancer
with mutated EGFR. N Engl J Med 2010;362:2380-8. CrossRef
16. Mitsudomi T, Morita S, Yatabe
Y, et al. Gefitinib versus cisplatin plus docetaxel in patients
with non-small-cell lung cancer harbouring mutations of the
epidermal growth factor receptor (WJTOG3405): an open label,
randomised phase 3 trial. Lancet Oncol 2010;11:121-8. CrossRef
17. Kim ST, Lee J, Sun JM, et al.
Prognostic model to predict outcomes in non-small cell lung cancer
patients with erlotinib as salvage treatment. Oncology
2010;79:78-84. CrossRef
18. Sardari Nia P, Van Marck E,
Weyler J, Van Schil P. Prognostic value of a biologic
classification of non-small-cell lung cancer into the growth
patterns along with other clinical, pathological and
immunohistochemical factors. Eur J Cardiothorac Surg
2010;38:628-36. CrossRef
19. Kefeli U, Kaya S, Ustaalioglu
BO, et al. Prognostic factors in elderly patients with non-small
cell lung cancer: a two-center experience. Med Oncol
2011;28:661-6. CrossRef
20. Bucher HC, Guyatt GH, Griffith
LE, Walter SD. The results of direct and indirect treatment
comparisons in meta-analysis of randomized controlled trials. J
Clin Epidemiol 1997;50:683-91. CrossRef
21. Wells GA, Sultan SA, Chen L,
Khan M, Coyle D. Indirect evidence: indirect treatment comparisons
in meta-analysis. Available from:
http://www.cadth.ca/index.php/en/hta/
reports-publications/search/publication/884. Accessed 19 Oct 2011.
22. Song F, Altman DG, Glenny AM,
Deeks JJ. Validity of indirect comparison for estimating efficacy
of competing interventions: empirical evidence from published
meta-analyses. BMJ 2003;326:472. CrossRef
23. Tudur C, Williamson PR, Khan
S, Best LY. The value of the aggregate data approach in
meta-analysis with time-to-event outcomes. J R Stat Soc Ser A Stat
Soc 2001;164:357- 70. CrossRef
24. Woods BS, Hawkins N, Scott DA.
Network meta-analysis on the log-hazard scale, combining count and
hazard ratio statistics accounting for multi-arm trials: a
tutorial. BMC Med Res Methodol 2010;10:54. CrossRef
25. Snedecor GW, Cochran WG.
Statistical methods. 8th ed. Iowa, US: Iowa State University
Press; 1989: 64-82.
26. Wells GA, Sultan SA, Chen L,
Khan M, Coyle D. Indirect treatment comparison software
application (Version 1.0). Available from:
http://www.cadth.ca/en/resources/about-this-
guide/download-software. Accessed 21 Oct 2011.
27. Yang CH, Fukuoka M, Mok T, et
al. Final overall survival results from a phase III, randomised,
open-label, first-line study of gefitinib versus
carboplatin/paclitaxel in clinically selected patients with
advanced non–small-cell lung cancer in Asia. Presented at 35th
ESMO Congress; 2010 Oct 8; Milan, Italy: Abstract LBA2.
28. Nafees B, Stafford M, Gavriel
S, Bhalla S, Watkins J. Health state utilities for non small cell
lung cancer. Health Qual Life Outcomes 2008;6:84. CrossRef
29. Taiwan Society for
Pharmacoeconomic and Outcomes Research. Guidelines of
Methodological Standards for Pharmacoeconomic Evaluations in
Taiwan 2006. Available from: http://www.ispor.
org/PEguidelines/countrydet.asp?c=31&t=1. Accessed 19 Oct
2011.
30. Census and Statistics
Department, HKSAR. Hong Kong in figures—2012 Edition. Available
from: http://www.statistics. gov.hk/pub/B10100032012AN12B0100.pdf.
Accessed 21 Oct 2013.
31. Tan-Torres Edejer R, Baltussen
R, Adam T, et al. Making choices in health: WHO guide to
cost-effectiveness analysis. Geneva: WHO; 2003. Available from:
http://www.who.int/
choice/publications/p_2003_generalised_cea.pdf. Accessed 21 Oct
2013.
32. Han JY, Park K, Kim SW, et al.
First-SIGNAL: first-line single-agent iressa versus gemcitabine
and cisplatin trial in never-smokers with adenocarcinoma of the
lung. J Clin Oncol 2012;30:1122-8. CrossRef
33. Rosell R, Carcereny E, Gervais
R, et al. Erlotinib versus standard chemotherapy as first-line
treatment for European patients with advanced EGFR
mutation-positive non-small-cell lung cancer (EURTAC): a
multicentre, open-label, randomised phase 3 trial. Lancet Oncol
2012;13:239- 46. CrossRef
34. Ahn MJ, Lee J, Park YH, et al.
Korean ethnicity as compared with white ethnicity is an
independent favorable prognostic factor for overall survival in
non-small cell lung cancer before and after the oral epidermal
growth factor receptor tyrosine kinase inhibitor era. J Thorac
Oncol 2010;5:1185- 96. CrossRef
35. Soo RA, Loh M, Mok TS, et al.
Ethnic differences in survival outcome in patients with advanced
stage non-small cell lung cancer: results of a meta-analysis of
randomized controlled trials. J Thorac Oncol 2011;6:1030-8. CrossRef
36. Soo RA, Kawaguchi T, Loh M, et
al. Differences in outcome and toxicity between Asian and
caucasian patients with lung cancer treated with systemic therapy.
Future Oncol 2012;8:451-62. CrossRef
37. Li J, Zhao M, He P, Hidalgo M,
Baker SD. Differential metabolism of gefitinib and erlotinib by
human cytochrome P450 enzymes. Clin Cancer Res 2007;13:3731-7. CrossRef
38. Ranson M, Hammond LA, Ferry D,
et al. ZD1839, a selective oral epidermal growth factor
receptor-tyrosine kinase inhibitor, is well tolerated and active
in patients with solid, malignant tumors: results of a phase I
trial. J Clin Oncol 2002;20:2240-50. CrossRef
39. Hidalgo M, Siu LL, Nemunaitis
J, et al. Phase I and pharmacologic study of OSI-774, an epidermal
growth factor receptor tyrosine kinase inhibitor, in patients with
advanced solid malignancies. J Clin Oncol 2001;19:3267-79.