© Hong Kong Academy of Medicine. CC BY-NC-ND 4.0
ORIGINAL ARTICLE
Profiling unmet post–acute care needs of an
inpatient population in Hong Kong: can real-world data and machine learning algorithms bring precision to tertiary prevention in the community?
Eman Leung, PhD1,2; Jingjing Guan, PhD3; Frank Youhua Chen, PhD1; Sam CC Ching, BBA2; Hector Tsang, PhD4; Martin CS Wong, MD, FHKAM (Family Medicine)2; Olivia Lam, MPH2; Yinan He, MPH2; Sarah TY Yau, MPH2; Yilin Liu, MPH2; CB Law, MB, BS5; NY Chan, MB, BS5; YF Wong, PhD5; YH Chow, BSocSc6; CT Hung, FHKAM (Anaesthesiology)2; EK Yeoh, FHKAM (Medicine)2; Albert Lee, MD, FHKAM (Family Medicine)2,4,7
1 Department of Management Sciences, City University of Hong Kong, Hong Kong SAR, China
2 The Jockey Club School of Public Health and Primary Care, The Chinese University of Hong Kong, Hong Kong SAR, China
3 EpitelligenceHK, Hong Kong SAR, China
4 Department of Rehabilitation Science, Hong Kong Polytechnic University, Hong Kong SAR, China
5 Kowloon West Cluster, Princess Margaret Hospital and North Lantau Hospital, Hong Kong SAR, China
6 Kwai Tsing Safe Community and Healthy City Association, Hong Kong SAR, China
7 Centre for Health Education and Health Promotion, The Jockey Club
School of Public Health and Primary Care, The Chinese University of
Hong Kong, Hong Kong SAR, China
Corresponding author: Prof Albert Lee (alee@cuhk.edu.hk)
 Full paper in PDF
Abstract
Introduction: Case-mix systems aim to optimise
acute care resource allocation, yet patients within
the same groups often exhibit substantial variability
in utilisation. This study aimed to examine how
incorporating measures of clinical complexity
and post–acute care utilisation—both critical
to rehospitalisation risk and accurate resource
planning—into case-mix stratification could improve
the precision of acute care resource allocation.
Methods: Through iterative applications of
unsupervised and supervised machine learning
models, we extracted typical patient profiles
from the study populations, analysed post–acute
care utilisation patterns, and assessed the 28-day
rehospitalisation rates resulting from different
pairings between clinical profiles and post–acute
care service utilisation patterns.
Results: Across various disease systems and age-groups,
patients discharged without receiving
algorithm-selected post–acute care (ie, No Service
groups [NS groups]) showed significantly higher
28-day rehospitalisation rates relative to their
corresponding segments in the same medoid case-mix
groups (CMGs; pooled odds ratio [OR]=19.27;
P<0.001). The NS groups also demonstrated higher
rates of having two or more chronic diseases
(pooled OR=1.84; P<0.001) and—for the 50-64–year-old population—resource-intensifying co-morbidities
(pooled OR=1.23; P=0.05). Patients
displaying higher rates of resource-intensifying
co-morbidities compared with their ≥65-year-old
counterparts (such as when the medoid CMG was
renal failure or chronic obstructive pulmonary
disease) also exhibited significantly higher 28-day
rehospitalisation rates than the ≥65–year-old NS
groups sharing the same medoid CMGs.
Conclusion: These findings support a precision-driven approach to designing rehospitalisation
prevention programmes that target individuals
aged 50 to 64 years discharged with specific clinical
profiles, and developing and allocating human
capital for these targeted prevention programmes.
New knowledge added by this study
- Our novel machine learning analyses revealed that ambulatory care–sensitive conditions such as chronic obstructive pulmonary disease and general digestive symptoms were the diagnoses received by patients who were ‘typical’ (ie, the medoid) of the studied inpatient population and its subpopulations of patients with unmet post–acute care needs.
- Higher proportions of patients aged 50 to 64 years in the subpopulations had histories of two or more chronic illnesses prior to the index hospitalisation, had resource-intensifying co-morbidities at the index hospitalisation, and rehospitalised within 28 days after being discharged.
- Tertiary prevention programmes targeting specific profiles of individuals aged 50 to 64 years who are discharged into the community can help relieve the burden on hospital services.
- The integration of post–acute care utilisation data and clinical complexity indicators into population stratification can improve the precision of tertiary prevention planning and resource allocation across community and hospital settings.
Introduction
To standardise clinical practices and inform
targeted policy decisions, major health systems
segment their populations into case-mix groups
(CMGs). With expert input and analytical methods,
CMGs are designed with optimal granularity—balancing individual-level clinical care decisions and
population-level acute care resource allocation1—and judicious parsimony, selecting indicators from
the wealth of information extracted from patient
electronic health records (see online supplementary Table 1 for a comparison of major healthcare systems’
case-mix frameworks).
However, clinical case-mix systems often
provide imperfect estimations of their populations’
acute care utilisation.2 3 4 It has been suggested that
critical drivers of acute care admissions and 28-day
rehospitalisations, such as clinical complexity,5 6
are not often included as indicators for stratifying
patients. Also, the linkage between case mixes of
populations and their respective post–acute care
(PAC) needs has not been established, although
PAC can reduce rehospitalisations and mitigate
the rehospitalisation risk associated with clinical
complexity.7 In fact, not only have the PAC needs
of patients discharged under various case-mix
classifications remained unexplored, but studies
examining the effects of PAC on acute care utilisation
often fail to consider the diversity of PAC service
types8 9 and their differential effects on patients
with distinct clinical profiles.10 11 12
Therefore, this study aimed to identify the
factors contributing to the discrepancy between
the objectives of case-mix systems—optimising the
efficient allocation of acute care resources—and
the observed heterogeneity in acute care utilisation
among patients within the same CMGs. Specifically,
although clinical complexity and PAC utilisation
influence the rehospitalisation risk of discharged
patients—which in turn affects the accuracy of
population-level acute care resource planning—they are not typically included in case-mix systems for patient stratification. Thus, we examined the
heterogeneity and relationships among clinical
complexity, PAC utilisation, and rehospitalisation
risk within homogeneous patient segments.
These segments were partitioned from the study
population using conventional case-mix parameters
and acute care utilisation metrics. Given this
context, we hypothesised that among patients within
the same homogeneous segments, those who did not receive effective PAC would exhibit the highest
rates of 28-day rehospitalisation. Additionally, we
hypothesised that greater clinical complexity would
increase the likelihood of rehospitalisation occurring
before receipt of any effective PAC.
Methods
Study population
In this study of an inpatient population of 197 805
individuals (aged >50 years) discharged into the
community, a combination of unsupervised and
supervised learning algorithms was deployed (Fig 1).
First, unsupervised learning algorithms were applied
to identify typical patients (ie, medoids) using a
comprehensive set of clinical parameters (including
discharged patients’ CMGs) and acute care
utilisation data.13 Patients similar to typical patients
in terms of these parameters were clustered into the
same segments. Each resulting segment was labelled
according to the Major Clinical Category (MCC)13
assigned to its medoid. According to case-mix
methodologies adopted by major healthcare systems
(eg, CMG+ of Canada13), the MCC reflects the
primary body system or medical specialty involved
and provides a high-level overview of the patient’s
condition. Within each MCC, patients are further
classified into more specific CMGs based on detailed clinical and resource utilisation characteristics. We
therefore expected that patients within the same
segment would share the same MCC as the medoid,
although their CMGs might differ. Consequently,
each segment was labelled with the medoid’s MCC.
The International Classification of Diseases codes
constituting each CMG and the corresponding MCC
for each are shown in online supplementary Table 2.
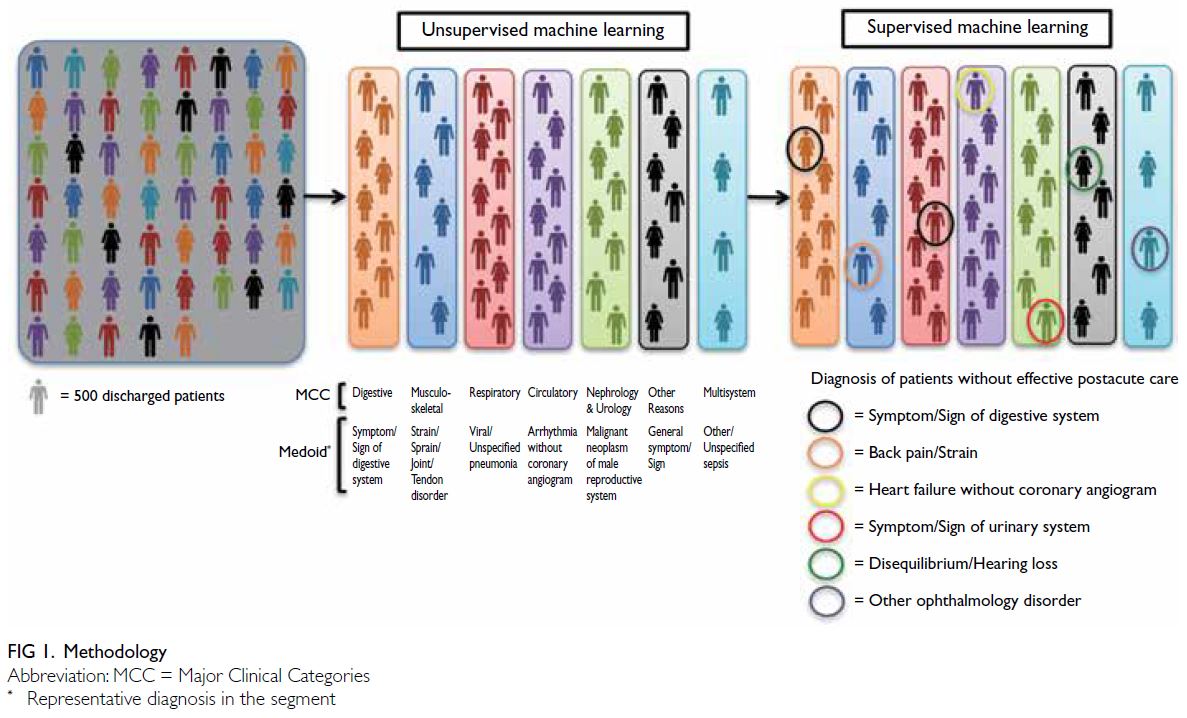
Figure 1. Methodology
Study design
Second, with additional features representing
the types and timing of PAC service utilisation,
28-day rehospitalisation outcome–supervised
machine learning algorithms (Unbiased Recursive
Partitioning with Surrogate Splitting [URPSS]14)
were applied to recursively partition clinically
homogeneous segments into subpopulations, each
characterised by homogeneous PAC utilisation. The
URPSS has previously been used to compare the
effects of clinical profiles and acute care utilisation
on 28-day rehospitalisations with those of different
PAC service types, isolating the unique contribution
of patients’ clinical and acute care factors.15 In this
study, we adopted a complementary approach by
isolating each PAC service type’s unique contribution
to 28-day rehospitalisation while adjusting for
the influence of the end user’s clinical profile and
acute care utilisation. To achieve this approach, we first partitioned the population into segments with
homogeneous clinical and acute care utilisation
profiles. Within each segment, the URPSS algorithm
was then applied to infer the effects of PAC on
28-day rehospitalisation, contingent on patients’
clinical and acute care characteristics. A detailed
description of the hybrid machine learning approach
used to disentangle post-acute from acute influences
is provided in the online Appendix.14 15 16
Among the different subpopulations
partitioned from each segment, one inevitably
remained unpartitioned by any feature representing
the PAC services for which the algorithm found
significant conditional inferences on 28-day
rehospitalisation. We hypothesised that this
unpartitioned subpopulation—representing patients
whose acute care needs (as reflected by the
comprehensive segmenting features of clinical and
acute care utilisation parameters) were homogeneous
with others in the same segment but who lacked any
28-day rehospitalisation–mitigating PAC services—would exhibit the highest clinical complexity and
28-day rehospitalisation rates. These groups of
discharged patients, whose rehospitalisation risk
was high but who lacked algorithm-selected PAC
services, are hereafter referred to as the No Service
groups (NS groups).
In conjunction with the 28-day rehospitalisation
rate, the prevalence of clinical complexity—reflected
by the presence of two or more chronic illnesses
diagnosed prior to the index hospitalisation and
by acute care resource-intensifying co-morbid
diagnoses at index hospitalisation5 6—was also
compared between the NS groups and their
corresponding segments. We hypothesised that
greater clinical complexity would be associated
with an increased likelihood of patients being
rehospitalised before receiving any effective PAC.
Comparisons were also made between populations
aged 50-64 years and 65 years or above. Research has
shown that adults aged 50 to 64 years face unique
health challenges and experience care gaps not
observed among those aged 65 years or above.16 In
particular, care gaps predominantly affecting the
50-64 age-group have been linked to inaccuracies
in predicting patients’ acute care needs using case-mix
models,17 which were primarily developed from
inpatient populations aged 65 years and older.18 19 20 21
Although many comparisons could be made
between the NS groups and their corresponding
segments across all segments partitioned from the
50-64–year-old or ≥65–year-old populations—and
between the NS groups or segments of the two
populations—comparisons were restricted to the NS
groups and their corresponding segments that shared
the same medoid CMGs, to ensure homogeneity in
clinical and acute care utilisation profiles between the
subgroups being compared. Similarly, comparisons between the 50-64–year-old and ≥65–year-old NS
groups or between the 50-64–year-old and ≥65–year-old segments were confined to pairs with the
same medoid CMGs. The odds ratios (ORs), 95%
confidence intervals (95% CIs), and P values resulting
from comparisons between each same-CMG pair
for clinical complexity and 28-day rehospitalisation
were calculated from a subset of the descriptive
statistics reported in online supplementary Tables 3 (for the 50-64–year-old age-group) and 4 (for the ≥65–year-old age-group). In addition to the
presence of data regarding the prevalence of clinical
complexity and 28-day rehospitalisations, these
supplementary tables include the comprehensive set
of features that: (1) constitute the CMGs adopted
in this study, (2) segment the 50-64–year-old and
≥65–year-old populations, and (3) partition each
segment to identify its corresponding NS groups.
These features encompass diagnoses, age, sex,
resource-intensive interventions received at index
acute care hospitalisation, and resource-intensifying
co-morbidities diagnosed at index acute care
hospitalisation. Given that the contributions of these
features to clinical profile variability had already
been adjusted for through multiple iterations,
they were unlikely to be selected by the URPSS
algorithm to split a segment into subpopulations.
Our focus therefore remained on demonstrating the
high prevalence of clinical complexity and 28-day
rehospitalisation among the NS groups, rather than
on features not selected by the URPSS.
We tested our hypotheses regarding the
elevated risks of the NS groups compared with their
parent segments (particularly for the 50-64–year-old
population) through selected paired comparisons
and omnibus testing. By aggregating results
across different same-CMG pairs, we followed the
standard epidemiological practice of utilising all
available evidence from various subgroups within
a single sample to maximise the robustness and
generalisability of estimates while adjusting for
inherent sample stratification.22 23 Indeed, whereas
analysis of an entire sample may overlook underlying
confounding factors, a strong focus on stratified
subgroup analyses can lead to misinterpretations
that inflate the effects of confounding variables on
outcomes and distort the relationships between risk
factors and outcomes.24 25 To quantify the likelihood
of clinical complexity and 28-day rehospitalisation
rates in the NS groups versus their parent segments,
we pooled ORs using the Mantel-Haenszel formula26
across same-CMG pairs within each age population
and between the 50-64–year-old and ≥65–year-old
populations (calculated from the ORs and associated
95% CIs and P values reported in Table 1). This
approach allowed us to evaluate overall differences
in co-morbidity, chronic illnesses, and 28-day
rehospitalisations between age-groups and between the NS groups and their corresponding segments.
The Mantel-Haenszel formula has been applied in
diverse clinical contexts involving a single patient
sample or population, including a targeted patient
group with traumatic brain injury,27 a regional
population admitted from multiple hospitals with
different major diagnoses,28 and a case-control
study combining matched and unmatched control
groups.29 Results reported below include pooled
ORs, 95% CIs, P values, and, where applicable, Q
statistics with corresponding P values to indicate
significant heterogeneity among pooled ORs.
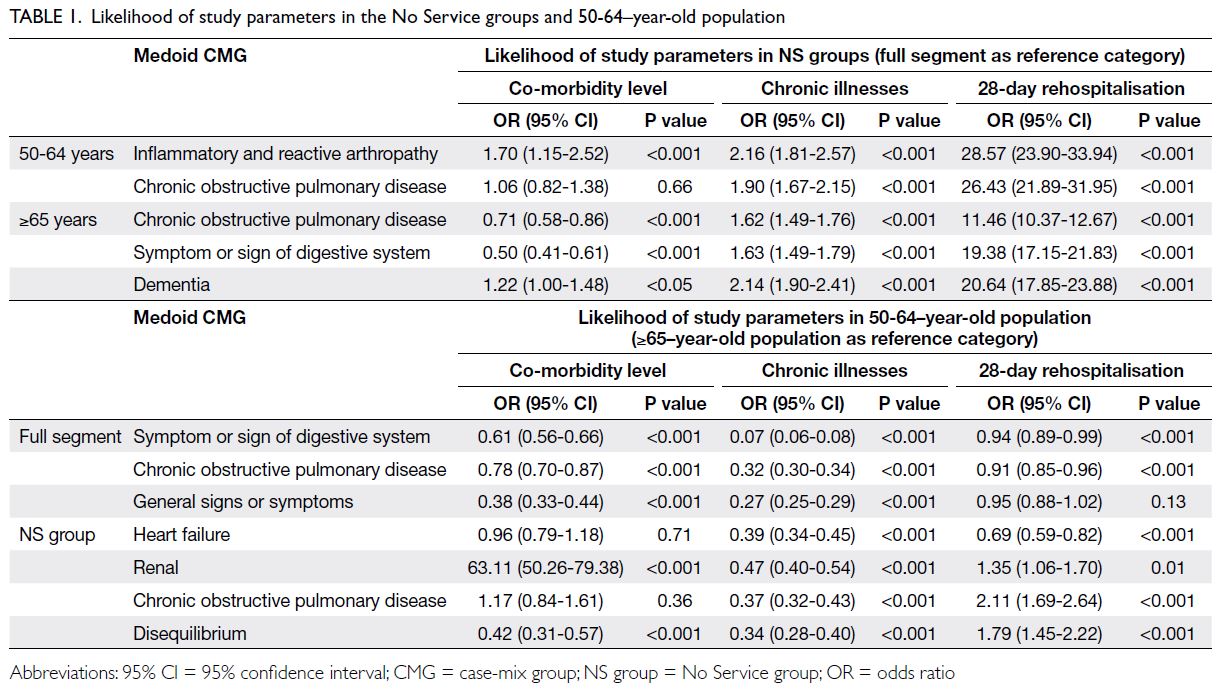
Table 1. Likelihood of study parameters in the No Service groups and 50-64–year-old population
Results
Below, we describe the clinical profiles of typical
patients (medoids) in the 50-64–year-old and
≥65–year-old populations and their corresponding
population segments. We then report the order in
which the URPSS algorithm selected PAC services
based on their unique statistical importance in
classifying 28-day rehospitalisation. We also
characterise the clinical profiles of patients who
received none of the URPSS-selected PAC services
(ie, the NS groups). Finally, we compare the rates of
resource-intensifying co-morbidities, the presence
of two or more chronic diseases, and 28-day
rehospitalisations between the NS groups and their corresponding segments, as well as between the
50-64–year-old and ≥65–year-old populations.
Profiles of typical patients and associated
segments in the 50-64–year-old and ≥65–year-old populations
The Calinski–Harabasz index indicated that the
optimal number of segments was seven for the
50-64–year-old population and eight for the ≥65–year-old population.30 Our analyses revealed that
the seven typical patients identified in the 50-64–year-old population belonged to the same MCCs as
their counterparts in the ≥65–year-old population:
Circulatory, Digestive, Nephrology and urology,
Musculoskeletal, Respiratory, Multiple systems
of diseases and disorders, and Other reasons for
hospitalisation. Additionally, four MCCs shared
between the two age-groups were characterised by
identical CMGs: Symptom or sign of digestive system
(Digestive), Malignant neoplasm of urinary system
(Nephrology and urology), Chronic obstructive
pulmonary disease (Respiratory), and General
symptom or sign (Other reasons for hospitalisation).
In the ≥65–year-old population, we identified an
eighth segment, whose typical patient’s CMG was
dementia, belonging to the MCC of Diseases and
disorders of the mental system.
Utilisation of post–acute care services and
associated 28-day rehospitalisation rates
Tables 2 and 3 report the type, sequence (reflecting
the descending rank order of marginal contribution
feature importance), and associated 28-day
rehospitalisation rates of each PAC service selected
by the URPSS algorithm. With areas under the
receiver operating characteristic curve ranging
from 0.85 to 0.93, the URPSS algorithms classified
28-day rehospitalisation outcomes in every segment
partitioned from the two populations using features
selected for their unique contributions to outcomes.
Among all features in the pool to which the URPSSs
were applied (online supplementary Table 5), only
PAC-related features were selected to split segments
that had previously been partitioned from the
population using other features (eg, sex) that were
unrelated to PAC.
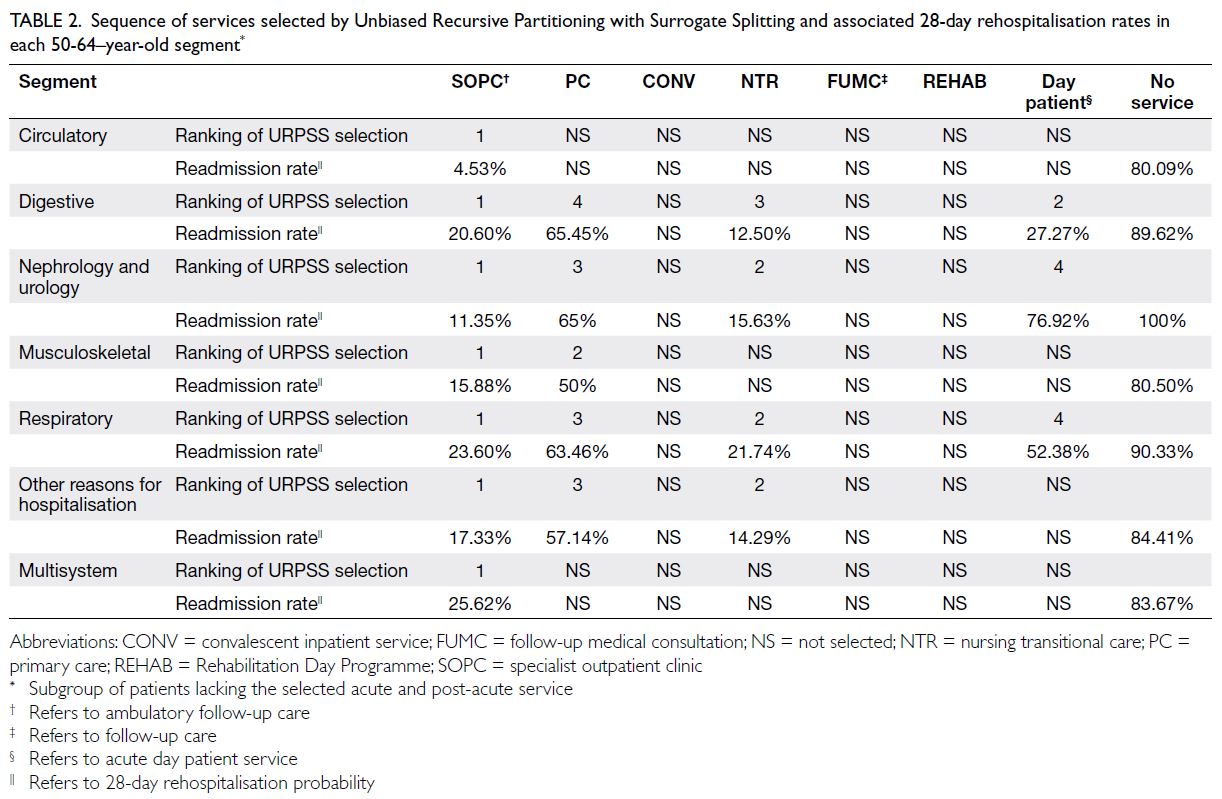
Table 2. Sequence of services selected by Unbiased Recursive Partitioning with Surrogate Splitting and associated 28-day rehospitalisation rates in each 50-64–year-old segment
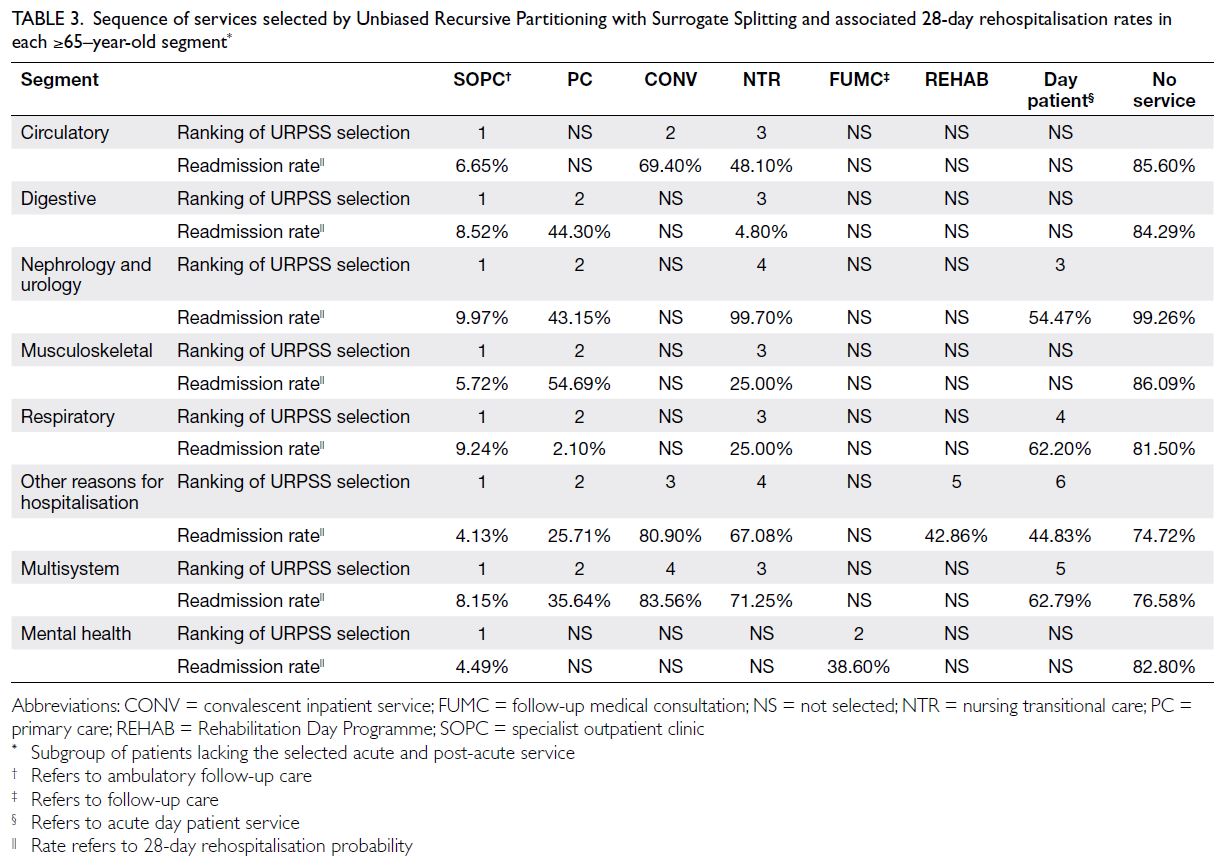
Table 3. Sequence of services selected by Unbiased Recursive Partitioning with Surrogate Splitting and associated 28-day rehospitalisation rates in each ≥65–year-old segment
Our analyses revealed that, compared with
all other PAC services, specialist outpatient clinics
(SOPCs) had the greatest marginal contribution
to 28-day rehospitalisation outcomes among
patients with similar clinical profiles and acute
care utilisation patterns, even after adjusting for
the effects of the segments’ patient clinical profiles and acute care utilisation patterns on 28-day
rehospitalisations through conditional inference.
Additionally, SOPCs’ contribution to 28-day
rehospitalisation was not conditional on the effects
of other features. Consequently, the lowest 28-day
rehospitalisation rates were observed among SOPC
attendees across all homogeneous population
segments. Nevertheless, although SOPCs had the
highest marginal contribution feature importance—and were associated with the lowest 28-day
rehospitalisation rates—in all segments across
both populations, the 28-day rehospitalisation
rates among SOPC attendees were higher in every
segment of the 50-64–year-old population compared
with the corresponding segments of the ≥65–year-old
population (mean difference between segments
with the same MCC profiles: 9.5%).
As shown in Tables 2 and 3, the 28-day
rehospitalisation rates were consistently the highest
among subpopulations within each segment that
remained unsplit after the sequential selection and
partitioning by features representing PAC services
that the URPSS identified as highly important to
28-day rehospitalisation outcomes (ie, the NS groups).
For example, among the 50-64–year-old population,
the mean difference in 28-day rehospitalisation rates between the NS groups and those in the same
segments who received SOPC care (the PAC service
with the greatest feature importance) was 70.01%;
the mean difference between the NS groups and
their corresponding full segments was 66.69%.
Similarly, among the ≥65–year-old population, the
mean difference between the NS groups and patients
in the same segments who received SOPC care was
76.28%; the mean difference between the NS groups
and their corresponding full segments was 62.26%.
Notably, whereas the NS groups consistently showed
the highest 28-day rehospitalisation rates among all
subpopulations, the NS groups of the 50-64–year-old
population exhibited a greater mean difference
in 28-day rehospitalisation rates compared with their
≥65–year-old counterparts (by a mean difference of
2.99%).
Clinical complexity and 28-day
rehospitalisation of the No Service groups
and their corresponding segments in the
populations aged 50-64 years and ≥65 years
The above analyses identified a subpopulation (ie,
the NS groups) within each segment that exhibited high 28-day rehospitalisation rates but lacked
effective PAC services. To provide a more in-depth
understanding of the NS groups, we compared
28-day rehospitalisation rates, the prevalence of
resource-intensifying co-morbidities, and the
presence of two or more chronic illnesses between
the NS groups and their corresponding segments,
as well as between the 50-64–year-old and ≥65–year-old populations. Not all NS groups’ typical
patients shared the same CMGs as the medoids of
their corresponding segments, nor were the same
CMGs shared between the medoids of the 50-64–year-old and ≥65–year-old populations. Chronic
obstructive pulmonary disease (COPD) was the
only CMG consistently identified as a medoid
CMG in both populations and their corresponding
subpopulations. Therefore, a more detailed analysis
was conducted on the segment and subpopulation
with COPD CMGs to illustrate factors contributing
to the differences between NS groups and their
corresponding segments, and between the 50-64–year-old and ≥65–year-old populations.
Table 1 reports the ORs (and their associated
95% CIs and P values) for resource-intensifying co-morbidities, the presence of two or more chronic
illnesses, and 28-day rehospitalisations of NS groups
relative to their corresponding 50-64–year-old or
≥65–year-old population segments sharing the
same medoid CMGs. As shown in the table, even
when diseases of different systems were considered
across both populations, the NS groups exhibited
significantly higher rates of 28-day rehospitalisation
compared with their same-medoid-CMG segments
(pooled OR=19.27, 95% CI=17.86-20.79; P<0.001);
they also showed a greater prevalence of having two
or more chronic illnesses (pooled OR=1.84, 95%
CI=1.64-2.07; P<0.001).
Although resource-intensifying co-morbidity
is also a measure of clinical complexity, it was not
more likely to be found among NS groups than
among their same–medoid-CMG segments. Follow-up
analyses revealed that the pooled OR for the
≥65–year-old population was heterogeneous (Q
statistic=39.97, P<0.001), whereas the Q statistic for
pooled ORs in the 50-64–year-old population was
not statistically significant. Upon closer examination,
the rate of resource-intensifying co-morbidity was
indeed higher in NS groups of the 50-64–year-old
population than in their same–medoid-CMG
segments (pooled OR=1.23, 95% CI=1.00-1.52;
P=0.05); it was lower in the NS group population
aged ≥65 years than in their corresponding segments
(pooled OR=0.76, 95% CI=0.68-0.85; P<0.001).
The observation that the 50-64–year-old
population exhibits higher clinical complexity and
28-day rehospitalisation rates compared with their
≥65–year-old counterparts was directly examined
among same–medoid-CMG pairs of the 50-64–year-old and ≥65–year-old population segments,
as well as among pairs of NS group populations
aged 50-64 years and ≥65 years (Table 1). Whereas
the 50-64–year-old population showed higher
rates of resource-intensifying co-morbidity and
28-day rehospitalisation compared with the ≥65–year-old population at both the segment and NS-group
levels, these differences were not statistically
significant (pooled ORs=1.27, 95% CI=0.55-2.93,
and 1.18, 95% CI=0.84-1.65, respectively). Follow-up
analysis revealed substantial heterogeneity in
the pooled statistics, attributable to significant
variation among the pooled ORs of NS-group
pairs (Q statistics=7.81-9.43; all P<0.05). Follow-up
segment-level analyses also showed significantly
lower prevalence of all study parameters in the
50-64–year-old population compared with the ≥65–year-old population: OR=0.56 (95% CI=0.52-0.59;
P<0.001), OR=0.22 (95% CI=0.20-0.24; P<0.001),
and OR=0.93 (95% CI=0.89-0.96; P<0.001) for rates
of resource-intensifying co-morbidity, the presence
of two or more chronic illnesses, and 28-day
rehospitalisation, respectively.
Given the high heterogeneity of pooled ORs for the NS-group CMG pairs, differences in
the prevalence of study parameters between the
50-64–year-old and ≥65–year-old populations
were examined within individual NS-group pairs.
Follow-up analyses revealed that, although not
all NS-group CMG pairs showed higher rates
of resource-intensifying co-morbidity or 28-day
rehospitalisation in the 50-64–year-old population,
those that did—such as when the medoid CMG was
renal failure or COPD—also showed significantly
higher 28-day rehospitalisation rates compared
with their ≥65–year-old counterparts sharing the
same medoid CMGs. For example, in the case of
renal failure, the ORs were 63.11 (95% CI=50.26-79.38; P<0.001) and 1.35 (95% CI=1.06-1.70; P=0.01)
for resource-intensifying co-morbidity and 28-day
rehospitalisation rates, respectively (Table 1).
Finally, to consider differences in study
parameter prevalence between the NS group and
its corresponding segment when comparing clinical
complexity and 28-day rehospitalisation outcomes
between the 50-64–year-old and ≥65–year-old
populations, we examined cases in which the CMG
was COPD. Chronic obstructive pulmonary disease
was the only CMG that served as the medoid of both
the population segment and the corresponding NS
group for the 50-64–year-old and ≥65–year-old
populations, allowing us to adjust for differences
in study parameter prevalence between the NS
group and its full segment when comparing the
two age-groups. Our analyses revealed that, relative
to the statistics of the full segments, the ORs for
resource-intensifying co-morbidity, two or more
chronic illnesses, and 28-day rehospitalisation rates
were significantly greater in the 50-64–year-old NS
group than in the ≥65–year-old counterparts [ratios
of ORs=1.50 (95% CI=1.06-2.11; P=0.02), 1.17
(95% CI=1.01-1.37; P=0.04), and 2.34 (95% CI=1.84-2.96; P<0.001), respectively].
Discussion
Unmet post–acute care needs and age-related disparities
Patients aged 50 to 64 years who were discharged
without receiving algorithm-selected PAC services
(ie, the NS groups) were generally more likely to be
rehospitalised within 28 days of discharge than their
counterparts who shared similar clinical and acute
care utilisation profiles but received such services.
In some cases, the 50-64–year-old NS groups were
rehospitalised at even higher rates than the ≥65–year-old NS groups. Under these circumstances, the
50-64–year-old NS groups also exhibited higher rates
of resource-intensifying co-morbidity. This elevated
co-morbidity among patients aged 50-64 years who
experienced more frequent rehospitalisation than
their ≥65–year-old counterparts was exemplified by
NS groups whose clinical and acute care utilisation
profiles resembled the CMGs of typical patients
with renal failure and COPD—the same CMGs characterising typical patients in the ≥65–year-old
NS groups. In the case of COPD, the rates of co-morbidity,
chronic illnesses, and rehospitalisation
within the full segment could be directly considered
when comparing the 50-64–year-old and ≥65–year-old
NS groups.
Ambulatory care–sensitive case-mix profiles and preventable rehospitalisation
Similar to COPD, the majority of typical
patients’ CMGs in the full segments and NS groups
identified in the present study were considered
ambulatory care–sensitive conditions (ACSCs),31
for which hospitalisations are potentially avoidable
through timely and effective ambulatory care.
Because avoidable hospitalisations among ACSC
patients could be prevented with better access to
ambulatory and primary care services, it has been
argued that resources should be redistributed
from acute care to these services.32 Our findings
provide rare empirical support for this argument.
By comparing rehospitalisation rates among
subpopulations of patients with homogeneous
clinical profiles and acute care utilisation patterns
but differing PAC assignments, we demonstrated,
at a population level, the benefits of ambulatory
care (eg, specialist follow-up and in-home nursing
transitional care) and primary care in reducing
rehospitalisation rates among typical patient profiles
whose CMGs were ACSCs.
Notably, even ACSCs may progress into more
acute diagnoses, with a higher likelihood of co-morbidity
and elevated 28-day rehospitalisation
rates. For instance, whereas Angina or Arrhythmia
were the CMGs of typical patient profiles in the
full patient segments of the 50-64–year-old and
≥65–year-old populations, respectively, the CMG
of their NS groups’ typical patient profile was Heart
Failure; these patients exhibited higher rates of co-morbidities
and 28-day rehospitalisation. Similarly,
Digestive Malignancy was the CMG of the typical
patient profile in a 50-64–year-old NS group, which
showed higher rates of co-morbidities and 28-day
rehospitalisation than its corresponding full patient
segment, whose typical CMG was Symptom or Sign
of the Digestive System.
Post-discharge service gaps and policy implications
Despite such evidence, these services remain
largely unavailable for individuals in the studied
populations. For example, the average wait time for
SOPC appointments ranges from 9 to 111 weeks,33
in sharp contrast to the median interval between
discharge and rehospitalisation among NS patients,
which is 14 days. Given the constraints on healthcare
professional availability in the public sector, reducing
SOPC wait times may be challenging. Therefore, by
quantifying the benefits of different PAC services for
various patient profiles, the findings presented here
suggest the need for the following policy actions:
(1) procure specialist follow-up services from the
private sector and ensure effective public–private
service coordination within the parallel public and private tracks of the healthcare system studied;
and (2) enhance the provision of less scarce, near-equivalent
alternatives available in the community,
rather than relying solely on medical specialists.
Multi-morbidity in adults aged 50 to 64 years and the case for multidisciplinary tertiary prevention
In addition to the higher rehospitalisation
rates identified in the present study, typical patient
profiles with ACSC CMGs that lacked effective
PAC services also exhibited a high prevalence of
co-morbidities. The rates of co-morbidities and
28-day rehospitalisations were particularly high
among individuals aged 50 to 64 years who fit
these patient profiles. This finding aligns with
recent studies showing that younger patients with
diabetes—also a chronic ACSC—have significantly
greater co-morbidities and worse outcomes than
their older counterparts.34 Furthermore, we found
that younger patients not only have more complex
health needs but also benefit less from conventional
PAC services and are more likely to be rehospitalised
before receiving ambulatory or primary care. This
finding is consistent with current literature, which
indicates that effective rehospitalisation prevention
programmes for chronically ill patients with multiple
health problems,35 especially younger patients,
require a multidisciplinary approach to address
diverse needs such as smoking cessation,36 rather
than the conventional ‘assess-and-advise’ primary
care model of rehospitalisation prevention.37
Indeed, most evidence supporting the
benefits of multidisciplinary primary care for
chronic conditions is derived from intervention
studies targeting diseases that also represented the
CMGs of typical patients identified in our study
populations—particularly those who did not receive
PAC services deemed effective in reducing 28-day
rehospitalisation. For example, multidisciplinary
pulmonary rehabilitation programmes, which are
most effective in preventing rehospitalisation among
patients with COPD, include not only clinician-led
physical rehabilitation but also health-related
education, advice regarding exercise programmes,
targeted interventions addressing cognitive and
behavioural issues, and personalised care plans
tailored to individual needs.38 39 Similarly, community-based
cardiac rehabilitation programmes that
integrate cardioprotective therapeutics with
psychosocial care and lifestyle management are
most effective in preventing rehospitalisation
among patients with angina and arrhythmia—conditions that are often underdiagnosed in
acute care settings yet associated with high
rehospitalisation rates and natural progression
to heart failure if left untreated.40 Furthermore,
effective pain management programmes for patients
with pain-related musculoskeletal conditions—such as the inflammatory and reactive arthropathy
CMGs assigned to our typical patient profiles—are multidisciplinary in nature and combine physiotherapy with approaches that promote active
coping and self-management.41
Precision-driven tertiary prevention: case management and population stratification
Patients with multiple chronic health
conditions benefit most from multidisciplinary
care but often require treatment from numerous
healthcare professionals across both primary and
secondary care settings. To mitigate the risk of care
fragmentation redundant patient assessments, a
case management approach has been advocated as
a holistic means of addressing the complex needs of
such patients (Fig 2). For example, patients with COPD
have diverse and evolving care needs throughout
their care journey,39 requiring care that is not only
multidisciplinary but also integrated through case
management. Effective case management for patients
with COPD involves healthcare professionals who
address the most pressing needs at the initial stage of
the care journey assuming the role of case manager,
supported by community health practitioners who
coordinate other professional services as required.42
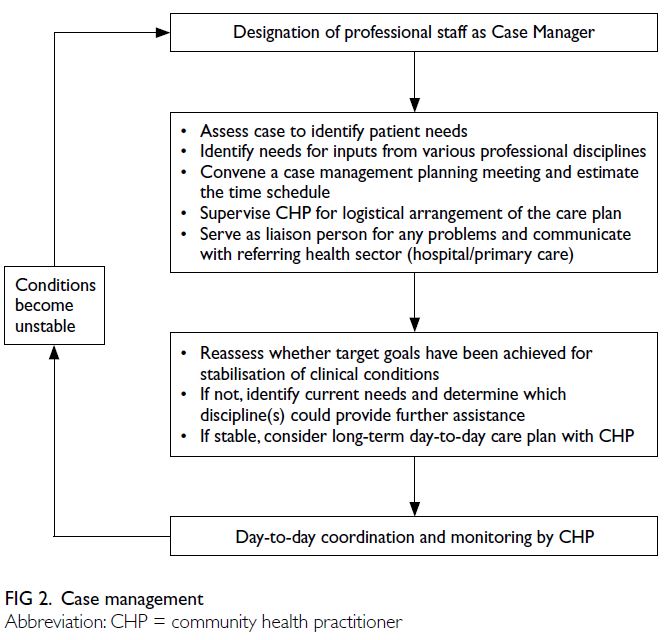
Figure 2. Case management
Given the complexity of multidisciplinary care
needs in patients with multiple chronic conditions,
and the challenge of delivering the right intervention
from the right healthcare professionals to the right
patients at the right time, the training and provision
of case management can be enhanced through a
precision-driven approach. By leveraging advanced
data analytics and machine learning, such an approach
can accurately identify care needs and service gaps to
improve the integration of multidisciplinary care.43 44
The approach used in the present study—segmenting
patient populations based on diagnostic profiles and
patterns of acute and PAC service utilisation through
iterative applications of unsupervised and 28-day
rehospitalisation outcome–supervised machine
learning algorithms—can profile unmet needs and
service gaps among patient populations discharged
into the community. Thus, our study adds value to
a body of literature largely focused on identifying
homogeneous inpatient segments solely based on
diagnoses45 46 47 48 49 50 51 or cost,52 aimed at improving acute
care management.
Limitations
This study has several limitations. First, the
data were solely derived from public hospitals
as information from private hospitals and other
healthcare providers outside the public system was
not accessible. However, it is worth noting that
public hospitals account for over 90% of inpatient
services. Second, the coding system may not capture
all patient health conditions because it mainly
focuses on chief complaints. Finally, the lack of
socio-demographic data limits the ability to generate
more precise predictions.
Conclusion
This hybrid machine learning analysis of electronic health records of discharged patient population showed that patients
aged 50 to 64 years with typical ambulatory care—sensitive case-mix profiles who did not receive
algorithm-selected PAC services had substantially
higher levels of multimorbidity and increased risk
of 28-day rehospitalisation compared with clinically
similar peers receiving such care. Integrating PAC
utilisation and clinical complexity indicators into
case-mix stratification can enable precision tertiary
prevention and guide the development of targeted,
multidisciplinary, case-managed services in the
community.
Author contributions
Concept or design: E Leung, A Lee, J Guan.
Acquisition of data: E Leung, J Guan, SCC Ching.
Analysis or interpretation of data: E Leung, J Guan, SCC Ching.
Drafting of the manuscript: E Leung, A Lee, FY Chen.
Critical revision of the manuscript for important intellectual content: All authors.
Acquisition of data: E Leung, J Guan, SCC Ching.
Analysis or interpretation of data: E Leung, J Guan, SCC Ching.
Drafting of the manuscript: E Leung, A Lee, FY Chen.
Critical revision of the manuscript for important intellectual content: All authors.
All authors had full access to the data, contributed to the study, approved the final version for publication, and take responsibility for its accuracy and integrity.
Conflicts of interest
As the Chief Editor of the journal, MCS Wong was not involved in the peer review process. Other authors declared
no conflicts of interest.
Funding/support
This research was supported by the Strategic Public
Policy Research Funding Scheme of the Hong Kong SAR
Government (Project No.: S2019.A4.015.19S) awarded to A
Lee and E Leung; the Community Involvement Fund of the
Home Affairs Department, Hong Kong SAR Government,
through Sham Shui Po District Council (Project Nos.: 220179
and 220180) awarded to E Leung and A Lee; and the General
Research Fund of the Research Grants Council of Hong Kong
(Project No.: 9043763) awarded to FY Chen. The funders
had no role in the study design, data collection/analysis/interpretation, or manuscript preparation.
Ethics approval
This research was approved by the Joint Chinese University of
Hong Kong–New Territories East Cluster Clinical Research
Ethics Committee, Hong Kong (Ref No.: SBRE-22-0386). The
requirement for patient consent was waived by the Committee
due to the use of unidentifiable information of participants in
the research.
Supplementary material
The supplementary material was provided by the authors and
some information may not have been peer reviewed. Accepted
supplementary material will be published as submitted by the
authors, without any editing or formatting. Any opinions
or recommendations discussed are solely those of the
author(s) and are not endorsed by the Hong Kong Academy
of Medicine and the Hong Kong Medical Association.
The Hong Kong Academy of Medicine and the Hong Kong
Medical Association disclaim all liability and responsibility
arising from any reliance placed on the content.
References
1. Vuik SI, Mayer E, Darzi A. A quantitative evidence base
for population health: applying utilization-based cluster
analysis to segment a patient population. Popul Health
Metr 2016;14:44. Crossref
2. Caldon LJ, Walters SJ, Reed JA, Murphy A, Worley A, Reed
MW. Case-mix fails to explain variation in mastectomy
rates: management of screen-detected breast cancer in a
UK region 1997–2003. Br J Cancer 2005;92:55-9. Crossref
3. Hof S, Fügener A, Schoenfelder J, Brunner JO. Case mix
planning in hospitals: a review and future agenda. Health
Care Manag Sci 2017;20:207-20. Crossref
4. Şentürk D, Chen Y, Estes JP, et al. Impact of case-mix
measurement error on estimation and inference in
profiling of health care providers. Commun Stat Simul
Comput 2020;49:2206-24. Crossref
5. Tumlinson A, Altman W, Glaudemans J, Gleckman H,
Grabowski DC. Post–acute care preparedness in a COVID-19 world. J Am Geriatr Soc 2020;68:1150-4. Crossref
6. Lee MC, Wu TY, Huang SJ, Chen YM, Hsiao SH, Tsai CY.
Post–acute care for frail older people decreases 90-day
emergency room visits, readmissions and mortality: an
interventional study. PLoS One 2023;18:e0279654. Crossref
7. Jamei M, Nisnevich A, Wetchler E, Sudat S, Liu E. Predicting
all-cause risk of 30-day hospital readmission using artificial
neural networks. PLoS One 2017;12:e0181173. Crossref
8. Siddique SM, Tipton K, Leas B, et al. Interventions to
reduce hospital length of stay in high-risk populations: a
systematic review. JAMA Netw Open 2021;4:e2125846. Crossref
9. McGilton KS, Vellani S, Krassikova A, et al. Understanding
transitional care programs for older adults who experience
delayed discharge: a scoping review. BMC Geriatr
2021;21:210. Crossref
10. Cao YJ, Wang Y, Mullahy J, Burns M, Liu Y, Smith M.
The relative importance of hospital discharge and patient
composition in changing post–acute care utilization and
outcomes among Medicare beneficiaries. Health Serv
Insights 2023;16:11786329231166522. Crossref
11. White HK. Post–acute care: current state and future
directions. J Am Med Dir Assoc 2019;20:392-5. Crossref
12. Geng F, Liu Z, Yan R, Zhi M, Grabowski DC, Hu L. Post–acute care in China: development, challenges, and path
forward. J Am Med Dir Assoc 2023;25:61-8. Crossref
13. Canadian Institute for Health Information. Case Mix
Decision-Support Guide: CMG+. Ottawa: Canadian Institute for Health Information; 2015.
14. Hothorn T, Hornik K, Zeileis A. Unbiased recursive
partitioning: a conditional inference framework. J Comput
Graph Stat 2006;15:651-74. Crossref
15. Guan J, Leung E, Kwok KO, Chen FY. A hybrid machine
learning framework to improve prediction of all-cause
rehospitalization among elderly patients in Hong Kong.
BMC Med Res Methodol 2023;23:14. Crossref
16. Choi NG, DiNitto DM, Choi BY. Unmet healthcare needs
and healthcare access gaps among uninsured U.S. adults aged 50-64. Int J Environ Res Public Health 2020;17:2711. Crossref
17. Hof S, Fügener A, Schoenfelder J, Brunner JO. Case mix
planning in hospitals: a review and future agenda. Health
Care Manag Sci 2017;20:207-20. Crossref
18. Fetter RB, Shin Y, Freeman JL, Averill RF, Thompson JD.
Case mix definition by diagnosis-related groups. Med Care
1980;18(2 Suppl):iii, 1-53.
19. Centers for Medicare & Medicaid Services (CMS), HHS.
Medicare program; changes to the hospital inpatient
prospective payment systems and fiscal year 2008 rates.
Fed Regist 2007;72:47130-8175.
20. Fries BE, Schneider DP, Foley WJ, Gavazzi M, Burke R,
Cornelius E. Refining a case-mix measure for nursing
homes: Resource Utilization Groups (RUG-III). Med Care
1994;32:668-85. Crossref
21. Pope GC, Kautter J, Ellis RP, et al. Risk adjustment of
Medicare capitation payments using the CMS-HCC
model. Health Care Financ Rev 2004;25:119-41.
22. Aschengrau A, Seage GR. Essentials of Epidemiology
in Public Health. 3rd edition. Burlington [MA]: Jones & Bartlett Publishers; 2013.
23. Tripepi G, Jager KJ, Dekker FW, Zoccali C. Stratification
for confounding—part 1: the Mantel-Haenszel formula.
Nephron Clin Pract 2010;116:c317-21. Crossref
24. Shrier I, Pang M. Confounding, effect modification, and the
odds ratio: common misinterpretations. J Clin Epidemiol
2015;68:470-4. Crossref
25. Knol MJ, Le Cessie S, Algra A, Vandenbroucke JP,
Groenwold RH. Overestimation of risk ratios by odds
ratios in trials and cohort studies: alternatives to logistic
regression. CMAJ 2012;184:895-9. Crossref
26. Mantel N, Haenszel W. Statistical aspects of the analysis
of data from retrospective studies of disease. J Natl Cancer
Inst 1959;22:719-48.
27. Sudhakar SK, Sridhar S, Char S, Pandya K, Mehta K.
Prevalence of comorbidities post mild traumatic brain
injuries: a traumatic brain injury model systems study.
Front Hum Neurosci 2023;17:1158483. Crossref
28. Lloyd T, Deeny SR, Steventon A. Weekend admissions
may be associated with poorer recording of long-term
comorbidities: a prospective study of emergency
admissions using administrative data. BMC Health Serv
Res 2018;18:863. Crossref
29. le Cessie S, Nagelkerke N, Rosendaal FR, van Stralen KJ,
Pomp ER, van Houwelingen HC. Combining matched and
unmatched control groups in case-control studies. Am J
Epidemiol 2008;168:1204-10. Crossref
30. Caliński T, Harabasz J. A dendrite method for cluster analysis. Commun Stat 1974;3:1-27. Crossref
31. Lin PJ, Zhong Y, Fillit HM, Cohen JT, Neumann PJ.
Hospitalizations for ambulatory care sensitive conditions and unplanned readmissions among Medicare
beneficiaries with Alzheimer’s disease. Alzheimers Dement
2017;13:1174-8. Crossref
32. Grabowski DC, Mor V. Nursing home care in crisis in the
wake of COVID-19. JAMA 2020;324:23-4. Crossref
33. Hospital Authority. Waiting time for stable new case
booking at specialist out-patient clinics. 2024. Available
from: https://www.ha.org.hk/haho/ho/sopc/dw_wait_ls.pdf. Accessed 5 Jul 2024.
34. Hong SN, Mak IL, Chin WY, et al. Age-specific associations
between the number of co-morbidities, all-cause mortality
and public direct medical costs in patients with type 2
diabetes: a retrospective cohort study. Diabetes Obes
Metab 2023;25:454-67. Crossref
35. Fong BY, Law VT, Lee A. Primary Care Revisited:
Interdisciplinary Perspectives for a New Era. Singapore:
Springer; 2020. Crossref
36. Al Quait A, Doherty P. Does cardiac rehabilitation favour
the young over the old? Open Heart 2016;3:e000450. Crossref
37. Lorig K, Holman H, Sobel D, Laurent D. Living a Healthy
Life with Chronic Conditions: Self-management of
Heart Disease, Arthritis, Diabetes, Asthma, Bronchitis,
Emphysema and Others. 3rd edition. Boulder [CO]: Bull
Publishing Company; 2006.
38. Bourbeau J, Julien M, Maltais F, et al. Reduction of hospital
utilization in patients with chronic obstructive pulmonary
disease: a disease-specific self-management intervention.
Arch Intern Med 2003;163:585-91. Crossref
39. Cravo A, Attar D, Freeman D, Holmes S, Ip L, Singh SJ.
The importance of self-management in the context of
personalized care in COPD. Int J Chron Obstruct Pulmon
Dis 2022;17:231-43. Crossref
40. Dalal HM, Doherty P, Taylor RS. Cardiac rehabilitation.
BMJ 2015;351:h5000. Crossref
41. Soares JJ, Sundin O, Grossi G. The stress of musculoskeletal
pain: a comparison between primary care patients in
various ages. J Psychosom Res 2004;56:297-305. Crossref
42. Tong KW, Fong KN. Community Care in Hong Kong:
Current Practices, Practice-Research Studies and Future
Directions. Hong Kong: City University of Hong Kong
Press; 2014.
43. Talias MA, Lamnisos D, Heraclides A. Editorial: Data
science and health economics in precision public health.
Front Public Health 2022;10:960282. Crossref
44. Leung E, Lee A, Tsang H, Wong MC. Data-driven service
model to profile healthcare needs and optimise the
operation of community-based care: a multi-source data
analysis using predictive artificial intelligence. Hong Kong
Med J 2023;29:484-6. Crossref
45. Chong JL, Lim KK, Matchar DB. Population segmentation
based on healthcare needs: a systematic review. Syst Rev
2019;8:202. Crossref
46. Mechanic R. Post–acute care—the next frontier for
controlling Medicare spending. N Engl J Med 2014;370:692-4. Crossref
47. Nnoaham KE, Cann KF. Can cluster analyses of linked
healthcare data identify unique population segments in
a general practice-registered population? BMC Public
Health 2020;20:798. Crossref
48. Lafortune L, Béland F, Bergman H, Ankri J. Health status
transitions in community-living elderly with complex care
needs: a latent class approach. BMC Geriatr 2009;9:6. Crossref
49. Liu LF, Tian WH, Yao HP. Utilization of health care
services by elderly people with National Health Insurance
in Taiwan: the heterogeneous health profile approach.
Health Policy 2012;108:246-55. Crossref
50. Eissens van der Laan MR, van Offenbeek MA, Broekhuis H,
Slaets JP. A person-centred segmentation study in elderly
care: towards efficient demand-driven care. Soc Sci Med
2014;113:68-76. Crossref
51. Joynt KE, Figueroa JF, Beaulieu N, Wild RC, Orav EJ,
Jha AK. Segmenting high-cost Medicare patients into
potentially actionable cohorts. Healthc (Amst) 2017;5:62-7. Crossref
52. Davis AC, Shen E, Shah NR, et al. Segmentation of high-cost
adults in an integrated healthcare system based on
empirical clustering of acute and chronic conditions. J Gen
Intern Med 2018;33:2171-9. Crossref