Hong Kong Med J 2022 Oct;28(5):356-66 | Epub 22 Sep 2022
© Hong Kong Academy of Medicine. CC BY-NC-ND 4.0
ORIGINAL ARTICLE
Models to predict prognosis in older patients
with heart failure complicated by pre-frailty and frailty: a pilot prospective cohort study
Takuya Umehara, PT, PhD1,2; Nobuhisa Katayama, PT3; Akinori Kaneguchi, PT, PhD1Yoshitaka Iwamoto, PT, PhD4; Miwako Tsunematsu, RN, PhD5; Masayuki Kakehashi, PhD, DSc5
1 Department of Rehabilitation, Faculty of Rehabilitation, Hiroshima International University, Higashi-Hiroshima, Japan
2 Department of Rehabilitation, Saiseikai Kure Hospital, Kure, Japan
3 Department of Rehabilitation, Kure Kyosai Hospital, Kure, Japan
4 Department of Neuromechanics, Graduate School of Biomedical and Health Sciences, Hiroshima University, Hiroshima, Japan
5 Department of Health Informatics, Graduate School of Biomedical and Health Sciences, Hiroshima University, Hiroshima, Japan
Corresponding author: Dr T Umehara (start.ume0421@gmail.com)
 Full paper in PDF
Abstract
Introduction: There are no clinical prediction
models to predict the prognosis of pre-frailty or
frailty in patients with heart failure. We aimed to
develop prediction models for the prognosis of pre-frailty
and frailty in older patients with heart failure
using the classification and regression tree (CART)
method; we then tested the predictive accuracies of
the developed models.
Methods: Patients with pre-frailty or frailty at
admission were divided into improved and non-improved
groups. The CART method was used
to establish two models: A, which predicted the
presence or absence of pre-frailty improvement
during hospitalisation; and B, which predicted the
presence or absence of frailty improvement during
hospitalisation.
Results: Patients with heart failure complicated by
pre-frailty (n=28) or frailty (n=156) were included.
In model A, the accuracy of predicting pre-frailty
improvement was high; the best predictor was single-leg
standing time at admission, followed by left
ventricular ejection fraction at admission. In model
B, the accuracy of predicting frailty improvement was
moderate; the best predictor was hand grip strength
at admission, followed by estimated glomerular
filtration rate at admission, haemoglobin level at
admission, and change in single-leg standing time during hospitalisation. The areas under the receiver
operating characteristic curves of the CART models
were 0.96 and 0.84 in models A and B, respectively.
Conclusion: Although conditions at admission
may predict the improvement of pre-frailty and
frailty during hospitalisation, cardiac rehabilitation
that improves single-leg standing time may help
to improve frailty, particularly when conditions at
admission are poor.
New knowledge added by this study
- We developed prediction models for the prognosis of pre-frailty and frailty in older patients with heart failure using classification and regression tree methods.
- Single-leg standing time at admission was the best predictor of pre-frailty improvement, whereas hand grip strength at admission was the best predictor of frailty improvement.
- Change in single-leg standing time during hospitalisation was also a predictor of frailty improvement.
- Improvements in physical function can help to manage frailty in older patients with heart failure, particularly when conditions at admission are poor.
- Cardiac rehabilitation to prolong single-leg standing time is necessary to improve frailty, particularly when conditions at admission are poor.
Introduction
Heart failure is a major public health problem that
has been shown to increase with age, such that
incidence rates rapidly increase after 80 years of age.1
Among older patients with heart failure, 18% to 54% show signs of frailty, a state of reduced physical and
cognitive function that results in weakness.2 There are
some overlapping symptoms between heart failure
and frailty; they interact to accelerate the vicious
cycle of frailty.3 One study showed that frail patients with cardiovascular disease had a 7-year survival
rate of 12%, which was much lower than the survival
rate in non-frail patients with cardiovascular disease
(43%).4 Moreover, frailty among patients with heart
failure has been associated with poor prognosis5
and reduced cardiac output capacity.6 Pre-frailty is
the first step towards frailty; approximately 34.6%
to 46.1% of individuals with pre-frailty progress to
frailty in Japan.7 Therefore, improvements in frailty
and pre-frailty are important considerations in the
care of older patients with heart failure.
Age,8 nutrition,9 walking speed,9 heart
function,8 and grip strength10 have been shown to
influence frailty improvement among older patients
with heart failure. However, the predictive accuracies
of such factors remain unknown. Moreover, a
combination of the predictors has been suggested
to increase their predictive accuracy,11 although this
hypothesis has not yet been tested. Additionally,
nutrition,12 physical function,12 and quality of
life12 have been reported to influence pre-frailty
improvement among community-dwelling older
individuals. To our knowledge, there are no reports
of factors that influence pre-frailty improvement
among patients with heart failure.
In this study, we used the classification and
regression tree (CART) method,13 which facilitates
the establishment of clinical prediction models that
can identify the best combinations of medical signs, symptoms, and other findings to predict prognoses
or treatment outcomes.13 Several clinical prediction
models have been developed using the CART
method to predict mortality in patients with heart
failure.14 15 However, no clinical prediction models
have been established to predict the prognosis of
patients with heart failure complicated by pre-frailty
and frailty.
Here, we aimed to use the CART method to
develop models that could predict the prognosis
of older patients with heart failure complicated by
pre-frailty and frailty, then confirm the predictive
accuracies of those models.
Methods
Study design
This pilot prospective cohort study followed the STROBE reporting guidelines. All included patients
provided written informed consent to participate in
the study. Identifying information was not collected
to protect each patient’s privacy. This study was
performed in accordance with the Declaration of
Helsinki.
Setting
Recruitment, follow-up, and data collection were
performed at two acute hospitals (Saiseikai Kure
Hospital, Kure, Japan; Kure Kyosai Hospital, Kure,
Japan) between July 2018 and December 2019.
Potential participants were recruited by therapists at
the rehabilitation department.
Patients
This study included patients who met the following inclusion criteria: age ≥65 years; hospitalisation
for the treatment of heart failure; and presence of
pre-frailty or frailty. The exclusion criteria were
complications during hospitalisation and/or severe
dementia (defined as a revised Hasegawa’s Dementia
Scale score ≤9).
Intervention
Cardiac rehabilitation was performed by
physical or occupational therapists to improve
physical condition, restore walking ability during
hospitalisation, and expand the activities of daily
living. Rehabilitation programmes were established
by physical or occupational therapists in accordance
with physicians’ orders. Initially, aerobic exercises
and resistance training programmes were provided
according to each patient’s physical condition.
Exercise intensity was determined using multiple
indices, including target heart rate (convenient
method: resting heart rate + 20 bpm), talk test, and
Borg scale (11-13) for the chest and lower limbs. The
type of exercise was modified (ie, duration extended and load increased) with consideration of each
patient’s symptoms and haemodynamics. If necessary,
functional exercises (eg, neuromuscular facilitation,
joint range of motion, and muscle strengthening
exercises), exercises for activities of daily living,
and psychological support were implemented for
patients and their families. Exercises for activities
of daily living were customised according to the
functions that each patient needed for discharge.
Overall, the duration and frequency of intervention
were 30 minutes to 1 hour per day and 5 days per
week, respectively.
Variables
Variables included demographic and clinical
characteristics, frailty assessment results, and
physical function. Demographic characteristics
included age, sex, body mass index, living
arrangement (with family members or alone), New
York Heart Association class, medical history (eg,
heart failure, coronary artery disease, valvular disease,
hypertension, diabetes mellitus, dyslipidaemia,
atrial fibrillation, chronic renal dysfunction, and/or
stroke), cognitive function assessed using the revised
Hasegawa’s Dementia Scale, Life-Space Assessment
score, interval from admission to initiation of
cardiac rehabilitation, interval from admission to
rehabilitation room entry, and length of hospital stay.
Hasegawa’s Dementia Scale scores of 21-30, 15-20,
10-14, and ≤9 were regarded as normal, suspected
dementia, mild to moderate dementia, and severe
dementia, respectively.16 The Life-Space Assessment
developed by Baker et al17 was used to evaluate life-space
mobility. Up to 120 points were assigned based
on the degree of independence in each life-space
level during the month prior to the assessment;
higher scores were considered indicative of broader
life-space and/or greater independence.
Clinical characteristics included blood data,
cardiac function, and pharmacotherapy. Blood
data included the Geriatric Nutritional Risk Index,
brain natriuretic peptide level, estimated glomerular
filtration rate (eGFR), and haemoglobin (Hb)
level. Cardiac function was evaluated using left
ventricular ejection fraction (LVEF), as determined
by echocardiography. Pharmacotherapy data
included whether patients were receiving dopamine,
dobutamine, noradrenaline, phosphodiesterase III
inhibitor, or diuretics.
Frailty was assessed using the following five
conditions based on the Cardiovascular Health
Study (CHS) Index: slow gait speed, weakness,
exhaustion, low activity, and weight loss.18 Slow
gait speed was defined as <1.0 m/s. Weakness was
assessed using maximum grip strength according
to sex-specific cut-offs (<26 and <18 kg for men
and women, respectively). Exhaustion was assessed
using the question “During the past 2 weeks, have you felt tired without a specific reason?” A positive
response to this question (ie, “yes”) was considered
indicative of exhaustion. Physical activity was
evaluated using the question “Do you engage in
low levels of physical activity to improve your
health?” A negative response to this question (ie,
“no”) was considered indicative of a low activity
level. Weight loss was assessed using the question
“Have you lost 2 kg or more in the past 6 months?”
A positive answer to this question was considered
indicative of weight loss. There are various criteria
for assessing frailty; Fried’s frailty phenotype model18
and the accumulated deficit model established by
Mitnitski et al19 are well known. The CHS criteria and
the Frailty Index were developed based on the above
frailty phenotype model and accumulated deficit
model, respectively. Furthermore, a Japanese version
of the CHS criteria (J-CHS) has been established,20
and its validity has been confirmed.21 Thus, we
selected the J-CHS to assess frailty. Patients with
none of the above conditions were considered non-frail
(robust), patients with one to two conditions
were considered pre-frail, and patients with three
conditions or more were considered frail.22
Physical function was assessed using the
Short Physical Performance Battery score, 10-metre
walk time, single-leg standing time, and hand grip
strength. Patients performed the Short Physical
Performance Battery test in the following sequence,
in accordance with the National Institute on Aging
protocol: standing balance tests, gait test (4 m), and
chair stand test (five repetitions). The sum of the
three test components comprised the final Short
Physical Performance Battery score, which ranged
from 0 to 12; a score of 12 indicated optimal lower
extremity function.23 24 Moreover, 10-m walk time
was measured at a comfortable walking speed
to assess walking ability. The 10-m walk test has
demonstrated high validity and reliability in multiple
populations, including healthy older individuals
and patients with stroke, neurological disorders,
or orthopaedic dysfunction.25 26 Measurements
were performed twice at an interval of 30 s; the
smaller value was used to indicate walking ability.
Standing balance was evaluated by measuring
single-leg standing time, which reflects the ability to
maintain the body’s centre of gravity within its base
of support. A stopwatch was used to measure the
duration that a patient could stand on one leg with
their eyes open and hands on their waist, without any
assistance or falling. A second trial was performed
if the result of the first trial was <60 s.27 Hand grip
strength (kg) was measured using a digital hand grip
strength dynamometer (TKK-5101; Takei Scientific
Instruments, Tokyo, Japan or 12B3X00030; Tsutsumi
Works, Chiba, Japan). Accordingly, patients were
asked to squeeze the dynamometer with maximum
effort during two trials for each hand. The maximum value (rounded to the nearest 0.1 kg) for either the
left or right hand was used for subsequent analyses.28
Demographic and clinical characteristics were
assessed upon admission or each time, whereas
cognitive function and Life-Space Assessment were
assessed during the first physical therapy session.
Frailty and physical function were assessed upon
initial entry into the rehabilitation room and at
discharge. The amount of change in physical function
(discharge−initial) was calculated.
Bias
To reduce selection bias, outcomes were selected based on the methods of previous studies.16 17 18 19 20 21 22 23 24 25 26 27 28
To reduce measurement bias, the first author (T
Umehara) was not involved in participant enrolment
or data collection. Patients received explanations
about the purpose of the study but did not receive
information concerning the hypothesis tested.
Statistical analysis
Classification and regression tree analysis29 was
used to predict the primary outcomes. Patients with
pre-frailty at admission were categorised into an
improved group and a non-improved group: patients
who were non-frail at discharge were assigned to
the improved group, whereas patients who were
pre-frail or frail were assigned to the non-improved
group. Similarly, patients with frailty at admission
were categorised into an improved group and a non-improved
group: patients who were non-frail or
pre-frail at discharge were assigned to the improved
group, whereas patients who were frail were assigned
to the non-improved group. Binary trees were used to
recursively split predictor variables based on answers
to yes/no questions for each variable. All statistical
distributions were considered without limitation to
linear relationships between outcome variables and
predictor variables. These algorithms have been used
to develop prediction models in various fields.30 31 32
The CART method with the Gini index was used
for the following models: A, which predicted the
presence or absence of pre-frailty improvement
during hospitalisation; and B, which predicted the
presence or absence of frailty improvement during
hospitalisation. Pre-frailty or frailty improvement
was the dependent variable, whereas demographic
and clinical characteristics, pharmacotherapy,
and amount of change in physical function were
the independent variables. The accuracies of the
CART models were evaluated using the area
under the receiver operating characteristic curve
(AUROC). The method proposed by Delong et al33
was used to identify optimal cut-off points.
Subsequently, the sensitivity, specificity, positive
likelihood ratio (PLR), and negative likelihood ratio
(NLR) were calculated. To assess model validity, cross-validation was performed as follows: the
sample was divided into 10 subgroups and the
model developed from nine subgroups was used to
test the 10th subgroup; this was repeated for all 10
combinations and the rates of misclassification were
averaged. Model validity was considered high when
the misclassification rates were similar before and
after cross-validation. The accuracies of the CART
models were evaluated using the AUROC developed
from each method. The maximum Youden index
(sensitivity + specificity − 1) was defined as the
optimal cut-off point. All statistical analyses were
performed using SPSS (Windows version 23.0;
IBM Corp, Armonk [NY], United States) and the
significance level was set at 5%.
Sample size
Sample size calculations were conducted using
MedCalc statistical software, version 19.2 (MedCalc
Software bvba, Ostend, Belgium). Before plotting
an AUROC, the following values were established:
statistical significance (P<0.05), alpha (0.05),
statistical power (0.80), and the AUROC value
to be included in the null hypothesis (0.5). The
AUROC could distinguish between non-predictive
(AUROC<0.5), less predictive (0.5<AUROC^lt;0.7),
moderately predictive (0.7<AUROC<0.9), highly
predictive (0.9<AUROC<1), and perfectly predictive
(AUROC=1).34 In this study, an AUROC value of
0.7 was considered indicative of superior statistical
discrimination. The frailty improvement ratio (ie,
positive/negative ratio) considerably varied among
previous studies.35 36 37 Therefore, the positive/negative
ratio used here was set at 1:1-5. Moreover, a large
sample size was needed to allow for the possibility
of stratified analysis. Thus, 62 to 120 patients with
frailty were required: 20-31 and 31-100 in the
improved and non-improved groups, respectively.
Results
Figure 1 shows the flowchart of patient recruitment.
Among the 30 patients with pre-frailty, two with
severe dementia were excluded; 28 patients were
included in the analysis. Among the 161 patients
with frailty, five with severe dementia were excluded;
156 patients were included in the analysis. The
patient characteristics are summarised in Tables 1 and 2 (patients with pre-frailty and patients with frailty, respectively).
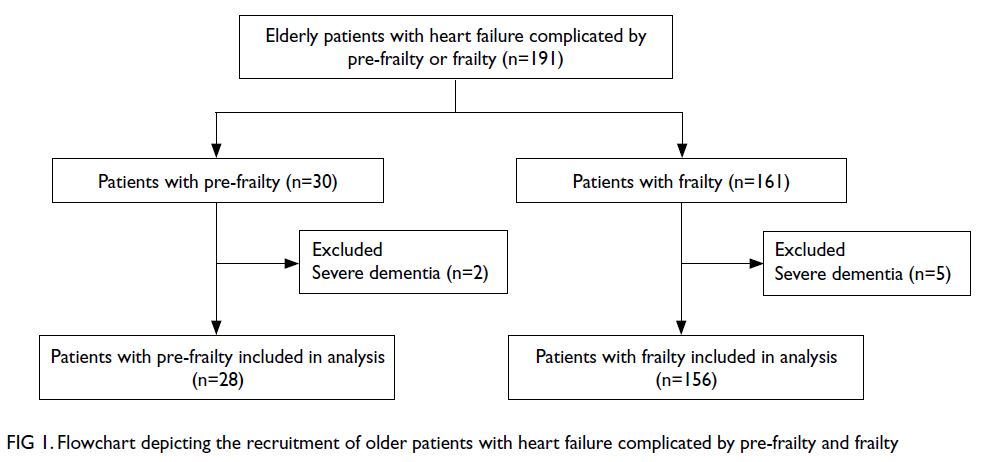
Figure 1. Flowchart depicting the recruitment of older patients with heart failure complicated by pre-frailty and frailty
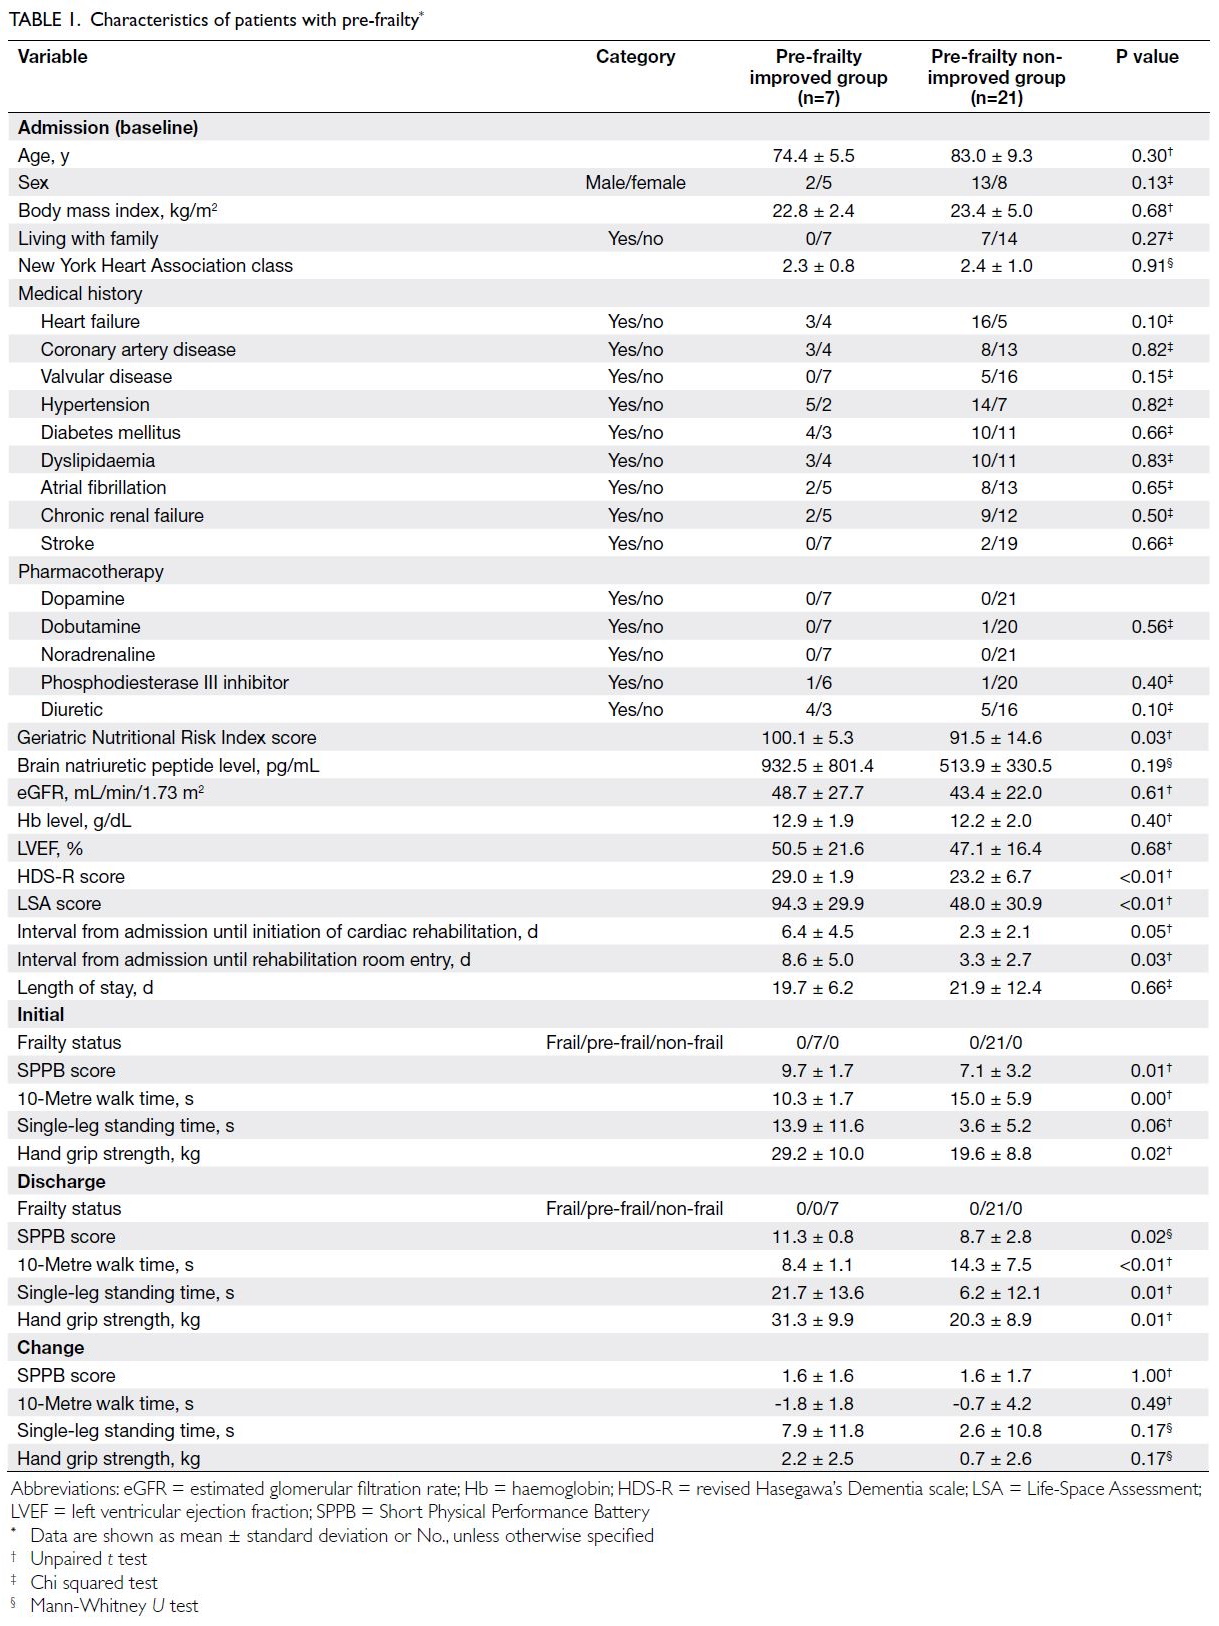
Table 1. Characteristics of patients with pre-frailty
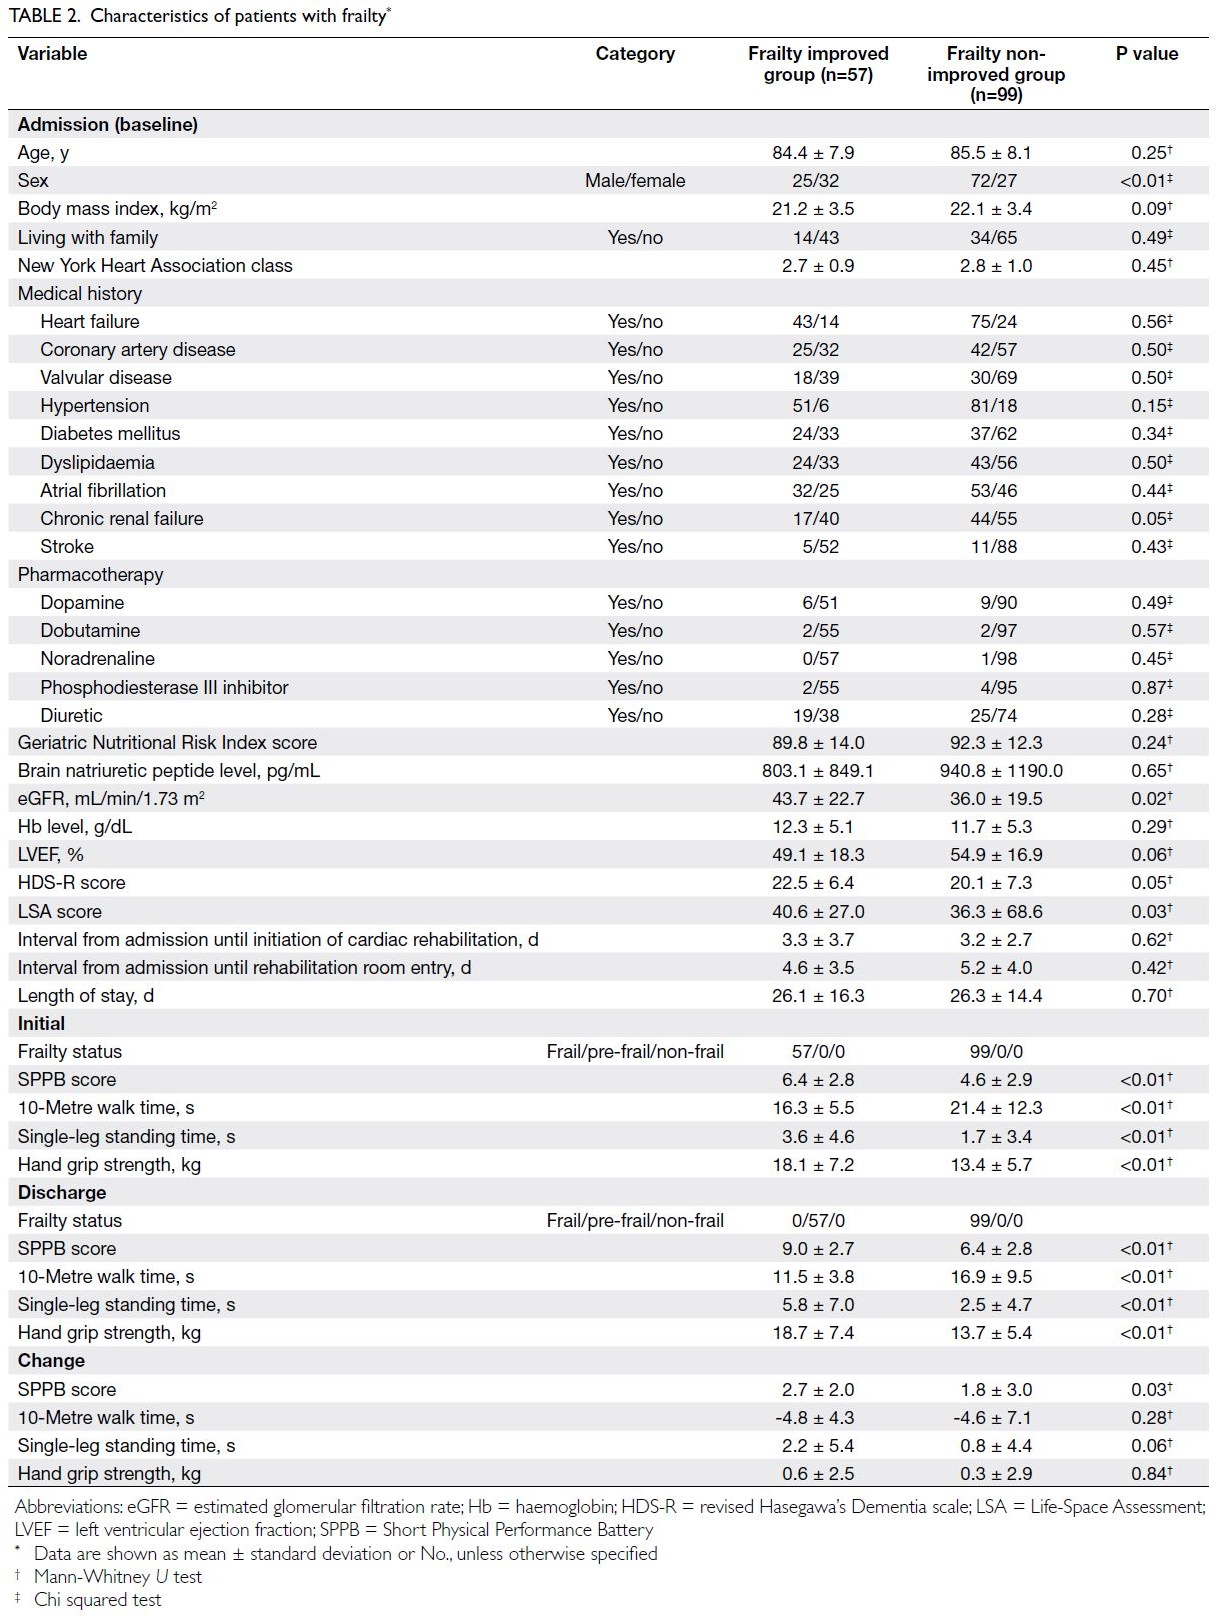
Table 2. Characteristics of patients with frailty
Figure 2 shows CART model A, which
predicted the presence or absence of pre-frailty
improvement during hospitalisation. Among the
28 patients with pre-frailty, seven experienced
improvements. Single-leg standing time at admission
was identified as the best single discriminator for
pre-frailty improvement (≤4.4 or >4.4 s). Among
patients with single-leg standing time of >4.4 s at admission, the next predictor was LVEF (≤36.8%
or >36.8%). Our CART analysis resulted in the
establishment of three terminal nodes. The terminal
node with the highest probability of a favourable
outcome (pre-frailty improvement) was defined as
rank 1, whereas the terminal node with the lowest
probability of a favourable outcome was defined
as rank 3. Based on the AUROC (95% confidence
interval [CI]), this CART model had an accuracy
of 0.96 (95% CI=0.89-1.00), with an optimal cut-off
point of rank 1 (sensitivity: 85.7%, specificity: 95.2%,
PLR: 18.0, and NLR: 0.15). The misclassification
rates before and after cross-validation were 7.1% and
28.6%, respectively.
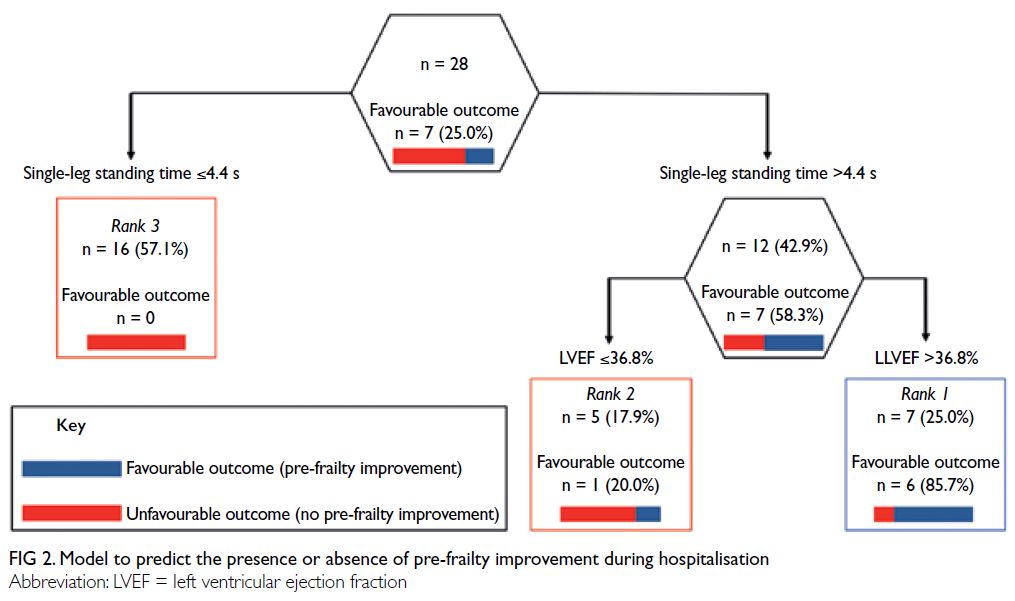
Figure 2. Model to predict the presence or absence of pre-frailty improvement during hospitalisation
Figure 3 shows CART model B, which predicted
the presence or absence of frailty improvement
during hospitalisation. Among the 156 patients with
frailty, 57 experienced improvements. Hand grip
strength at admission was identified as the best single
discriminator for frailty improvement (≤16.8 or
>16.8 kg). Among patients with hand grip strength of
>16.8 kg at admission, the next predictor was eGFR
(≤27.0 or >27.0 mL/min/1.73 m2). Among patients with
hand grip strength of ≤16.8 kg at admission, the next
predictor was eGFR (≤83.5 or >83.5 mL/min/1.73 m2).
Among patients with eGFR ≤83.5 mL/min/1.73 m2,
the next predictor was Hb level (≤14.3 or >14.3 g/dL).
Among patients with Hb level ≤14.3 g/dL, the next
predictor was change in single-leg standing time
(≤4.9 or >4.9 s). Our CART analysis resulted in the
establishment of six terminal nodes. The terminal
node with the highest probability of a favourable
outcome (frailty improvement) was defined as
rank 1, whereas the terminal node with the lowest
probability of a favourable outcome was defined as
rank 6. Based on the AUROC (95% CI), this CART
model had an accuracy of 0.84 (95% CI=0.78-0.91), with an optimal cut-off point of rank 4 (sensitivity:
70.1%, specificity: 86.9%, PLR: 5.3, and NLR: 0.3).
The misclassification rates before and after cross-validation
were 19.2% and 35.3%, respectively.
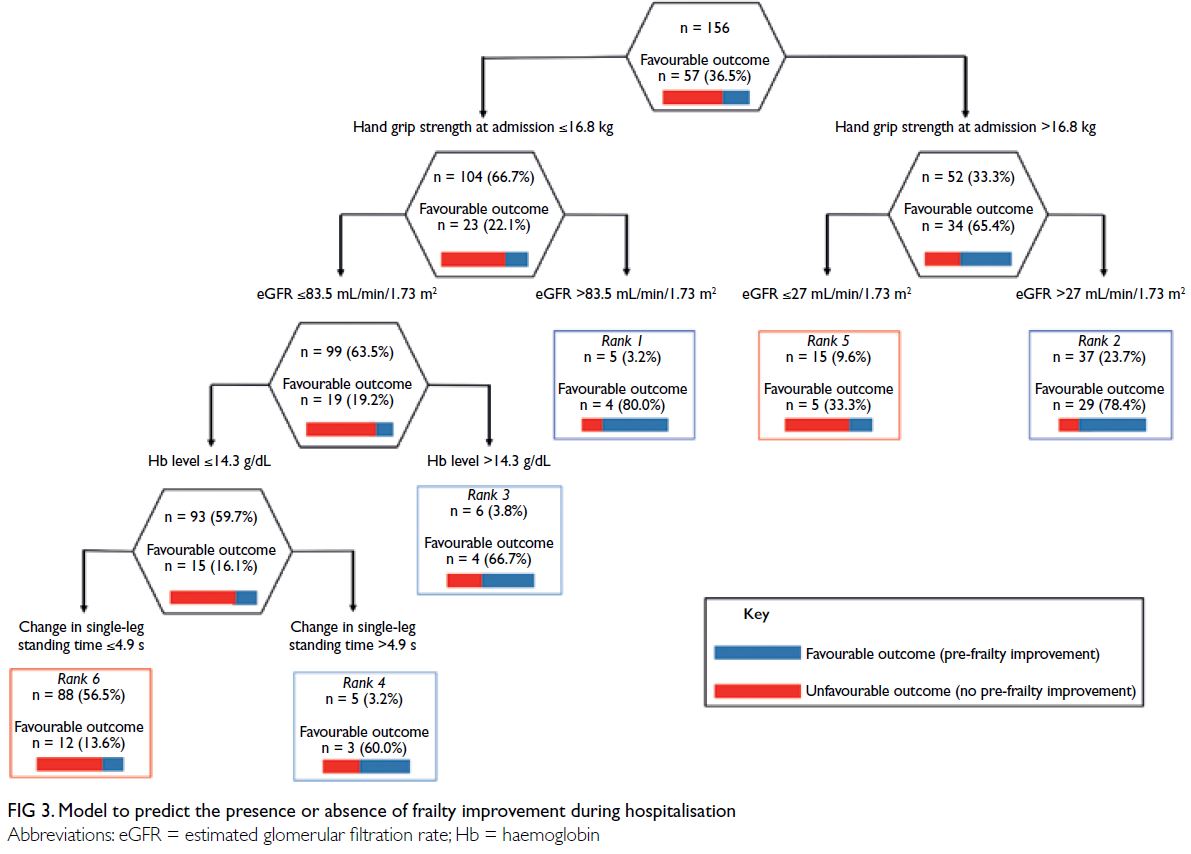
Figure 3. Model to predict the presence or absence of frailty improvement during hospitalisation
Discussion
Model A predicted pre-frailty improvement with
high accuracy; it identified single-leg standing time
at admission as the best predictor, followed by
LVEF. Notably, changes in physical function during
hospitalisation were not identified as predictors.
These results suggest that conditions at admission
strongly influence pre-frailty improvement during
hospitalisation; moreover, improvement can be
expected among patients with good physical
function (single-leg standing time >4.4 s) and
cardiac function (LVEF >36.8%) at admission. To our
knowledge, no study has examined the factors that
influence pre-frailty improvement among patients
with heart failure. However, one study found that
physical function, nutrition, and quality of life were
factors that influenced pre-frailty improvement
among community-dwelling older individuals.12
The above findings suggest that although physical
function is a common factor that influences pre-frailty
improvement among older patients with heart
failure and community-dwelling older individuals,
cardiac function specifically influences pre-frailty
improvement among patients with heart failure.
Model B predicted frailty improvement with
moderate accuracy; it identified hand grip strength
at admission as the best predictor, followed by eGFR,
Hb level, and change in single-leg standing time
during hospitalisation. Thus, frailty improvement
can be expected among patients with good hand
grip strength and/or renal function at admission. However, the cut-off values for eGFR, an index
of renal function, considerably differed between
patients with good (>16.8 kg) and poor (≤16.8 kg)
hand grip strength (27 and 83.5 mL/min/1.73 m2,
respectively). A previous study also showed that
older patients with heart failure who had higher
hand grip strength were more likely to experience
frailty improvement.10 Although no association has
been identified between renal function and frailty,
renal function is known to influence improvements
in exercise capacity among patients with heart
failure.38 Moreover, our results showed that, despite
the presence of poor physical and renal function at
admission, patients with a high Hb level (>14.3 g/dL)
were likely to improve from frailty. Although there
is no published literature concerning an association
between Hb level and frailty, a low Hb level has
been shown to cause fatigability,39 40 which is one
of the criteria for assessing frailty using the CHS.
Furthermore, the Hb level reportedly influences
improvements in exercise capacity among patients
with heart failure.38
Despite poor hand grip strength, weak renal
function, and a low Hb level at admission, frailty
improvement was observed in most patients whose
single-leg standing time during hospitalisation was
>4.9 s. In previous studies that sought to predict
frailty improvement among older patients with heart
failure, investigators mostly focused on conditions
at admission without considering changes during
hospitalisation.41 The present results indicate that,
despite the presence of poor conditions at admission, patients can recover from frailty by improving
physical function during hospitalisation; therefore,
rehabilitation is essential during hospitalisation.
Resistance training is known to improve single-leg
standing time among older individuals.42 Thus,
we recommend cardiac rehabilitation, including
resistance training, to improve frailty among older
patients with heart failure.
The clinical implications of our findings are as follows. Thus far, no algorithms have been established
concerning pre-frailty and frailty improvements
in older patients with heart failure. Using the
CART method, we developed models that could
predict the prognosis of older patients with heart
failure complicated by pre-frailty and frailty. These
models will provide useful information for patients
and caregivers. Many of the factors extracted in
this study were only assessed at the time of initial
rehabilitation. Thus, the prognoses of patients with
pre-frailty and patients with frailty can be inferred
(to some extent) at the time of initial rehabilitation.
Additionally, an increase in single-leg standing time
during hospitalisation was associated with frailty
improvement. For older patients with heart failure
who show signs of frailty, interventions to increase
single-leg standing time may help to improve frailty.
The PLR and NLR were used to assess the diagnostic
performances of the CART models; these parameters
revealed that both model A (pre-frailty) and model B
(frailty) had good performance. However, our data
should be interpreted cautiously because of the
small number of patients with pre-frailty.
There were several notable weaknesses and
limitations in this study. First, the sample size
was limited; the numbers of patients with pre-frailty
and frailty were 28 and 156, respectively.
Therefore, this study should be regarded as a pilot
prospective cohort study. Despite the moderate to
high accuracies of models A and B, more large-scale
studies are needed to enhance the generalisability
of our results. Second, three aspects of frailty exist,
namely physical, social, and mental frailty; mental
frailty was not considered in this study. A previous
study reported that patients with multifaceted
frailty, including physical, mental, and social frailty,
had worse prognoses compared with patients who
had physical frailty alone.5 Therefore, additional
studies are needed to develop models that predict
improvements in multifaceted frailty, including
mental frailty. Third, interventions were customised
for each patient; they were not uniform. However,
physical therapists in both study hospitals received
2 weeks of training in cardiac rehabilitation, and the
methods of cardiac rehabilitation were standardised as much as possible. Fourth, we used the J-CHS to
measure frailty; the use of this tool to assess patients
with heart failure is potentially controversial. The
J-CHS was developed for older adults and has
been used in multiple studies.7 21 Additionally,
the reliability and validity of this tool have been
confirmed.21 We thus consider this use of the J-CHS
to be appropriate. Fifth, this study was performed in
an unblinded manner, and we could not completely
rule out the potential for bias. However, to reduce
the measurement bias, the first author (T Umehara)
was not involved in participant enrolment or data
collection. Sixth, a selection bias might have been
present because patients were only recruited at
two hospitals in Japan. Caution is needed when
generalising our results, particularly to patients in
other countries.
Conclusion
By using the CART method, we developed moderately to highly accurate prediction models for pre-frailty and frailty improvement among older patients with
heart failure. Model A, which predicted pre-frailty
improvement, showed that patients with good single-leg
standing time and cardiac function at admission
are likely to experience pre-frailty improvement.
Furthermore, Model B, which predicted frailty
improvement, showed that patients with good hand
grip strength, excellent renal function, and/or a high
Hb level at admission are likely to experience frailty
improvement. Notably, despite the presence of poor
conditions at admission, frailty improvement may
occur in patients who show improvement in single-leg
standing time during hospitalisation. Overall, our
results suggest that cardiac rehabilitation to prolong
single-leg standing time is necessary to improve
frailty, particularly when conditions at admission are
poor.
Author contributions
Concept or design: All authors.
Acquisition of data: T Umehara and N Katayama.
Analysis or interpretation of data: T Umehara, M Tsunematsu, M Kakehashi.
Drafting of the manuscript: T Umehara, A Kaneguchi and Y Iwamoto.
Critical revision of the manuscript for important intellectual content: T Umehara, A Kaneguchi, Y Iwamoto.
Acquisition of data: T Umehara and N Katayama.
Analysis or interpretation of data: T Umehara, M Tsunematsu, M Kakehashi.
Drafting of the manuscript: T Umehara, A Kaneguchi and Y Iwamoto.
Critical revision of the manuscript for important intellectual content: T Umehara, A Kaneguchi, Y Iwamoto.
All authors had full access to the data, contributed to the study, approved the final version for publication, and take responsibility for its accuracy and integrity.
Conflicts of interest
All authors have disclosed no conflicts of interest.
Acknowledgement
We thank Y Yamamoto, M Ota, Y Nakashima, W Kawakami,
and M Iwanaga (Kure Kyosai Hospital, Kure, Japan), as well
as S Nagao, Y Kawabata, and D Tomiyama (Saiseikai Kure
Hospital, Kure, Japan) for their support in data collection.
Funding/support
This research received no specific grant from any funding agency in the public, commercial, or not-for-profit sectors.
Ethics approval
The study was approved by the Ethics Committees of Saiseikai Kure Hospital (Ref 127) and Kure Kyosai Hospital (Ref 31-17). Patients provided written informed consent to participate.
References
1. Bleumink GS, Knetsch AM, Sturkenboom MC, et al.
Quantifying the heart failure epidemic: prevalence,
incidence rate, lifetime risk and prognosis of heart failure
The Rotterdam Study. Eur Heart J 2004;25:1614-9. Crossref
2. Smart N, Marwick TH. Exercise training for patients with
heart failure: a systematic review of factors that improve
mortality and morbidity. Am J Med 2004;116:693-706. Crossref
3. Joyce E. Frailty in advanced heart failure. Heart Fail Clin 2016;12:363-74. Crossref
4. Newman AB, Gottdiener JS, Mcburnie MA, et al. Associations of subclinical cardiovascular disease with
frailty. J Gerontol A Biol Sci Med Sci 2001;56:158-66. Crossref
5. Rodríguez-Pascual C, Paredes-Galán E, Ferrero-Martínez AI,
et al. The frailty syndrome is associated with adverse health
outcomes in very old patients with stable heart failure: A
prospective study in six Spanish hospitals. Int J Cardiol
2017;236:296-303. Crossref
6. Denfeld QE, Winters-Stone K, Mudd JO, Hiatt SO,
Chien CV, Lee CS. Frequency of and significance of
physical frailty in patients with heart failure. Am J Cardiol
2017;8:1243-9. Crossref
7. Kojima G, Taniguchi Y, Iliffe S, Jivraj S, Walters K.
Transitions between frailty states among community-dwelling
older people: A systematic review and meta-analysis.
Ageing Res Rev 2019;50:81-8. Crossref
8. Takabayashi K, Ikuta A, Okazaki Y, et al. Clinical
characteristics and social frailty of super-elderly patients
with heart failure—the Kitakawachi clinical background
and outcome of heart failure registry. Circ J 2016;81:69-76. Crossref
9. Sze S, Zhang J, Pellicori P, Morgan D, Hoye A, Clark AL.
Prognostic value of simple frailty and malnutrition
screening tools in patients with acute heart failure due
to left ventricular systolic dysfunction. Clin Res Cardiol
2017;106:533-41. Crossref
10. Bekfani T, Pellicori P, Morris DA, et al. Sarcopenia in
patients with heart failure with preserved ejection fraction:
impact on muscle strength, exercise capacity and quality of
life. Int J Cardiol 2016;222:41-6. Crossref
11. Umehara T, Tanaka R, Tsunematsu M, et al. Can the
amount of interventions during the convalescent phase
predict the achievement of independence in activities of
daily living in patients with stroke? A retrospective cohort
study. J Stroke Cerebrovasc Dis 2018; 27:2436-44. Crossref
12. Gené Huguet L, Navarro González M, Kostov B, et al. Pre
Frail 80: multifactorial intervention to prevent progression
of pre-frailty to frailty in the elderly. J Nutr Health Aging
2018;22:1266-74. Crossref
13. McGinn TG, Guyatt GH, Wyer PC, Naylor CD, Stiell IG,
Richardson WS. Users’ guides to the medical literature:
XXII: how to use articles about clinical decision rules.
Evidence-Based Medicine Working Group. JAMA
2000;284:79-84. Crossref
14. Fonarow GC, Adams KF Jr, Abraham WT, Yancy CW,
Boscardin WJ, ADHERE Scientific Advisory Committee,
Study Group, and Investigators. Risk stratification for
in-hospital mortality in acutely decompensated heart
failure: classification and regression tree analysis. JAMA
2005;293:572-80. Crossref
15. Arenja N, Breidthardt T, Socrates T, et al. Risk stratification
for 1-year mortality in acute heart failure: classification and
regression tree analysis. Swiss Med Wkly 2011;141:w13259. Crossref
16. Imai Y, Hasegawa K. The revised Hasegawa’s Dementia
Scale (HDS-R)—Evaluation of its usefulness as a screening
test for dementia. J Hong Kong Coll Psychiatr 1994;4:20-4.
17. Baker PS, Bodner EV, Allman RM. Measuring life-space mobility in community-dwelling older adults. J Am Geriatr Soc 2003;51:1610-4. Crossref
18. Fried LP, Tangen CM, Walston J, et al. Frailty in older
adults: evidence for a phenotype. J Gerontol A Biol Sci
Med Sci 2001;56:146-56. Crossref
19. Mitnitski AB, Mogilner AJ, Rockwood K. Accumulation of deficits as a proxy measure of aging. ScientificWorldJournal 2001;1:323-36. Crossref
20. Satake S, Arai H. The revised Japanese version of the Cardiovascular Health Study criteria (revised J-CHS criteria). Geriatr Gerontol Int 2020;20:992-3. Crossref
21. Makizako H, Shimada H, Doi T, Tsutsumimoto K, Suzuki T.
Impact of physical frailty on disability in community-dwelling
older adults: a prospective cohort study. BMJ
Open 2015;5:e008462. Crossref
22. Satake S, Shimada H, Yamada M, et al. Prevalence of frailty
among community-dwellers and outpatients in Japan
as defined by the Japanese version of the Cardiovascular
Health Study criteria. Geriatr Gerontol Int 2017;17:2629-34. Crossref
23. Bernabeu-Mora R, Medina-Mirapeix F, Llamazares-Herrán E, García-Guillamón G, Giménez-Giménez LM,
Sánchez-Nieto JM. The Short Physical Performance
Battery is a discriminative tool for identifying patients with
COPD at risk of disability. Int J Chron Obstruct Pulmon
Dis 2015;10:2619-26. Crossref
24. Guralnik JM, Simonsick EM, Ferrucci L, et al. A short
physical performance battery assessing lower extremity
function: association with self-reported disability and
prediction of mortality and nursing home admission. J
Gerontol 1994;49:85-94. Crossref
25. Bohannon RW. Comfortable and maximum walking
speed of adults aged 20-79 years: reference values and
determinants. Age Ageing 1997;26:15-9. Crossref
26. van Hedel HJ, Wirz M, Dietz V. Assessing walking ability in
subjects with spinal cord injury: validity and reliability of 3
walking tests. Arch Phys Med Rehabil 2005;86:190-6. Crossref
27. Michikawa T, Nishiwaki Y, Takebayashi T, Toyama Y. One-leg standing test for elderly populations. J Orthop Sci 2009;14:675-85. Crossref
28. Huang C, Niu K, Kobayashi Y et al. An inverted J-shaped association of serum uric acid with muscle strength among Japanese adult men: a cross-sectional study. BMC
Musculoskelet Disord 2013;14:258. Crossref
29. Breiman L, Friedman J, Olshen R, Stone C. Classification and Regression Tree Analysis. Boston University; 2014: 1-16.
30. Aguiar FS, Almeida LL, Ruffino-Netto A, Kritski AL, Mello FC, Werneck GL. Classification and regression tree (CART) model to predict pulmonary tuberculosis in hospitalized patients. BMC Pulm Med 2012;12:40.Crossref
31. Takahashi O, Cook EF, Nakamura T, Saito J, Ikawa F, Fukui T. Risk stratification for in-hospital mortality in spontaneous intracerebral haemorrhage: a Classification
and Regression Tree analysis. QJM 2006;99:743-50. Crossref
32. Westreich D, Lessler J, Funk MJ. Propensity score estimation: neural networks, support vector machines,
decision trees (CART), and meta-classifiers as alternatives
to logistic regression. J Clin Epidemiol 2010;63:826-33. Crossref
33. DeLong ER, DeLong DM, Clarke-Pearson DL. Comparing the areas under two or more correlated receiver operating characteristic curves: a nonparametric approach.
Biometrics 1988;44:837-45. Crossref
34. Swets JA. Measuring the accuracy of diagnostic systems. Science 1988;240:1285-93. Crossref
35. Espinoza SE, Jung I, Hazuda H. Lower frailty incidence
in older Mexican Americans than in older European
Americans: the San Antonio Longitudinal Study of Aging.
J Am Geriatr Soc 2010;58:2142-8. Crossref
36. Schuurmans H, Steverink N, Lindenberg S, Frieswijk N,
Slaets JP. Old or frail: what tells us more? J Gerontol A Biol
Sci Med Sci 2004;59:962-5. Crossref
37. Collard RM, Boter H, Schoevers RA, Oude Voshaar RC.
Prevalence of frailty in community-dwelling older persons:
a systematic review. J Am Geriatr Soc 2012;60:1487-92. Crossref
38. Silverberg DS, Wexler D, Blum M, Iaina A. The cardio
renal anemia syndrome: correcting anemia in patients
with resistant congestive heart failure can improve both
cardiac and renal function and reduce hospitalizations.
Clin Nephrol 2003;60 Suppl 1:S93-102.
39. Roy CN. Anemia in frailty. Clin Geriatr Med 2011;27:67-78. Crossref
40. Chaves PH, Ashar B, Guralnik JM, Fried LP. Looking at
the relationship between hemoglobin concentration and
prevalent mobility difficulty in older women. Should the
criteria currently used to define anemia in older people be
reevaluated? J Am Geriatr Soc 2002;50:1257-64. Crossref
41. Reeves GR, Whellan DJ, O’Connor CM, et al. A novel
rehabilitation intervention for older patients with
acute decompensated heart failure: The REHAB-HF pilot
study. JACC Heart Fail 2017;5:359-66. Crossref
42. Gonzalez AM, Mangine GT, Fragala MS, et al. Resistance
training improves single leg stance performance in older
adults. Aging Clin Exp Res 2014;26:89-92. Crossref