Hong
Kong Med J 2019 Aug;25(4):295–304 | Epub 12 Aug 2019
© Hong Kong Academy of Medicine. CC BY-NC-ND 4.0
ORIGINAL ARTICLE
Survey on common reference intervals for general
chemistry analytes in Hong Kong
Toby CH Chan, MB, BS1,2; Chloe M Mak,
PhD, MD1,2; Sammy PL Chen, FRCPA, FHKAM (Pathology)2,3;
MT Leung, MB, BS3; HN Cheung, MB, ChB, MRCP (UK)3;
Daniel CW Leung, MSc2; HK Lee, MSc, PhD4; Eleanor C
Koo, MSc5; YC Lo, MSc6
1 Chemical Pathology Laboratory,
Department of Pathology, Hong Kong Children’s Hospital, Kowloon Bay, Hong
Kong
2 Chemical Pathology Laboratory,
Department of Pathology, Princess Margaret Hospital, Laichikok, Hong Kong
3 Chemical Pathology Laboratory,
Department of Pathology, Queen Elizabeth Hospital, Jordan,
Hong Kong
4 Chemical Pathology Laboratory,
Department of Pathology, Tuen Mun Hospital, Tuen Mun, Hong Kong
5 Clinical Pathology Laboratory,
Grantham Hospital, Wong Chuk Hang, Hong Kong
6 Chemical Pathology Laboratory,
Department of Pathology, Pamela Youde Nethersole Eastern Hospital, Chai
Wan, Hong Kong
Corresponding author: Dr Chloe M Mak (makm@ha.org.hk)
 Full
paper in PDF
Full
paper in PDF
Abstract
Introduction: Reference
intervals (RIs) are essential tool for proper interpretation of results.
There is a global trend towards implementing common RIs to avoid
confusion and enhance patient management across different laboratories.
However, local practices with respect to RIs lack harmonisation.
Methods: We have conducted the
first local survey regarding RIs for 14 general chemistry analytes in 10
chemical pathology laboratories that employ four different analytical
platforms (Abbott Architect, Beckman Coulter AU, Roche Cobas, and
Siemens Dimension EXL). Analytical bias was assessed by an
inter-laboratory results comparison of external quality assurance
programmes.
Results: Sufficient
inter-laboratory and inter-platform agreement regarding the 10 analytes
(albumin, alanine aminotransferase, aspartate aminotransferase,
chloride, gamma-glutamyl transferase, phosphate, potassium, sodium,
total protein, and urea) were demonstrated. However, the RIs were
heterogeneous across all laboratories, with percentage differences of
the upper RI value of up to 47% for aspartate aminotransferase (absolute
difference of 16 U/L), 29% for urea (1.8 mmol/L), and 18% for potassium
(0.8 mmol/L). The percentage difference between lower RI values was up
to 24% for urea (0.6 mmol/L), 22% for phosphate (0.16 mmol/L), and 8%
for total protein (5 g/L). The coefficients of variation of the upper RI
values of potassium and sodium were 1.2 times and 1.0 times of their
corresponding between-subject biological variation, respectively,
representing unnecessary variations that are overlooked and unchecked in
current practice.
Conclusions: We recommend the
use of common RIs for general chemistry analytes in Hong Kong to prevent
interpreter confusion, improve electronic data transfer, and unite
laboratory practice. This is the first local study on this topic, and
our data can lay the groundwork for increasing harmonisation of RIs
across more laboratory tests.
New knowledge added by this study
- Reference intervals (RIs) of general chemistry analytes are highly variable.
- Ten analytes (albumin, alanine aminotransferase, aspartate aminotransferase, chloride, gamma-glutamyl transferase, phosphate, potassium, sodium, total protein, and urea) show satisfactory inter-laboratory and inter-platform agreement.
- Implementation of common RIs is feasible.
- We recommend the use of common RIs in Hong Kong for general chemistry analytes to reduce redundant variation across laboratories.
- This is the first local study on this topic, and our data can lay the groundwork for increasing harmonisation of RIs across more laboratory tests.
Introduction
Reference intervals (RIs) are an indispensable tool
for clinical decision making in the interpretation of numerical pathology
results. Simple yet elegant comparisons with reference subjects empower
the interpreter with objective judgements and aid clinicians in diagnosis,
treatment, monitoring, prognostication, and screening.1
Reference intervals are commonly defined as
limiting values, usually upper and lower limits, between which a
prespecified percentage (usually 95%) of results would fall.2 3 In daily
practice, for most tests, there exists some degree of laboratory-specific
bias related to differences in pre-analytical and analytical factors, such
as the choices of analytical platform, methodology, and reagent.
Therefore, it is desirable for laboratories to provide sets of
laboratory-specific RIs following Clinical and Laboratory Standards
Institute guideline C28-A3c. A laboratory may establish a new set of RIs
by conducting an RI study with at least 120 reference individuals from
each subgroup stratified by sex, age, and other parameters as appropriate.2 Conducting an RI study is
challenging, as enormous efforts of human and financial resources are
needed. As the list of analytes is long, it is almost impossible for every
laboratory to repeat an RI study to accommodate future changes in
methodology or analytical platforms.2
4 Alternatively, a laboratory may
adopt the RIs established by other sources such as manufacturers or the
literature and validate them with at least 20 reference individuals’
results. An additional option is for the laboratory to transfer previously
established RIs according to mathematical formulas to account for
differences in analytical factors.2
These methods ensure that each laboratory provides a set of clinically
meaningful intervals to clinicians, aiding their management.
Therefore, for the same analyte, it is not uncommon
to see different RIs across laboratories. This inter-laboratory
coefficient of variation was reported by Ceriotti et al3 to be as high as 15% to 20% for the RIs of urea and
creatinine. This could be reasonable for hormonal tests that are not
optimally standardised, as demonstrated by the marked variations in RIs
for thyroid hormones between four analytical platforms shown by a recent
study in the UK.5 For analytes that
are generally well standardised across platforms, such as plasma
electrolytes, one would expect results generated by different laboratories
to be comparable. Logically, with insignificant methodological bias, the
RIs should be same for the specified homogenous population.
In 2007, the UK Pathology Harmony Group showed that
laboratories were using different sets of Rls with no sound scientific
basis despite using the same analytical platform and reagents.6 7 The same
problem was later also revealed by a survey on RIs in Australasia.8 The differences in RIs were concluded to be unnecessary
and would have created unneeded confusion during interpretation, which
might lead to inappropriate investigations or treatments.9 10 Common RIs
were offered as a solution to unite laboratory practices.4
In Hong Kong, we have observed a general trend of
variation in RIs that resembles those in the UK and Australasia, with
various RIs adopted for most tests, including general chemistry laboratory
tests. Hence, we conducted the first local study to explore the situation
with a territory-wide survey on RIs. The aim was to scientifically review
the analytical variation of general chemistry laboratory tests between
local laboratories and to examine the evidence for such variations.
Methods
Fourteen blood general chemistry analytes were
included in this study, namely albumin, alanine aminotransferase (ALT),
aspartate aminotransferase (AST), alkaline phosphatase (ALP), total
bilirubin, calcium, chloride, creatinine, gamma-glutamyl transferase
(GGT), phosphate, potassium, sodium, total protein, and urea. We conducted
a territory-wide survey involving 10 chemical pathology laboratories. All
laboratories provided routine services to assess the 14 analytes, except
for AST, chloride, and GGT, which were not evaluated in three
laboratories. The instruments were Abbott Architect (labs 1-3), Beckman
Coulter AU (labs 4-5), Roche Cobas (labs 6-9), and Siemens Dimension EXL
(lab 10). Table 1 summarises the analytical platforms and
methodologies.
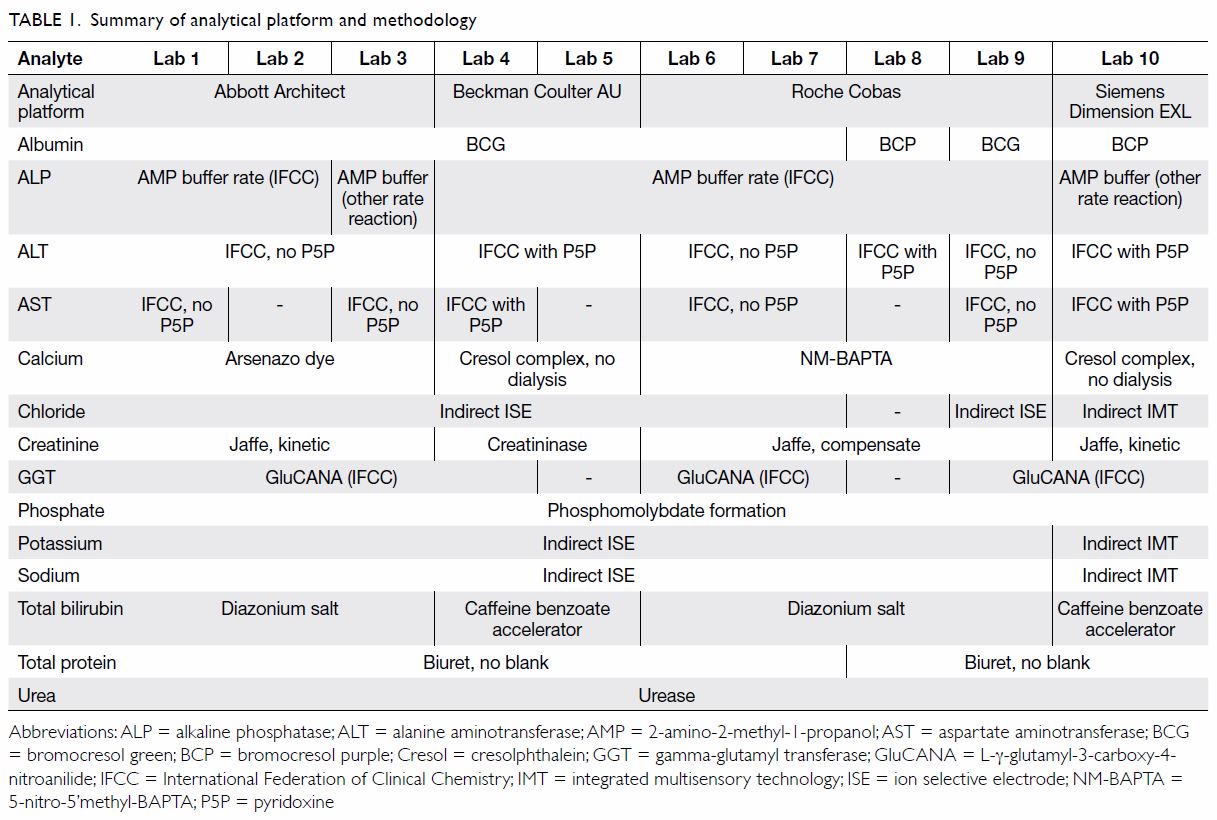
Table 1. Summary of analytical platform and methodology
The laboratories participated in the Condensed
General Chemistry Programme provided by the Royal College of Pathologists
of Australasia Quality Assurance Programs. In each cycle of the external
quality assurance programme (EQAP), identical sets of QAP materials were
analysed by each individual laboratory for the aforementioned blood
general chemistry analytes using their own analytical platform. The use of
QAP materials, which were commutable samples with the same properties as
routinely analysed clinical samples, minimises the matrix effect. In
routine clinical practice, EQAP safeguards laboratory performance by
comparison with peers and reference methods. In the present study, we
retrospectively review these readily available EQAP data from local
laboratories for bias assessments. The participants provided their
responses by email to the following items: (1) historical EQAP results of
six cycles (105-11, 105-12, 105-15, 105-16, 106-03, and 106-04); (2) adult
RIs in use for clinical service, and (3) analytical specification of
assays.
Laboratory performance bias was assessed by
percentage differences of EQAP results. Percentage difference was defined
as the laboratory result minus the target value divided by the target
value. The feasibility of applying common RIs among the laboratories was
determined by the degree of agreement between the percentage differences
and the corresponding allowable limits of performance.11 Data analyses were performed using Microsoft Excel
2016.
Results
Figure 1 shows that half of the 14 analytes showed
agreement across all laboratories. The inter-laboratory differences are
within the corresponding target allowable limit of error (ALE) for AST
(-3% to +9%; target ALE ±12%), chloride (-1% to +2%; ±3%), phosphate (-1%
to 4%; ±8%), potassium (-2% to 3%; ±5%), sodium (-1% to 2%; ±2%). Three
other analytes (albumin, ALT, and GGT) also showed agreement across nine
laboratories with the Abbott, Beckman, and Roche platforms, except Siemens
which was only used by one laboratory.
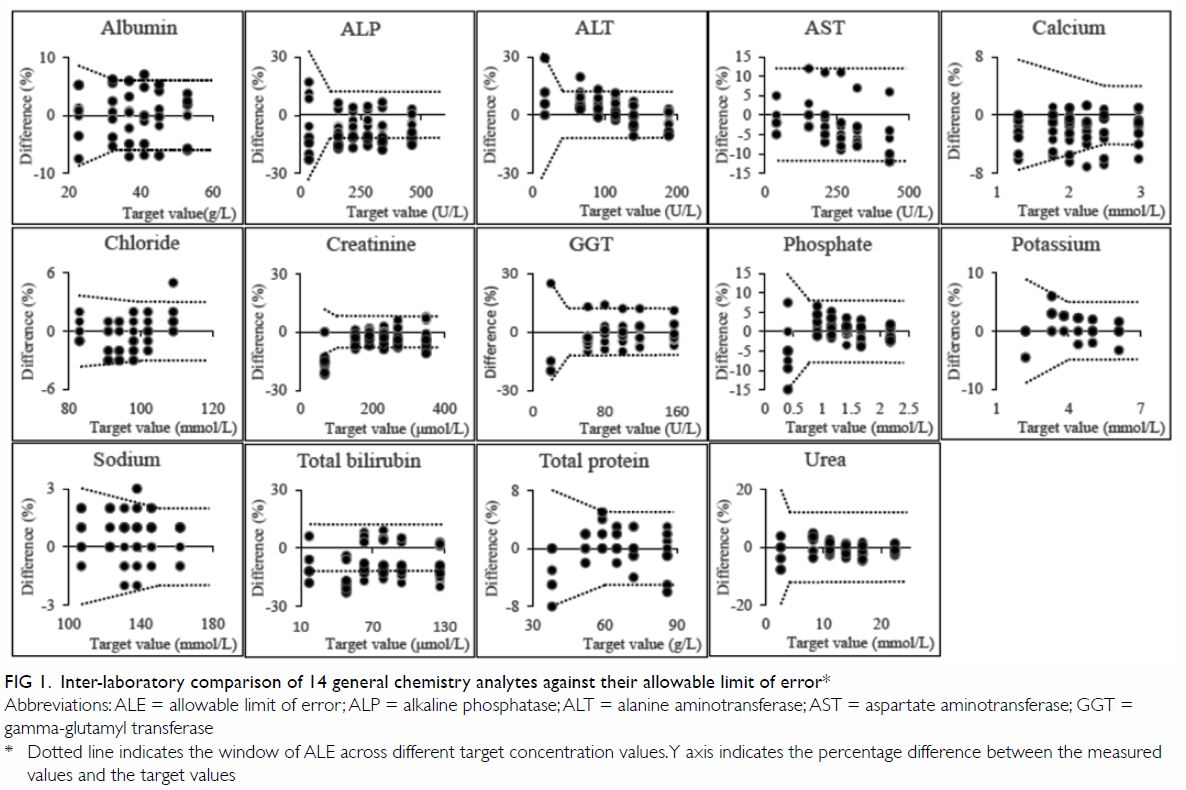
Figure 1. Inter-laboratory comparison of 14 general chemistry analytes against their allowable limit of error
Figure 2 shows the inter-laboratory comparison of
RIs for the 14 general chemistry analytes. Laboratories using the same
platform generally adopted the same RIs, except for one laboratory using
the Roche platform.
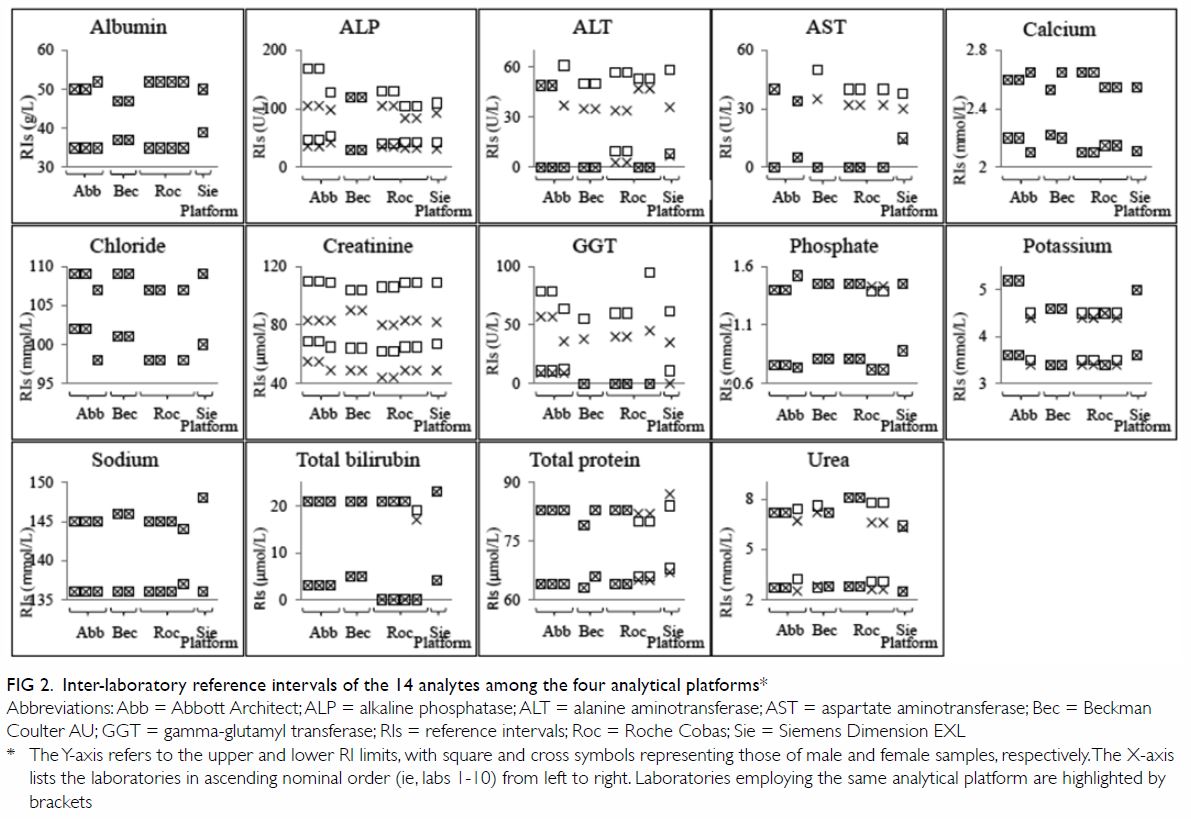
Figure 2. Inter-laboratory reference intervals of the 14 analytes among the four analytical platforms
Notably, for the seven analytes mentioned above
that showed agreement within the target ALE, the RIs differed
substantially across the 10 laboratories. Particularly, the upper RI limit
ranged from 34 to 50 U/L (coefficient of variation [CV]: 11%): in male
samples and 30 to 40 U/L (9%) in female samples in AST; 107 to 109 mmol/L
(0.9%) in chloride; 1.39 to 1.52 mmol/L (2.7%) in phosphate; 4.4 to 5.2
mmol/L (6.7%) in potassium; 144 to 148 mmol/L (0.7%) in sodium; 79 to 87
g/L (2.2%) in total protein; and 6.3 to 8.1 mmol/L (8.1%) in urea. The
lower RIs ranged from 98 to 102 mmol/L (1.7%) in chloride; 0.72 to 0.88
mmol/L (6.2%) in phosphate; 3.4 to 3.6 mmol/L (2.6%) in potassium; 136 to
137 mmol/L (0.2%) in sodium; 63 to 68 g/L (2.2%) in total protein; and 2.5
to 3.1 mmol/L (7.4%) in urea.
The remaining analytes (albumin, ALT, ALP, calcium,
creatinine, GGT, and total bilirubin) demonstrated substantial
platform-specific bias exceeding the target ALE. High bias exceeding the
ALE was observed for ALT (+12% to +20%; target ALE ±12%) and GGT (+11% to
+14%; ±12%), with negative bias exceeding the ALE in albumin (-5.3% to
-7.1%; ±6%), ALP (-11.4% to -15.3%; ±12%), and calcium (-5.6% to -7.1%;
±4%) present on the Siemens platform. Negative bias exceeding the ALE in
ALP (-12.2% to -14.8%; ±12%) was also detected on the Roche platform. For
calcium, negative bias exceeding the ALE (-4% to -6%; ±4%) was also
detected at one laboratory using the Beckman platform. For creatinine, all
laboratories were in agreement about concentrations ranging from 152 to
349 μmol/L. However, significant negative bias (-13% to -22%; ±12%) was
observed for creatinine levels at the target value of 67 μmol/L on the
Abbott, Siemens, and Roche instruments. For total bilirubin, half of the
laboratories showed agreement within the ALE, while the remaining
laboratories had significant negative bias (-14% to 17%; ±12%).
The investigated laboratories used different RIs
despite employing the same analytical platforms, methods and reagents, for
11 out of the 14 analytes among those using the Abbott platform (labs
1-3), 11 out of 14 of analytes among those using Roche platforms (labs
6-9), and three out of the 14 of analytes among those using the Beckman
platforms (labs 4-5).
Sex-specific RIs were not consistently provided for
eight analytes (ALP, ALT, AST, phosphate, potassium, total bilirubin,
total protein, and urea). For instance, sex-specific RIs were not provided
by two laboratories for ALP, two for ALT, two for AST, five for potassium,
five for urea, seven for total protein, eight for phosphate, and nine for
total bilirubin.
Discussion
Reference intervals are provided by laboratories as
interpretative tools to aid clinical decision making. Theoretically, RIs
could be affected by patient factors (eg, sex, age, ethnicity, biological
variability), pre-analytical and analytical factors (eg, choice of method,
reagents, platform, calibration), and statistical methodology.12 Therefore, for the same population, the RIs used for
a test are inevitably influenced by the bias of the laboratory assays. In
other words, RIs should theoretically be the same if the above-listed
factors do not introduce significant bias.
In local practice, 10 analytes surveyed
demonstrated sufficient agreement within the ALE between different
analytical platforms across laboratories (Fig 1: AST, chloride, phosphate, potassium, sodium,
total protein, and urea for all four platforms; albumin, ALT and GGT for
Abbott, Beckman, and Roche platforms) [Fig 1]. These results confirmed the previous
findings of bias assessment by the Australasian Association of Clinical
Biochemists, which concluded that chloride, phosphate, potassium, sodium,
total protein, and urea measurements showed sufficient similarity across
analytical platforms and laboratories and that common RIs could be
adopted.10 The same study found
method-specific bias in AST levels averaging +22% for assays using
pyridoxal-5-phosphate as an activator compared with those not using
pyridoxal-5-phosphate.10 Our
results showed a lesser degree of pyridoxal-5-phosphate–related bias
(+7%), so this issue would not prevent the use of common RIs in the local
scenario.
For analytes with demonstrated agreement across
platforms and laboratories, the RIs are theoretically expected to be the
same if obtained from the same group of reference (ie, ‘healthy’)
individuals. In actual practice, for the seven analytes mentioned above,
all of the adult RIs varied across laboratories, with the CV of the upper
and lower limits of the RIs up to 11% and 7.4%, respectively. The
inter-laboratory percentage differences of upper RI limits were up to 47%
for AST (absolute difference: 16 U/L), 29% for urea (1.8 mmol/L), and 18%
for potassium (0.8 mmol/L), and those of the lower RI limits were up to
24% for urea (0.6 mmol/L), 22% for phosphate (0.16 mmol/L), and 8% for
total protein (5 g/L). We can compare the CVs of these analytes’ RIs
against the corresponding between-subject biological variation (CV-G)
values published by Ricos et al.13
The CV of the upper RI limits of potassium and sodium were 1.2 and 1.0
times those of CV-G, respectively while that of the lower RI limits of
sodium and phosphate were 1.1 and 0.6 times those of CV-G, respectively.
These RI variations generate significant additional bias during
interpretation, which is often overlooked and unchecked. Furthermore,
laboratories were using different RIs despite using the same analytical
platforms and methodologies for these analytes. For example, among users
of the Abbott platform, the potassium RIs of labs 1 and 2 were 3.6 to 5.2
mmol/L for samples of both sexes, while that of lab 3 was 3.5 to 4.5
mmol/L for male and 3.4 to 4.4 mmol/L for female samples. These variations
were unnecessary, as supported by the sufficient agreement across
analytical platforms and laboratories. Application of different RIs in
various circumstances could lead to confusion among interpreters and
hinder data management in the era of electronic health records.4 14 Similar
trends of unexplained RI variations were previously observed in the UK for
sodium, potassium, and other analytes, and this eventually lead to the
Pathology Harmony group’s recommendation of harmonised RIs.7 At present, local laboratories often spend substantial
human resources on decisions and maintenance regarding the appropriate RIs
for large numbers of analytes. The use of common RIs for these seven
analytes would unite local laboratory practices, facilitate electronic
communications between laboratory information and electronic patient
record systems, and streamline the maintenance of RIs.
For creatinine, low bias was noted for seven
laboratories using the Jaffe methods, but this tendency spared the
laboratories that used the enzymatic method on the Beckman platform. This
bias was likely related to the high variability of the Jaffe method at low
creatinine concentrations, which has been reported to be up to 30% on some
platforms.15 While the remarkably
good analytical agreement shown for the remaining five higher
concentrations of creatinine support the use of common RIs, this should be
cautiously reviewed, as the lowest concentration of creatinine (67 μmol/L)
is very close to the lower RI limit. Further study of bias may be
warranted for creatinine.
Substantial bias exceeding the ALE was demonstrated
for the remaining six analytes, with high bias for ALT and GGT and low
bias for albumin, ALP, and calcium on the Siemens platform; low bias for
ALP on the Roche platform; low bias for calcium at one laboratory using
the Beckman platform; and low bias for total bilirubin in labs 1 to 3, 7,
and 8. Positive bias averaging 8% for albumin was observed for
laboratories using the bromocresol green method compared with the
bromocresol purple method, a pattern similar to the findings of Koerbin et
al.10 16
Bias in ALT measurement could be attributed to differences in assay
design,10 with an average of +7%
bias shown for the assay using pyridoxal-5-phosphate over the assay that
does not use it. Bias for calcium and total bilirubin could be related to
methodological differences between platforms, while bias for ALP and GGT
were likely to be specific to the analytical platform. While the
feasibility of local common RIs for these six analytes was not confirmed
by this study, our findings indicate that common RIs could still be
considered for albumin, ALT, and GGT in laboratories using the Abbott,
Beckman, and Roche platforms, which all laboratories except one use.
Variable adoptions of sex-specific RIs were another
key finding of the survey. Heterogeneous and inconsistent practices of sex
partitioning for RIs were noted in eight analytes (ALP, ALT, AST,
phosphate, potassium, total bilirubin, total protein, and urea). Moreover,
sex-specific RIs were sometimes different even within the same platform.
For example, the upper RI limit of GGT in male samples differed by 35 U/L
among users of the Roche platform, and the upper RI limit of ALP differed
by 40 U/L and 7 U/L in male and female samples, respectively, among users
of the Abbott platform. Common RIs with united practice of sex
partitioning could be the solution to converge these practices.
Historically, heterogeneous and sometimes
incomparable results of the same measurands could be obtained with
different assays because of suboptimal standardisations in pre-analytical
and analytical factors. Laboratory-specific RIs were advocated to
compensate and allow for sound interpretations of laboratory results in
clinical settings.17 Realising the
need for assay standardisation, an enormous global effort has been taken
in the past 60 years to study biological variability, standardise
pre-analytical conditions and analytical methods, improve quality control,
establish traceability of reference materials and methods, and implement
EQAPs for various kinds of assays, led by the International Federation of
Clinical Chemistry (IFCC) and other international/national organisations.18 Major successes have been
realised for a large number of measurands, as listed on the website of the
International Consortium for Harmonization of Clinical Laboratory Results.19
The concept of common RIs emerged in the early
2000s and has gained huge popularity over the past decade.4 The theory is
simple: if the measured results of different assays are comparable, ie
with adequate assay standardisation, the same RIs should be adopted given
that the tests are performed on the same reference population.17 Redundant variations of RIs merely impair
interpretation.
Presently, there are two types of common RIs:
‘objective’ and ‘subjective’ ones.20
Subjective common RIs were generally defined by scientific surveys and
expert guidance with the harmonisation approach. Examples include the
“agreed Pathology Harmony clinical biochemistry reference intervals for
adults” for 15 general chemistry analytes recommended by the UK Pathology
Harmony Group in 201121 and the
“adult harmonised reference intervals” for 18 general chemistry analytes
recommended by the Australasian Association of Clinical Biochemists and
endorsed by the Royal College of Pathologists of Australasia in 2016.16 22 23 The two groups have since continued their work on
harmonisation of various aspects of pathology in the past decade, with the
UK Pathology Harmony Group working on the Pathology Harmony bookmark for
tumour markers and requesting guidance for non-specialists, and the
Australasian Association of Clinical Biochemists working on harmonisation
of paediatric common RIs, serum protein electrophoresis reporting, lipid
reporting, management and communication of high-risk lab results, arterial
and venous blood gas RIs, and reporting of dynamic endocrine testing for
adults and paediatric patients.6 7 8
16 24
25 26
Objective common RIs refer to those defined by
well-conducted, multicentre reference studies, such as the Nordic Trueness
Project, which was conducted with well-standardised pre-analytical and
analytical handlings and the use of five control materials. The project
involved 102 Nordic routine clinical biochemistry laboratories and more
than 2500 carefully selected healthy reference individuals.27 The Nordic Reference Interval Project RIs for 25
general chemistry analytes were established and published in 2002 and
implemented throughout Nordic countries in 2004 with the help of the
Scandinavian Society of Clinical Chemistry.27
28 29
30 Among Asian countries, the
Japan Society of Clinical Chemistry has recently published their
nationwide common RIs for 40 laboratory tests determined by three
multicentre RI studies.31 Table
2 8 21 23 28 31
summarises the common RIs published in different parts of world for the
general chemistry analytes surveyed and the common RIs proposed by our
study.
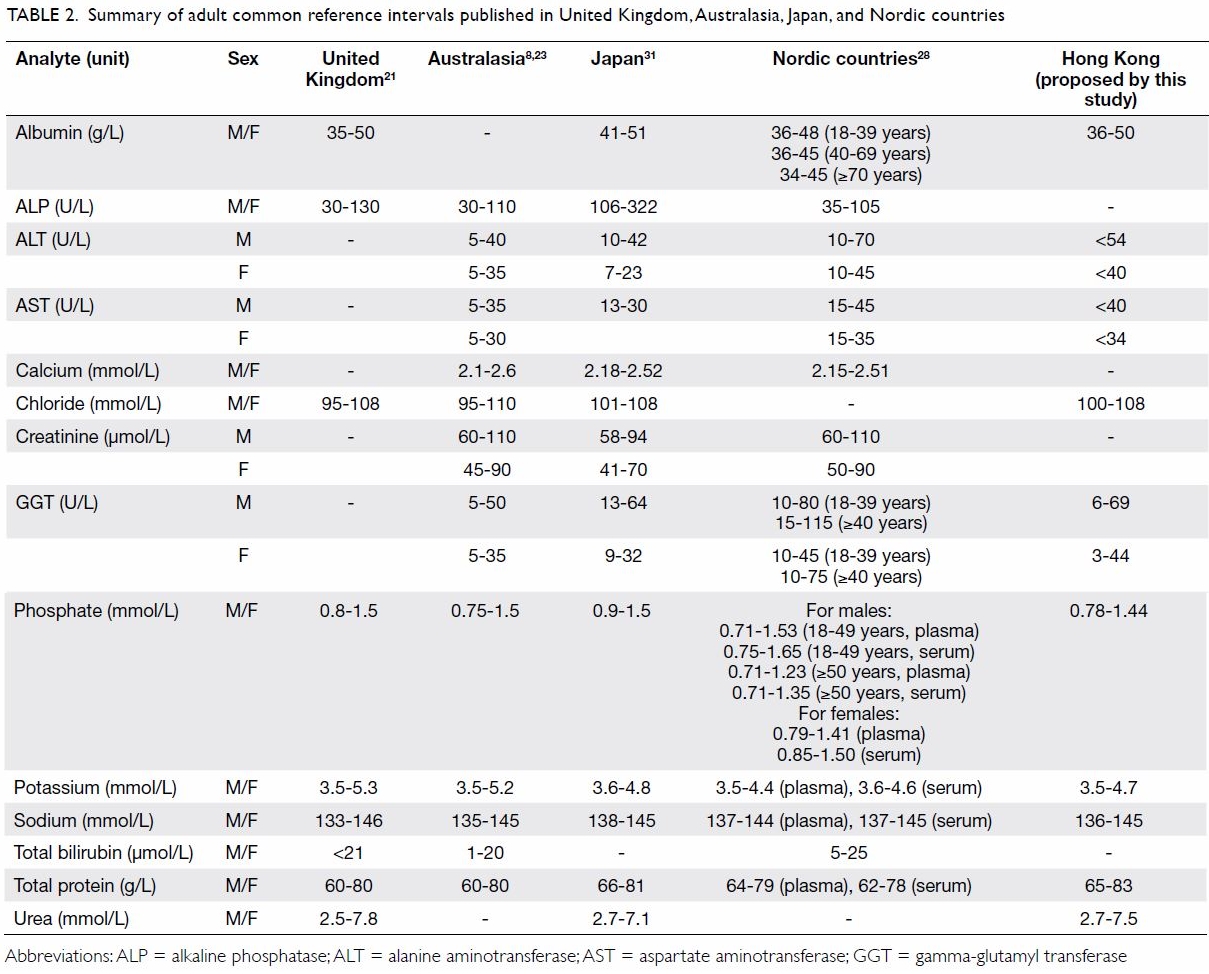
Table 2. Summary of adult common reference intervals published in United Kingdom, Australasia, Japan, and Nordic countries
In 2017, the IFCC Committee on Reference Intervals
and Decision Limits (C-RIDL) published two landmark papers on the results
of their global multicentre study on reference values of 25 chemistry
analytes in 13 386 healthy adults recruited from 12 countries, including
China,32 with the use of a
specially designed serum panel.33
34 The study explored the
regionality and ethnicity of these reference values globally and provided
invaluable information for the possibility of future derivation and
transference of the established RIs through use of the C-RIDL serum panel.34
The relatively small number and choice of QAP
specimens for retrospective methodological comparisons represent a major
limitation of our survey. Artificial materials used in QAP specimens
generally gave rise to more variable and method-dependent results due to
matrix effects.9 Despite this, our
survey demonstrated that methodological bias would not prevent the use of
common RIs for seven general chemistry analytes. For the remaining
analytes, we speculate that the degree of methodological bias may be
exaggerated by the matrix effect of the QAP, ie, the actual analytical
difference is likely to be smaller when tested with a patient sample. Our
findings should be verified with a formal prospective bias study with a
standardised protocol and the use of another set of blood specimens,
preferably unadulterated human samples, with pre-assigned reference values
to ensure commutability.
This survey compared the adult RIs of 14 general
chemistry analytes among 10 chemical pathology laboratories using four
different analytical platforms. Bias assessments and comparisons of RIs
revealed that different and variable RIs were provided by the laboratories
despite sufficient inter-laboratory and inter-platform agreement regarding
the RIs of 10 general chemistry analytes. The use of common RIs was found
to be feasible and is recommended for these 10 analytes. Such use would
unify and improve local standards of clinical laboratory practice. A
well-designed implementation plan for common RIs with support from
stakeholders including clinicians, pathologists, and scientists would be
vital for the success of such a substantial project. Figure
3 shows our proposed implementation plan for the introduction of
common RIs in Hong Kong, modified from the plan suggested by Tate et al8 for the harmonisation of adult and
paediatric RIs in Australasia. Furthermore, the concept of common RIs
could be expanded to cover more general chemistry analytes, eg, creatine
kinase and magnesium; special chemical tests, eg, therapeutic drug
monitoring and hormones; other clinical laboratory specialties, such as
haematology and immunology; and paediatric RIs.6
7 8
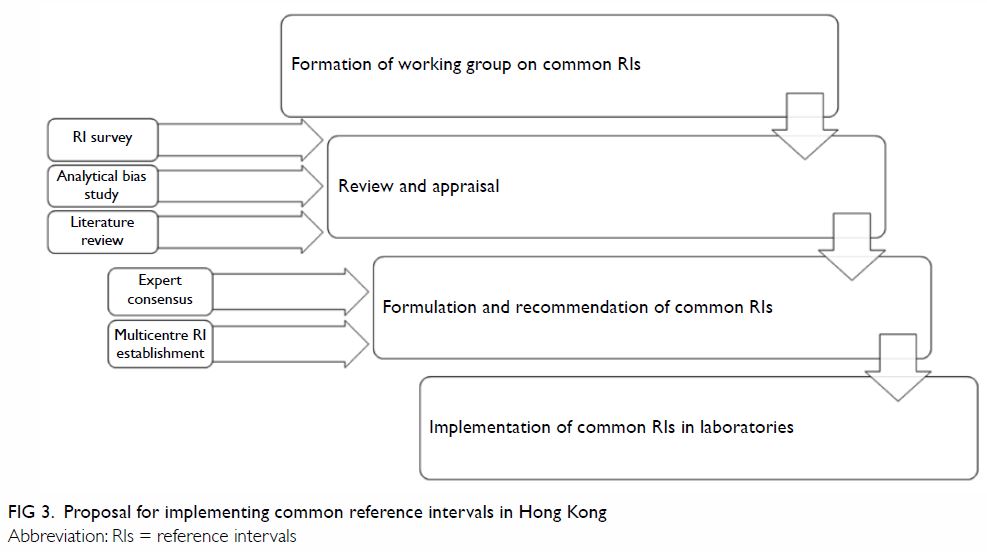
Figure 3. Proposal for implementing common reference intervals in Hong Kong
Author contributions
All authors contributed to the concept or design,
drafting of the article, and critical revision for important intellectual
content. All authors had full access to the data, contributed to the
study, approved the final version for publication, and take responsibility
for its accuracy and integrity.
Conflicts of interest
All authors have disclosed no conflicts of
interest.
Funding/support
This research received no specific grant from any
funding agency in the public, commercial, or not-for-profit sectors.
Ethics approval
The present survey is a retrospective observational
review of local laboratory practice and external quality assurance program
data with no patient participation, no access to private or sensitive
patient data, no collection or analysis of human body fluid or tissue. The
quality assurance program materials used for the data collection in the
survey are processed samples designed by the external quality assurance
program organiser to mimic the properties of clinical sample. Therefore,
ethics approval was not applicable for this study.
References
1. Plebani M, Lippi G. Reference values and
the journal: why the past is now present. Clin Chem Lab Med 2012;50:761-3.
Crossref
2. Defining, Establishing, and Verifying
Reference Intervals in the Clinical Laboratory; Approved Guideline—Third
Edition. Clinical and Laboratory Standards Institute; 2010.
3. Ceriotti F, Hinzmann R, Panteghini M.
Reference intervals: the way forward. Ann Clin Biochem 2009;46:8-17. Crossref
4. Jones GR, Barker A, Tate J, Lim CF,
Robertson K. The case for common reference intervals. Clin Biochem Rev
2004;25:99-104.
5. Barth JH, Luvai A, Jassam N, et al.
Comparison of method-related reference intervals for thyroid hormones:
studies from a prospective reference population and a literature review.
Ann Clin Biochem 2018;55:107-12. Crossref
6. Berg J. The approach to pathology
harmony in the UK. Clin Biochem Rev 2012;33:89-93.
7. Berg J. The UK Pathology Harmony
initiative; The foundation of a global model. Clin Chim Acta
2014;432:22-6. Crossref
8. Tate JR, Sikaris KA, Jones GR, et al.
Harmonising adult and paediatric reference intervals in Australia and New
Zealand: an evidence-based approach for establishing a first panel of
chemistry analytes. Clin Biochem Rev 2014;35:213-35.
9. Jones G, Barker A. Standardisation of
reference intervals: an Australasian view. Clin Biochem Rev
2007;28:169-73.
10. Koerbin G, Tate JR, Ryan J, et al.
Bias assessment of general chemistry analytes using commutable samples.
Clin Biochem Rev 2014;35:203-11.
11. Jones GR, Sikaris K, Gill J.
‘Allowable limits of performance’ for external quality assurance
programs—an approach to application of the Stockholm Criteria by the RCPA
Quality Assurance Programs. Clin Biochem Rev 2012;33:133-9.
12. Ozarda Y. Reference intervals: current
status, recent developments and future considerations. Biochem Med
(Zagreb) 2016;26:5-16. Crossref
13. Ricós C, Alvarez V, Cava F, et al.
Current databases on biological variation: pros, cons and progress. Scand
J Clin Lab Invest 1999;59:491-500. Crossref
14. Koerbin G, Sikaris KA, Jones GR, et
al. Evidence-based approach to harmonised reference intervals. Clin Chim
Acta 2014;432:99-107. Crossref
15. Hoste L, Deiteren K, Pottel H,
Callewaert N, Martens F. Routine serum creatinine measurements: how well
do we perform? BMC Nephrol 2015;16:21. Crossref
16. Koerbin G, Sikaris K, Jones GR, et al.
An update report on the harmonization of adult reference intervals in
Australasia. Clin Chem Lab Med 2018;57:38-41. Crossref
17. Ceriotti F. Prerequisites for use of
common reference intervals. Clin Biochem Rev 2007;28:115-21.
18. Siest G, Henny J, Gräsbeck R, et al.
The theory of reference values: an unfinished symphony. Clin Chem Lab Med
2013;51:47-64. Crossref
19. International Consortium for
Harmonization of Clinical Laboratory Results. Summary of measurand
harmonization activities. Available from:
www.harmonization.net/measurands/. Accessed 27 Mar 2019.
20. Ozarda Y, Sikaris K, Streichert T,
Macri J; IFCC Committee on Reference Intervals and Decision Limits
(C-RIDL). Distinguishing reference intervals and clinical decision
limits—a review by the IFCC Committee on Reference Intervals and Decision
Limits. Crit Rev Clin Lab Sci 2018;55:420-31. Crossref
21. Berg J, Lane V. Pathology Harmony; a
pragmatic and scientific approach to unfounded variation in the clinical
laboratory. Ann Clin Biochem 2011;48(Pt 3):195-7. Crossref
22. Jones GR, Koetsier S. Uptake of
recommended common reference intervals for chemical pathology in
Australia. Ann Clin Biochem 2017;54:395-7. Crossref
23. Koerbin G, Tate JR. Harmonising adult
reference intervals in Australia and New Zealand—the continuing story.
Clin Biochem Rev 2016;37:121-9.
24. Campbell C, Caldwell G, Coates P, et
al. Consensus statement for the management and communication of high risk
laboratory results. Clin Biochem Rev 2015;36:97-105.
25. Tate J, Caldwell G, Daly J, et al.
Recommendations for standardized reporting of protein electrophoresis in
Australia and New Zealand. Ann Clin Biochem 2012;49:242-56. Crossref
26. Australasian Association of Clinical
Biochemists. Harmonisation: guideline, publications, history, committee.
Available from: www.aacb.asn.au/aboutus/harmonisation. Accessed 27 Mar
2019.
27. Pedersen MM, Ornemark U, Rustad P, et
al. The Nordic Trueness Project 2002: use of reference measurement
procedure values in a general clinical chemistry survey. Scand J Clin Lab
Invest 2004;64:309-20. Crossref
28. Rustad P, Felding P, Franzson L, et
al. The Nordic Reference Interval Project 2000: recommended reference
intervals for 25 common biochemical properties. Scand J Clin Lab Invest
2004;64:271-84. Crossref
29. Strømme JH, Rustad P, Steensland H,
Theodorsen L, Urdal P. Reference intervals for eight enzymes in blood of
adult females and males measured in accordance with the International
Federation of Clinical Chemistry reference system at 37 degrees C: part of
the Nordic Reference Interval Project. Scand J Clin Lab Invest
2004;64:371-84. Crossref
30. Rustad P, Felding P, Lahti A, Hyltoft
Petersen P. Descriptive analytical data and consequences for calculation
of common reference intervals in the Nordic Reference Interval Project
2000. Scand J Clin Lab Invest 2004;64:343-70. Crossref
31. Ichihara K, Yomamoto Y, Hotta T, et
al. Collaborative derivation of reference intervals for major clinical
laboratory tests in Japan. Ann Clin Biochem 2016;53:347-56. Crossref
32. Xia L, Chen M, Liu M, et al.
Nationwide multicenter reference interval study for 28 common biochemical
analytes in China. Medicine (Baltimore) 2016;95:e2915. Crossref
33. Ichihara K, Ozarda Y, Barth JH, et al.
A global multicenter study on reference values: 1. Assessment of methods
for derivation and comparison of reference intervals. Clin Chim Acta
2017;467:70-82. Crossref
34. Ichihara K, Ozarda Y, Barth JH, et al.
A global multicenter study on reference values: 2. Exploration of sources
of variation across the countries. Clin Chim Acta 2017;467:83-97. Crossref