Hong
Kong Med J 2019 Jun;25(3):252–3.e1–2
© Hong Kong Academy of Medicine. CC BY-NC-ND 4.0
PICTORIAL MEDICINE
Native T1 mapping for the diagnosis of Anderson-Fabry
disease with myocardial hypertrophy
Victor SH Chan, MB, BS, FRCR1; W Zhou,
MB, BS2; Stephen CW Cheung, MRCP, FHKAM (Radiology)1;
MY Ng, BMBS, FRCR2
1 Department of Radiology, Queen Mary
Hospital, Pokfulam, Hong Kong
2 Department of Diagnostic Radiology, Li
Ka Shing Faculty of Medicine, The University of Hong Kong, Pokfulam, Hong
Kong
Corresponding author: Dr MY Ng (myng2@hku.hk)
 Full
paper in PDF
Full
paper in PDF
A 66-year-old woman previously treated for
hypertrophic cardiomyopathy (HCM) underwent cardiac magnetic resonance
imaging for further assessment. The modified Look-Locker sequence 5s(3s)3s
was performed on a Philips Achieva 3T magnetic resonance scanner (Philips,
Amsterdam, Netherlands). Cardiac magnetic resonance had revealed a
combined apical and asymmetrical hypertrophy of the left ventricle (Fig
1). There was a diffuse, non-ischaemic pattern of late gadolinium
enhancement in the region of hypertrophy in keeping with HCM. The
septal:lateral wall ratio on the 4-chamber view was 2.2:1. The
mid-inferoseptal:anterolateral ratio on the short-axis view was 1.32:1.
However, native T1 mapping was abnormally low (1009 ms; normal range on
our scanner, 1226-1256 ms) [Fig 2]. T2 mapping values were in the normal range
indicating no underlying iron deposition to account for the low T1 values.
Low native T1 mapping values are atypical of HCM that would normally be
associated with a slight increase in native T1. This suggested underlying
Anderson-Fabry disease (AFD), subsequently proven by genetic testing in
this patient.
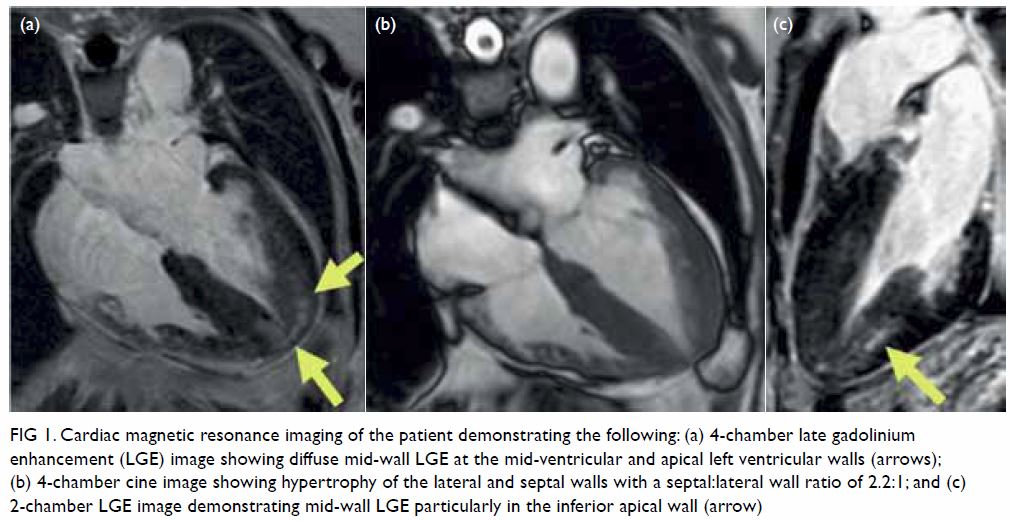
Figure 1. Cardiac magnetic resonance imaging of the patient demonstrating the following: (a) 4-chamber late gadolinium enhancement (LGE) image showing diffuse mid-wall LGE at the mid-ventricular and apical left ventricular walls (arrows); (b) 4-chamber cine image showing hypertrophy of the lateral and septal walls with a septal:lateral wall ratio of 2.2:1; and (c) 2-chamber LGE image demonstrating mid-wall LGE particularly in the inferior apical wall (arrow)
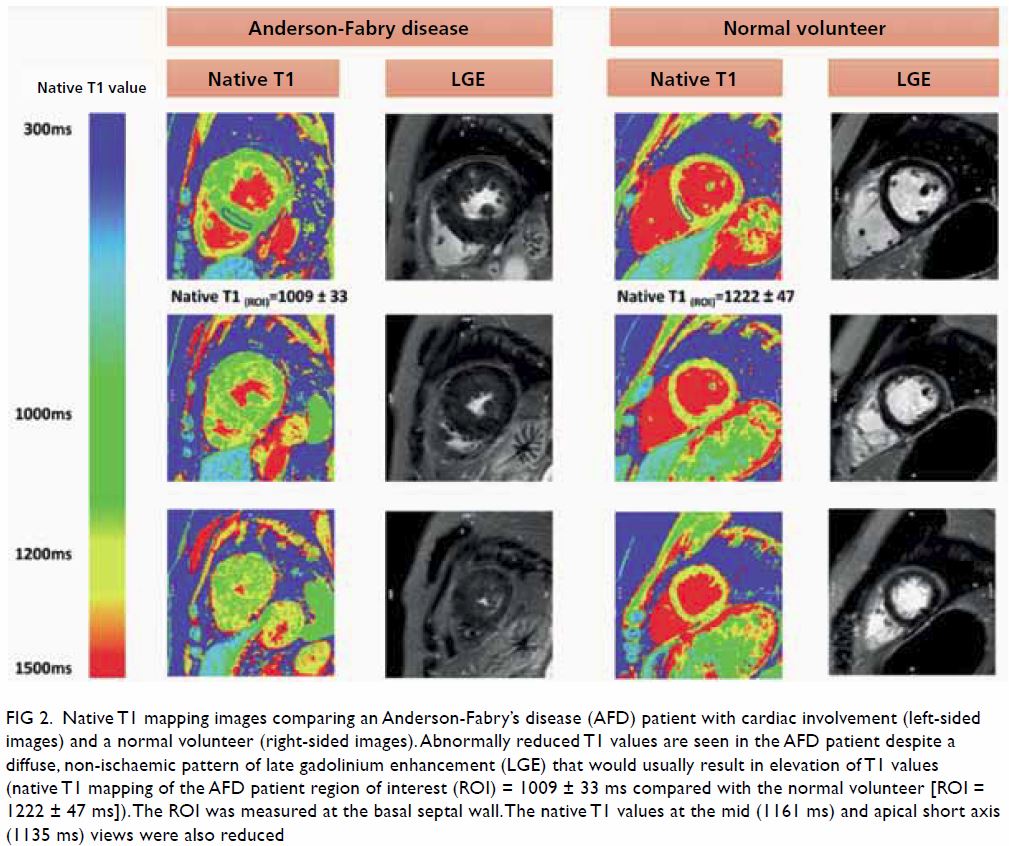
Figure 2. Native T1 mapping images comparing an Anderson-Fabry’s disease (AFD) patient with cardiac involvement (left-sided images) and a normal volunteer (right-sided images). Abnormally reduced T1 values are seen in the AFD patient despite a diffuse, non-ischaemic pattern of late gadolinium enhancement (LGE) that would usually result in elevation of T1 values (native T1 mapping of the AFD patient region of interest (ROI) = 1009 ± 33 ms compared with the normal volunteer [ROI = 1222 ± 47 ms]). The ROI was measured at the basal septal wall. The native T1 values at the mid (1161 ms) and apical short axis (1135 ms) views were also reduced
Anderson-Fabry disease is an uncommon X-linked
sphingolipid storage disorder resulting from deficiency of the lysosomal
enzyme α-galactosidase. The principal driver of mortality in AFD is
cardiac disease.1 Disease manifestations include left ventricle
hypertrophy that can mimic HCM.2 Other complications of AFD include valve
thickening, myocardial scarring, cardiac failure and arrhythmic death.3
Enzyme replacement therapy for AFD should be started early to prevent
progression of cardiac disease. Cardiac magnetic resonance myocardial
native T1 is decreased in AFD and is a non-invasive method that may raise
suspicion of AFD in the context of left ventricle hypertrophy or suspected
HCM. Native T1 mapping is an established reproducible technique.1 Raising
suspicion and later confirming AFD is crucial to managing these patients
appropriately as well as initiating screening in asymptomatic family
members.
Author contributions
All authors have made substantial contributions to
the concept or design of this study; acquisition of data; analysis or
interpretation of data; drafting of the manuscript; and critical revision
for important intellectual content. All authors had full access to the
data, contributed to the study, approved the final version for
publication, and take responsibility for its accuracy and integrity.
Conflicts of interest
The authors have no conflicts of interest to
disclose.
Funding/support
This research received no specific grant from any
funding agency in the public, commercial, or not-for-profit sectors.
Ethics approval
Relevant patient consent was obtained for the
purpose of this case study.
References
1. Pica S, Sado DM, Maestrini V, et al.
Reproducibility of native myocardial T1 mapping in the assessment of Fabry
disease and its role in early detection of cardiac involvement by
cardiovascular magnetic resonance. J Cardiovasc Magn Reson 2014;16:99. Crossref
2. Deva DP, Hanneman K, Li Q, et al.
Cardiovascular magnetic resonance demonstration of the spectrum of
morphological phenotypes and patterns of myocardial scarring in
Anderson-Fabry disease. J Cardiovasc Magn Reson 2016,18:14. Crossref
3. O’Mahony C, Elliott P. Anderson-Fabry
disease and the heart. Prog Cardiovasc Dis 2010;52:326-35. Crossref