© Hong Kong Academy of Medicine. CC BY-NC-ND 4.0
REMINISCENCE: ARTEFACTS FROM THE HONG KONG MUSEUM OF MEDICAL SCIENCES
Temperature charts from Bombay
Harry YJ Wu, MD, DPhil
Medical Ethics and Humanities Unit, Li Ka Shing
Faculty of Medicine, The University of Hong Kong
Invited author, Education and Research Committee, Hong Kong Museum of Medical Sciences Society
Invited author, Education and Research Committee, Hong Kong Museum of Medical Sciences Society
 Full paper in PDF
The temperature chart, sometimes referred to as
fever chart, represented a turning point in the progress of medicine from
superstition to science. In the days before advances in anatomical,
physiological and pathological knowledge, medical practitioners tried
numerous methods to understand the function of the body and the causes of
disease, especially infectious disease. A powerful tool in its day, the
temperature chart led researchers to the germ theory. Its significance in
clinical practice was epitomised in the lines in TS Eliot’s poem, East
Coker,
“The sharp compassion of the healer’s art Resolving
the enigma of the fever chart.”
The French Revolution stimulated enlightenment in
the 18th century; materialism in medicine followed that would provide the
infrastructure of empirical reasoning and rational dialogue among
academics, governments, and society.1 Stethoscopes and case records at stateowned hospitals, as well as temperature charts, all helped to make
disease profiles more identifiable and distinguishable. These innovations
originated in the so-called Parisian school of medicine that started using
new diagnostic instruments and methods to study disease in the 19th
century. Among these, temperature charts were an important tool for
clinicians, as they could reveal the characteristics of different fevers,
including enteric fever, Malta fever (brucellosis), rat-bite fever,
cholera, malaria, and dengue fever. Their use in research led to the
acceptance of the germ theory in the closing decades of the 19th century,
their value to project clinical observations on diseases with graphical
methods being, in Patrick Manson’s words, “universally admitted”. “They
facilitated the recording, and still more the comprehension and
comparison, of the facts in the clinical tableau.”2 Clearly, the chart provided a valuable common language, not only for scientific
correspondence but also in public health reports.
There are three temperature charts of plague
patients in the collection of the Hong Kong Museum of Medical Sciences,
along with a letter, dated 9 April 1897, from Nusservanji H Chosky, an
Indian doctor in Bombay, the capital city of the Indian state of
Maharashtra nowadays known as Mumbai. Chosky was originally a Medical
Officer of the Maratha Hospital but later appointed Assistant Health
Officer in charge of plague operations.3 The letter was addressed to James
Lowson, Acting Medical Superintendent at the Government Civil Hospital of
Hong Kong. The letter describes the use of Alexandre Yersin’s anti-plague
serum in three patients diagnosed with bubonic plague at the Jain Hospital
with different outcomes; one 36-year-old Hindu man went into remission
(Fig a) but two other teenagers, one Christian (Fig b) and the other from
the Jain religious community, died within 2 days of admission.
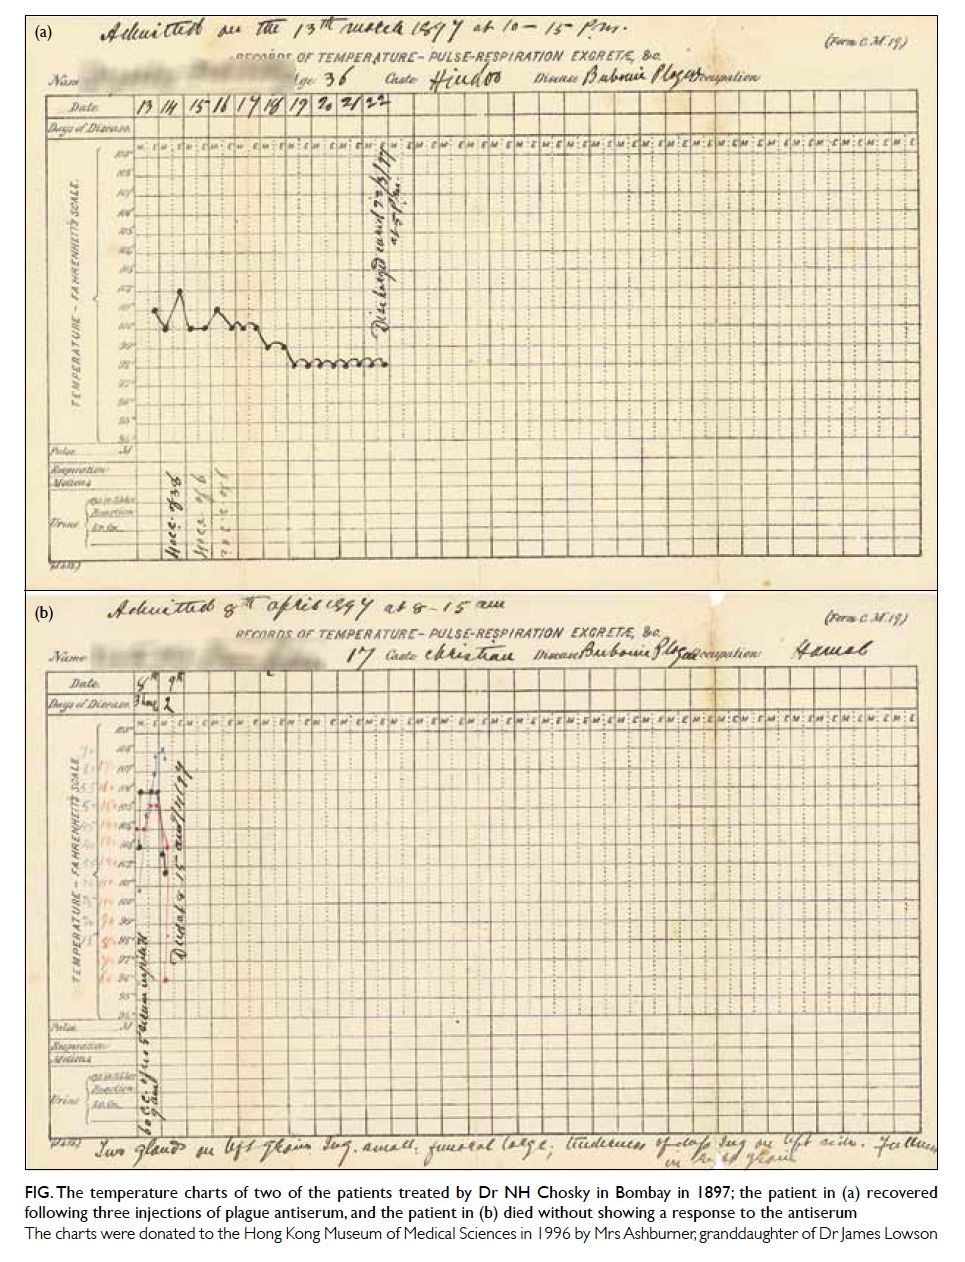
Figure. The temperature charts of two of the patients treated by Dr NH Chosky in Bombay in 1897; the patient in (a) recovered following three injections of plague antiserum, and the patient in (b) died without showing a response to the antiserum
The charts were donated to the Hong Kong Museum of Medical Sciences in 1996 by Mrs Ashburner, granddaughter of Dr James Lowson
Bombay, a cosmopolitan emporium of manufactured
goods, could not exempt itself from the invasion of bubonic plague in
the late summer of 1896, two years after the outbreak in Hong Kong.
Although the disease’s transmission remains under debate, these
infected cities directly and indirectly proved the significance to
public health of inter-city mobility and trading.4 While colonial port
cities became nodes in the infrastructure of modernity, they also
became foci of infectious diseases. The plague arrived in Bombay in
the late summer of 1896. It was suspected that the railway system,
while transforming Bombay by stimulating better urban planning,
housing conditions and drainage systems, unfortunately accelerated the
spread of the disease, an idea that had not been applied to the
outbreak in Hong Kong.5 Although it is unclear why Chosky wrote to
Lowson, their correspondence reveals how scientists networked with
each other in their response to the third global plague pandemic.
After suffering from the epidemic for 2 years, Hong Kong could provide
useful experience for health professionals in India. After reviewing
the fever patterns shown on the temperature charts, Chosky wondered
his patients in Bombay responded differently to Yersin’s serum
compared with those in China (Hong Kong). The serum was jointly
developed by Yersin and another Pasteur school bacteriologist, Emile
Roux, and is referred to as Yersin-Roux serum in most historical
accounts. These documents not only reveal that international
scientific networking had already started in Asia, beyond the reach of
the Europe-centred International Sanitary Conferences, but that
large-scale clinical trials had already been conducted, despite the
underdeveloped methodology of the day.
In Bombay, scientific activity on bubonic
plague was preceded by the 1894 discovery of Yersinia pestis
in Hong Kong, where research teams from the Koch and Pasteur
Institutes competed head-to-head. Although personally favouring
Shibasaburo Kitasato’s work over that of Alexandre Yersin, who arrived
3 days later, James Lowson did not allow the undercurrent of rivalry
to prevent him from networking with all the scientists to achieve an
effective response6 (an anecdote is described of how James Lowson
passed Yersin’s bacteria samples to the Japanese7). The plague in Hong
Kong had stimulated the ‘golden age of bacteriology’ as Hong Kong
became the hub for not only the study of pathology of bacterial
infection but also vaccine development. In less than 2 years, Bombay
had also become the test bed and marketplace for various competing
vaccines. In September, the Government of India asked the notable
bacteriologist Waldemar M Haffkine to establish the Plague Research
Laboratory where he set up experiments to study the infection routes
of bubonic plague and also produced a curative serum using the Yersin
method, although he later claimed that it was useless.8 Inspired by
Hong Kong’s work on the infectivity of pigs, that of other livestock
was studied during the Bombay outbreak. In addition, the transmission
of bubonic plague via insects, eg fleas, was also investigated by
different research teams in India.3 Regarding the preventive work, the
vaccines and serums (called “prophylactic fluid” at the time) that
were developed in the Plague Research Laboratory and other workshops
were tested in hospitals, orphanages, and jails; even slums became
living laboratories. In these experiments, the most important means by
which to study the outcome of inoculation was the taking and recording
of the subjects’ temperatures.9
Chosky’s temperature charts are unique. As
Assistant Health Officer, he not only conducted experiments on
patients he recruited but also provided samples for other scientists.
Most notably, he inoculated plague patients with eight vaccines
developed by different scientists worldwide. Chosky confirmed
Haffkine’s observation that the Yersin- Roux serum was not fully
effective. Having tested all eight vaccines, he eventually endorsed
the plague serum developed by A Lustig, then Professor of Pathology at
the Royal University of Florence. Notably, in Chosky’s experiments,
the subjects of the clinical trials were all native Indians and, for
the first time, so was the trial leader. Although other trials were
criticised for being racially discriminative, the knowledge that the
leader was one of their own meant that his inoculation plans were much
more acceptable to his compatriots. The addressee of the letter, James
Lowson, later also stayed in India for a short period before returning
to Scotland in 1933.
In many clinical settings, although our
knowledge of pathology has progressed to cellular and molecular
levels, the temperature chart remains relevant and in use,
particularly in hospitals, to record disease progress. Public health
still benefits. Members of the public caught up in the outbreak of
severe acute respiratory syndrome during 2002 to 2004 in Hong Kong
were taught that good self-health management should include a charted
record of body temperature. Today, this may be regarded as a minor
diagnostic tool, but a century ago, when scientific beliefs and levels
of trust among scientists, governments and society varied enormously,
the value of the chart was far greater than we can imagine.
Acknowledgement
The author acknowledges Prof Pratik Chakrabarti’s help in deciphering
Nusservanji H Chosky’s signature.
References
1. Barnett R. The sick rose: disease and the art of medical illustration. London: Distributed Art Publishers; 2014.
2. Manson P. A malaria chart. Br Med J 1894;2:1252-4. Crossref
3. Verjbitski DT, Bannerman WB, Kápadiâ RT. Reports on plague investigations in India. J Hyg (Lond) 1908;2:161-308.
4. Harrison M. Contagion: how commerce has spread disease. New Haven, CT: Yale University Press; 2012.
5. Peckham R. Epidemics in modern Asia. Cambridge: Cambridge University Press; 2016. Crossref
6. Solomon T. Hong Kong, 1894: the role of James A Lowson in the controversial discovery of the plague bacillus. Lancet 1997;350:59-62. Crossref
7. Deville P. Plague and cholera. London: Little, Brown Book Group; 2014.
8. Chakrabarti P. Bacteriology in British India: Laboratory medicine and the tropics. Rochester: Rochester University Press; 2012.
9. Hume E. A study of one hundred inoculations against plague. Public Health Rep 1904;19:1477-83.